Equity Master Projector

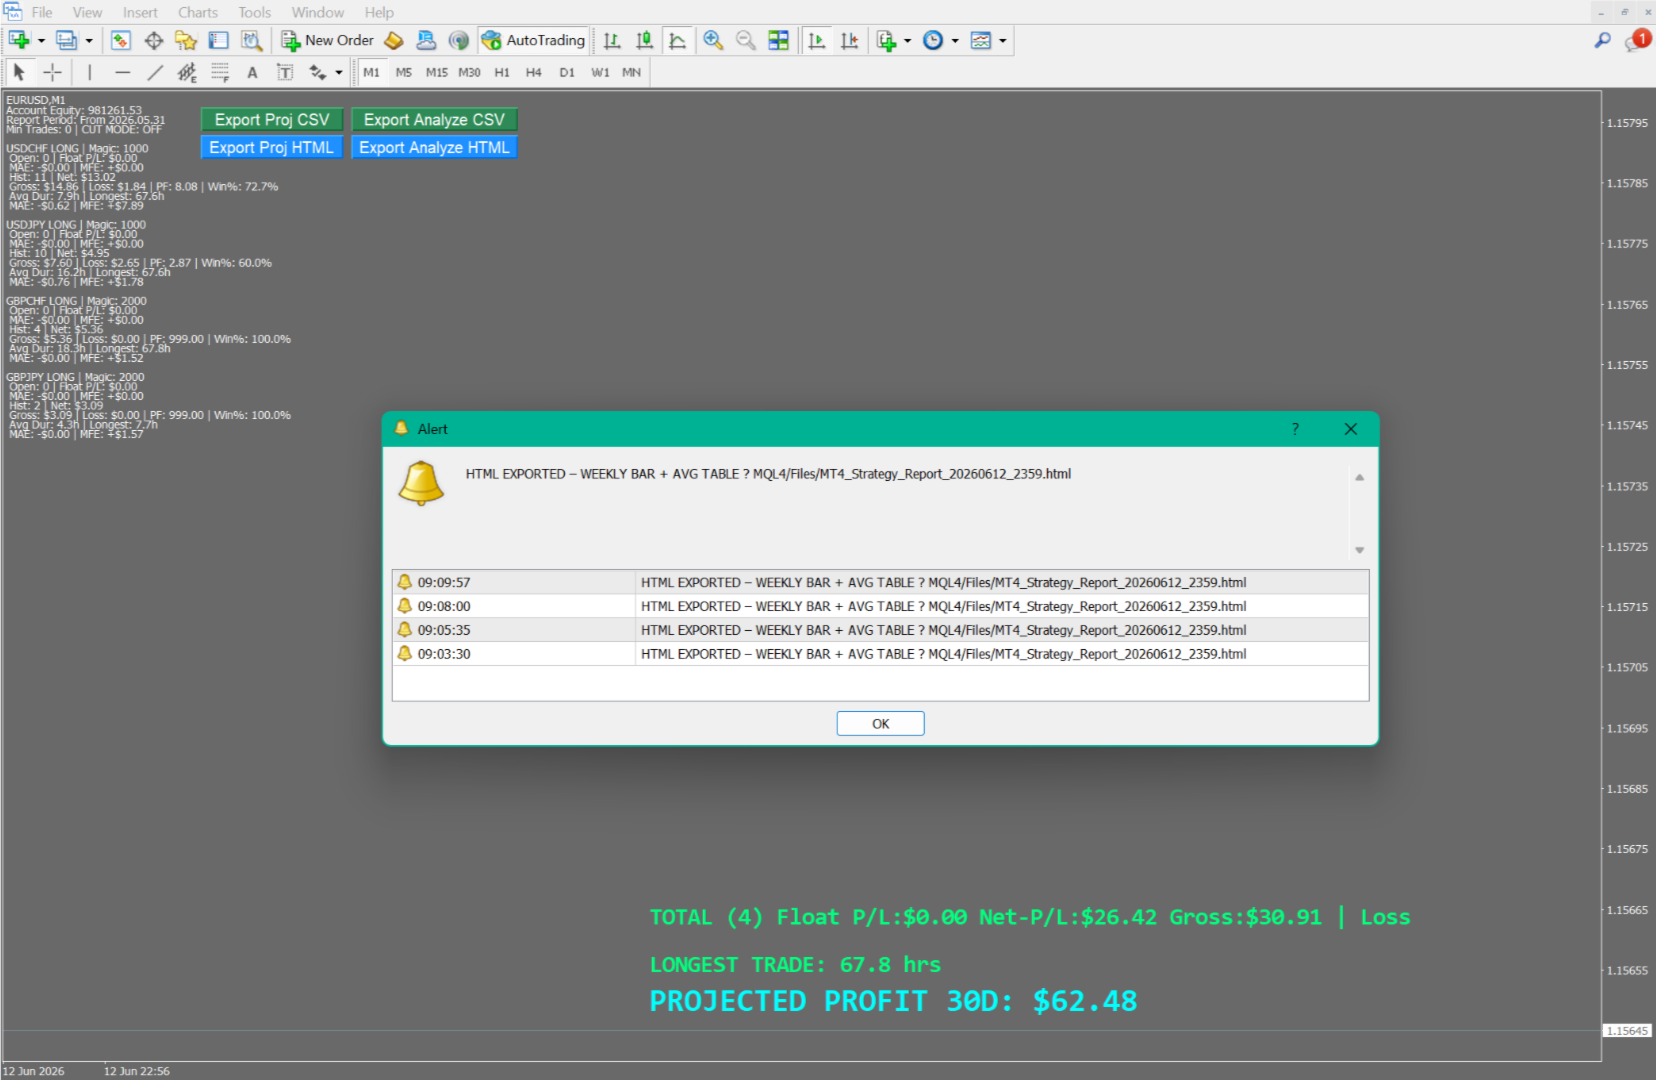
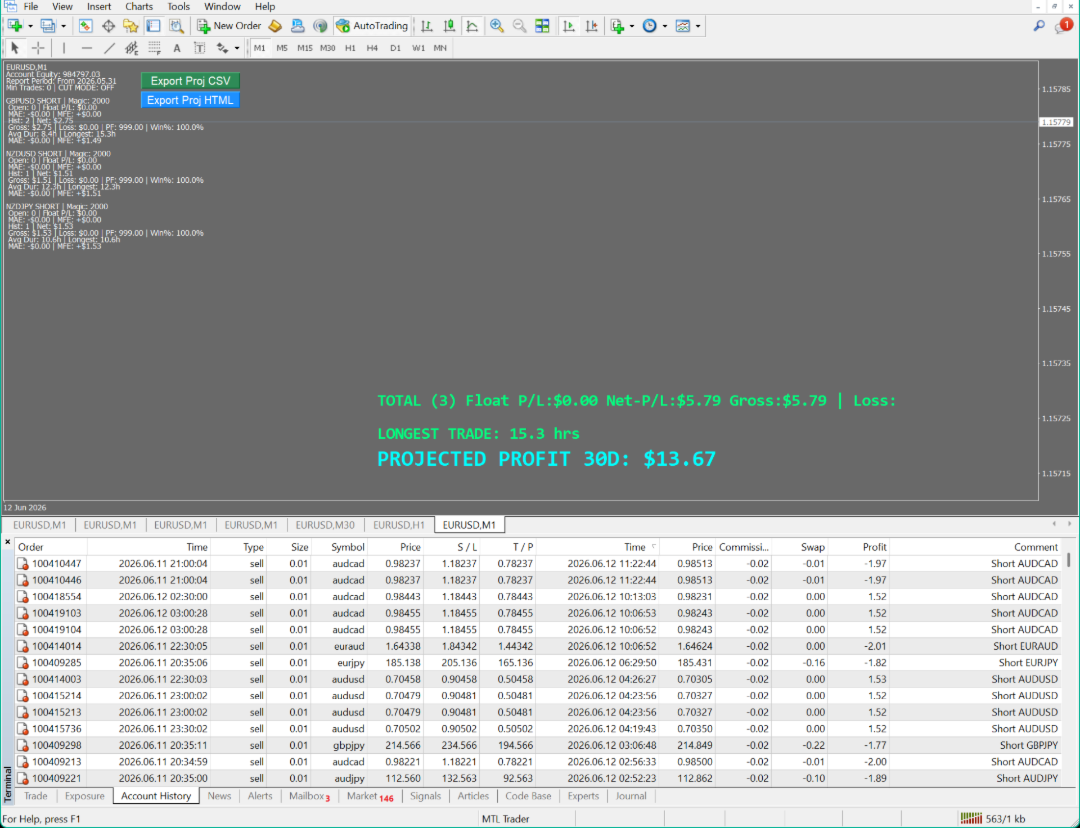
Project profits with precision. Equity Master Projection is a comprehensive trade management and analytics dashboard that goes beyond simple equity tracking. It analyzes both open positions and historical trades across multiple symbols and magic numbers, applying powerful filters to isolate your best-performing strategies. With unique features like a "Cut Mode" for profit capping and dynamic HTML/CSV reporting with equity curve charts, this tool transforms raw trading data into a clear, actionable strategy plan.

Key Features:
Dual-Mode Analysis: Simultaneously tracks Floating P/L on open positions and Net P/L on historical trades.
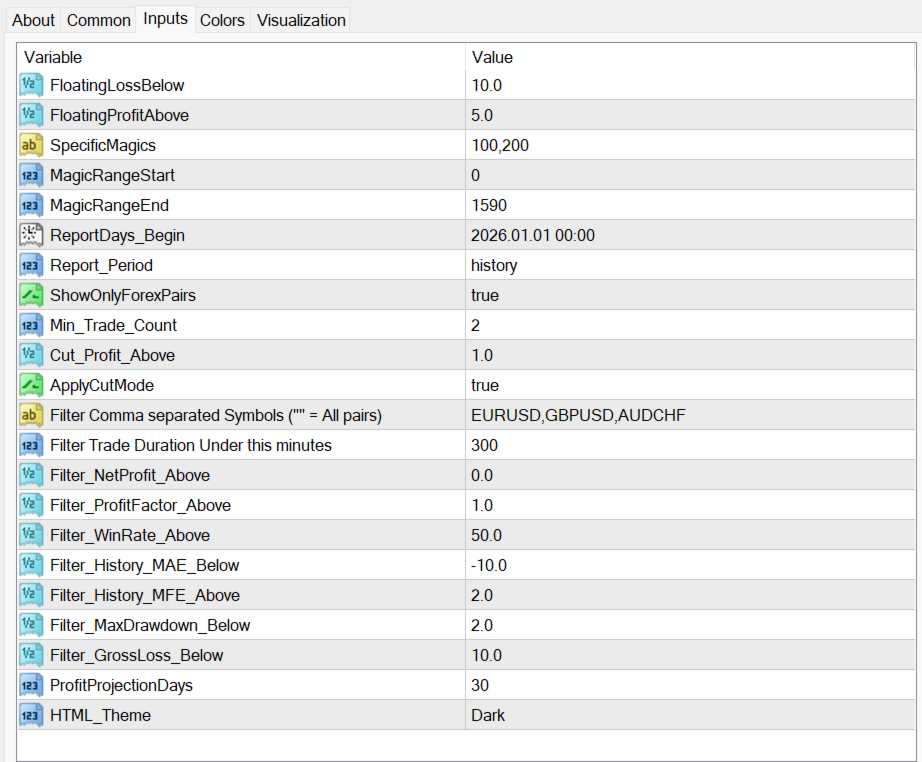
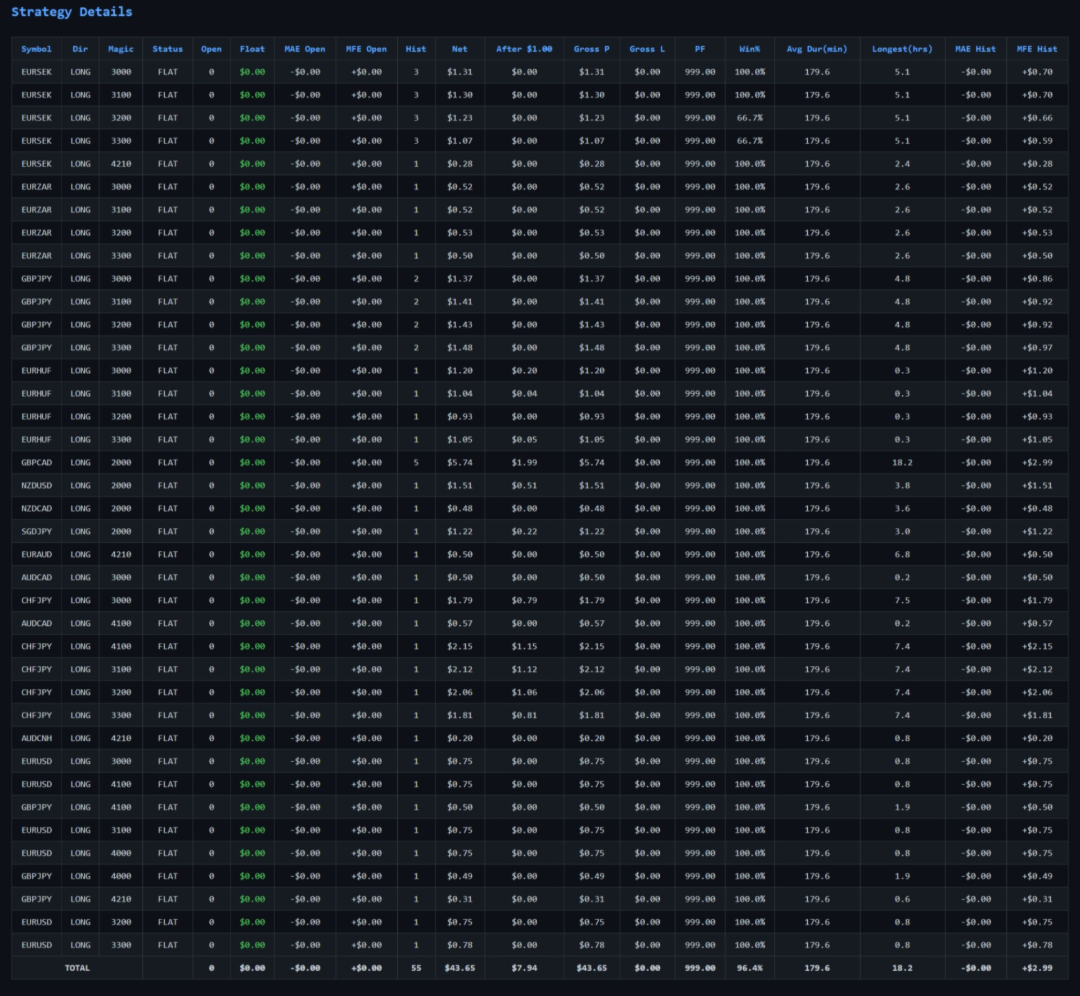
Advanced Filtering System: Filter strategies by Net Profit, Profit Factor, Win Rate, Maximum Drawdown, Gross Loss, Historical MAE/MFE, and Maximum Trade Duration.
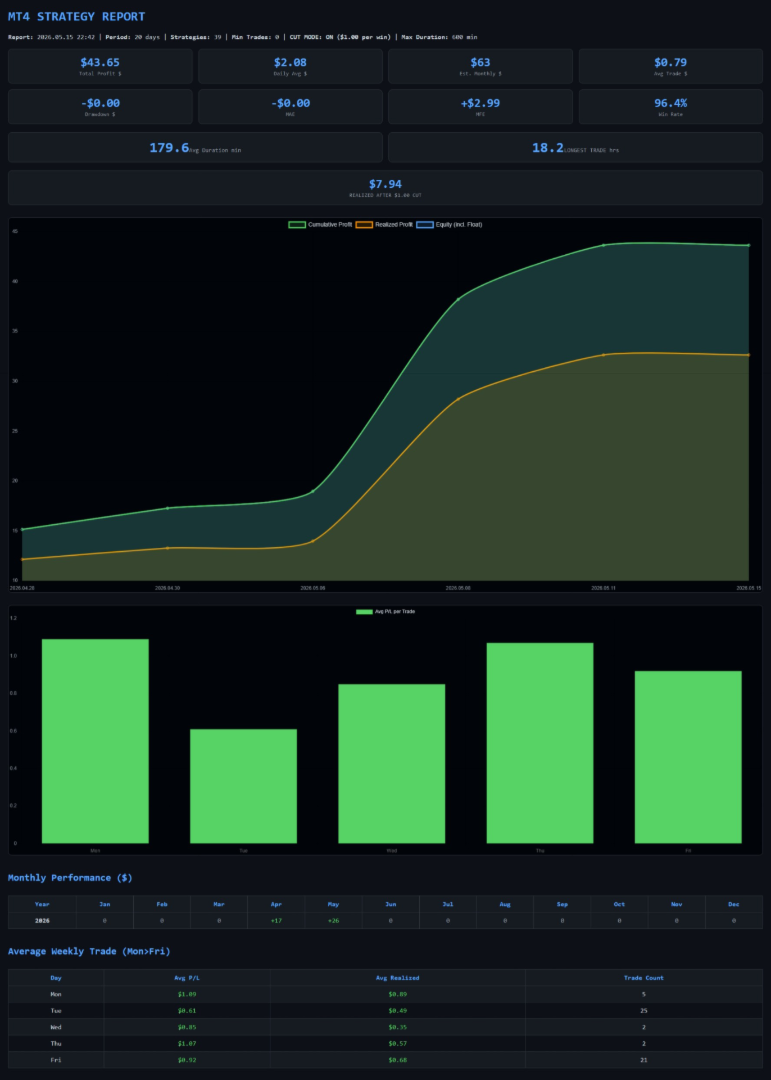
Cut Mode (Profit Capping): Simulates the financial impact of capping winning trades at a user-defined profit level, calculating a "Realized P/L" to manage risk.
Flexible Reporting Periods: Analyze data from "All History," "This Month," "This Year," or a custom start date.
Dynamic Projection: Calculates a projected profit for the next X days based on the historical daily average performance of filtered strategies.
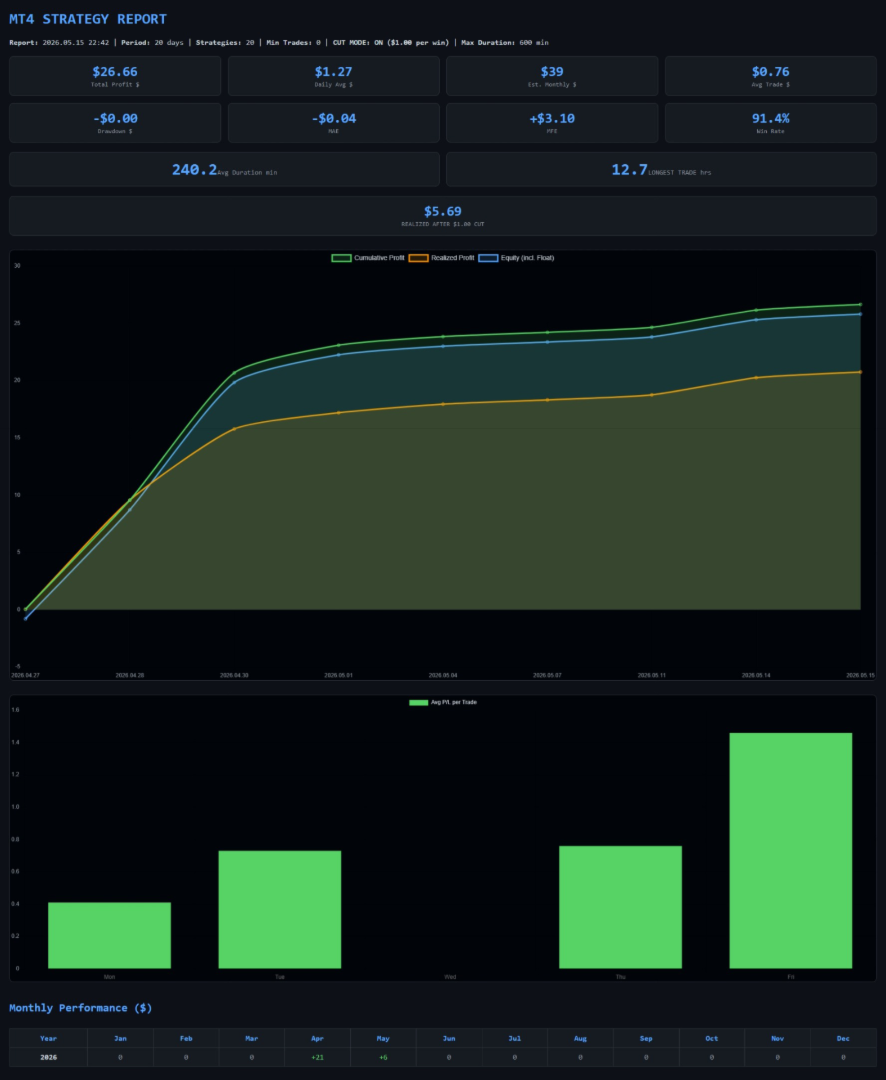
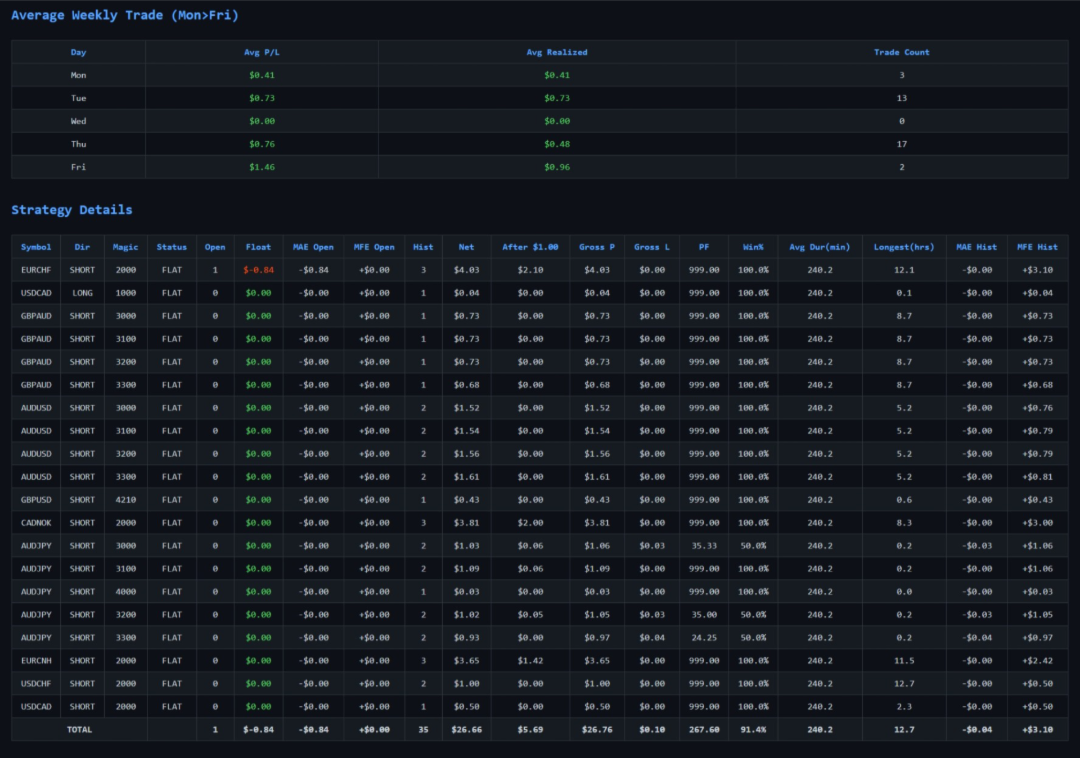
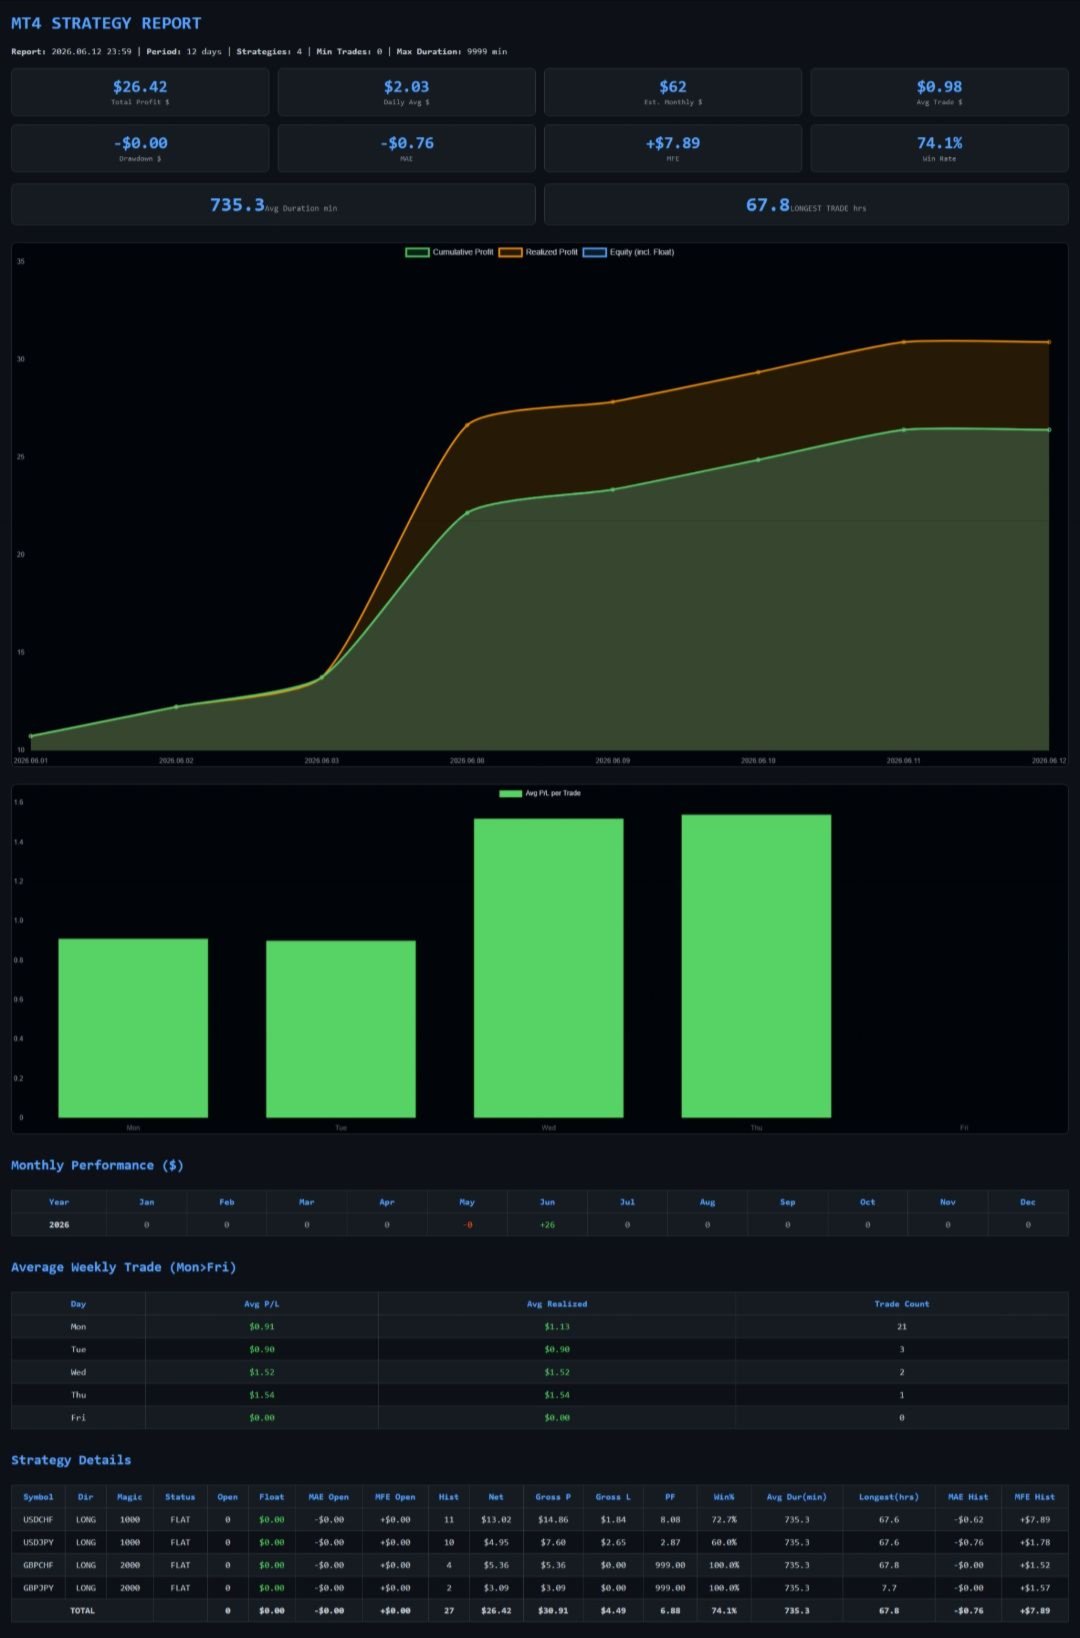
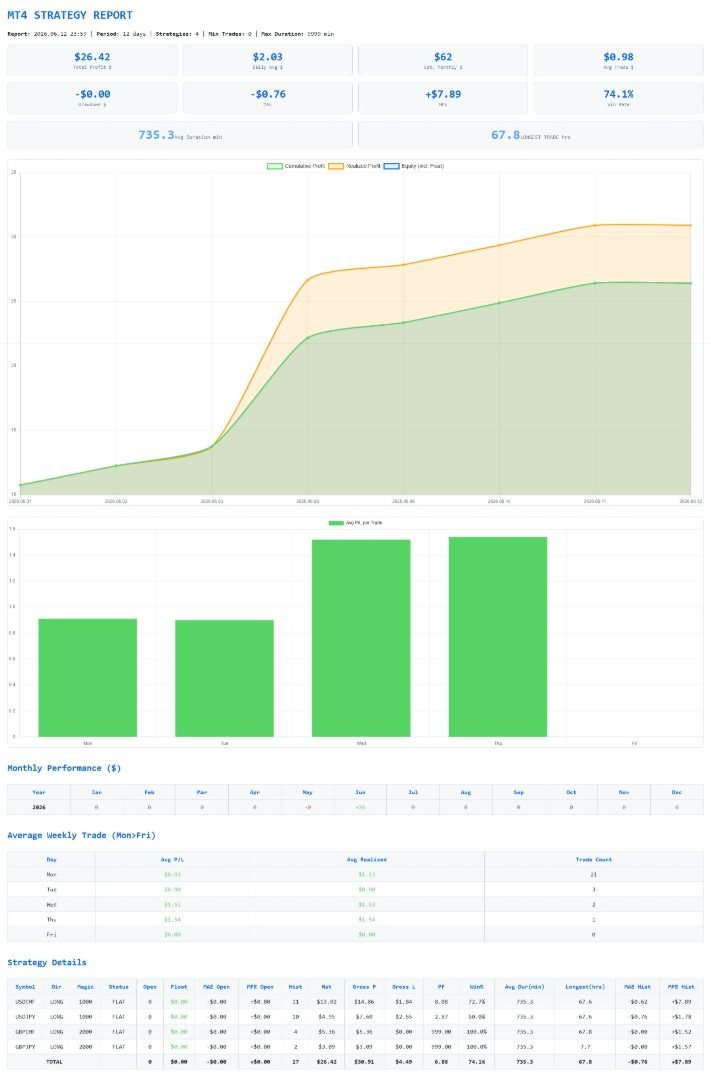
Interactive HTML Export: Generates a professional, standalone report featuring a line chart (Cumulative Profit, Realized Profit, Equity) and a bar chart for average weekly trade performance.
CSV Export: Exports filtered strategy data for external analysis in spreadsheets.

Effective Uses:
Strategy Optimization: Isolate and project the future potential of specific trading strategies (identified by Magic Numbers or Symbol+Direction) to decide which to scale.
Risk Management: Use the "Cut Mode" to backtest how a profit cap would affect overall returns, helping to set realistic take-profit levels.
Performance Review: Generate weekly or monthly HTML reports to review the most profitable entry days and times for each strategy.
System Health Check: Use filters (e.g., `MaxDrawdown_Below`, `Filter_History_MAE_Below`) to automatically exclude strategies that have recently suffered large drawdowns or adverse movement.
おすすめのプロダクト
Gold Crazy EA   is an Expert Advisor designed specifically for trading Gold H1/ EU M15. It use some indicators to find the good Entry. And you can set SL or you can DCA if you want. It can be an Scalping or an Grid/ Martingale depend yours setting. This EA can Auto lot by Balance, set risk per trade. You also can set TP/ SL for earch trade or for basket of trade. - RSI_PERIOD - if = -1, then the default strategy works, if >0, then the RSI strategy works - MAX_ORDERS - to trade with only 1 order,
Gyroscope        professional forex expert   (for EURUSD, GBPUSD, USDJPY, AUDUSD, USDCHF, EURGBP, EURJPY, NZDUSD, USDCAD, EURCHF, AUDJPY, CADJPY pairs)   alyzing the market using the Elliot Wave Index. Elliott wave theory is the interpretation of processes in financial markets through a system of visual models (waves) on price charts. The author of the theory, Ralph Elliott, identified eight variants of alternating waves (of which five are in the trend and three are against the trend). The mov
DracoAI is a revolutionary automated forex trading robot based on neural network.  Loss coverage is our premium exclusive feature. DracoAI IS: THE BEST MONEY MAKING SERVICE & STABLE PASSIVE INCOME PROFIT, EVEN IF YOU DO NOT PARTICIPATE IN BIDDING FINANCIAL INDEPENDENCE AND STABILITY DracoAI IS SAFE, BECAUSE: WE GUARANTEE THE SAFETY OF YOUR FUNDS NEGATIVE RESULTS OF TRADING ARE COVERED BY OUR RESERVE FUND 100% CONFIDENTIALITY Monitoring  - most popular signal at MQL5 :  https://www.mql5.com/en/s
FX FVG iFVG Signal MT4 は、Fair Value Gap と Inversion Fair Value Gap の考え方を使う Forex トレーダー向けの MetaTrader 4 インジケーターです。 このインジケーターは、強気 FVG、弱気 FVG、強気 iFVG、弱気 iFVG のゾーンをチャート上に自動表示します。価格が iFVG ゾーンに戻り、ローソク足の確認条件を満たした場合、BUY または SELL のポップアップ通知を表示します。 主に H1 と M30 での使用を想定しています。H1 は大きな方向確認、M30 は押し目、戻り、反応確認に適しています。 主な機能: 3本ローソク足による FVG 自動検出 FVG ブレイク後の iFVG 自動検出 強気 FVG と弱気 FVG の表示 強気 iFVG と弱気 iFVG の表示 ゾーン中央線の表示 BUY / SELL ポップアップ通知 チャート上のシグナル矢印 EA 連携用の隠しバッファ 自動売買は行いません 色の説明: 薄緑:強気 FVG、押し目でサポートになる可能性 薄赤:弱気 FVG、戻りでレ
QuantumEdge Trader v1.0 AI-Powered Precision Signals for Serious Traders QuantumEdge Trader is a smart and reliable indicator that delivers accurate BUY and SELL signals using advanced market analysis and trend detection. Designed for M1 to M60 timeframes, it's ideal for scalping and intraday strategies. --- Key Features: No Repaint – Signals never change after appearing Smart trend filters to reduce noise Adjustable sensitivity and alerts Perfect for XAUUSD, EURUSD, and m
GOAL TIME is an expert advisor based on the notion of time, it studies the change of price according to time, and it finally detects the best time to execute a good order. The EA is based on an indicator that draws a price curve in relation to time, this curve is deduced by an algorithm that analyzes old data. Then, the EA exploits the generated curve and executes the correct order. In case of incorrect choice, the EA has the mission to limit the losses. After a thorough study of this strategy o
Delta Pairs
Anatolii Zainchkovskii
Delta Pairs is an indicator for pair trading, it displays the divergence of two currency pairs. Does not redraw. A useful tool for the analysis of the behavior of two currency pairs relative to each other. Purpose The Delta Pairs indicator is designed for determining the divergences in the movements of two currency pairs. This indicator is displayed as two line charts and the difference (delta) between these charts in the form of a histogram. The Delta Pairs indicator will be useful for those w
Future Price Markets is an indicator that, through the dynamic analysis of price and time, projects profit taking prices in the future. To show the future projections of the price, it uses certain horizontal lines, of different color and style, whether it be a signal to indicate a purchase signal or a sale signal or a future signal to take purchase or sale benefits.
Ksm: Smart Solution for Automated Forex Trading Ksm is a tool designed for automating Forex trading, using modern methods of time-series data analysis to work with multiple currency pairs across different timeframes. Key Features and Benefits Multi-currency support : Ksm enables trading across multiple currency pairs, helping traders adapt their strategies to various market conditions. New currency pairs can be easily added. Time-series data analysis : Utilizing advanced algorithms, Ksm analyzes
The Th3Eng PipFinite indicator is based on a very excellent analysis of the right trend direction with perfect custom algorithms. It show the true direction and the best point to start trading. With StopLoss point and Three Take Profit points. Also it show the right pivot of the price and small points to order to replace the dynamic support and resistance channel, Which surrounds the price. And Finally it draws a very helpful Box on the left side on the chart includes (take profits and Stop loss
Candle EA MT4
Mansour Babasafary
3.68 (19)
This expert is based on patterns The main patterns of this specialist are candlestick patterns Detects trends with candlestick patterns It has a profit limit and a loss limit, so it has a low risk The best time frame to use this expert is M30 time frame The best currency pairs to use with this expert is the EURUSD, GBPUSD, AUDUSD, USDCAD currency pairs Attributes: Can be used in the EURUSD, GBPUSD, AUDUSD, USDCAD  currency pairs Can be used in M30, H1, H4 time frames Has profit limit and loss
Smart Gread Ultimate Edition (SGUL) indicator - based on smart order grid strategy. Maximum customization and flexibility of strategies are the main features of this indicator. In the right corner there is a table with the number and volume of orders. List of adjustable parameters: K: 2.0 - Factor of the next order increase (if the price moves in the other direction). TP: 50 - The number of points at which the order is closed with a profit (minimum profit per 1 lot). Step: 80 - The numb
Noize Absorption Index - is the manual trading system that measures the difference of pressure between bears forces and bulls forces. Green line - is a noize free index that showing curent situation. Zero value of index shows totally choppy/flat market.Values above zero level shows how powerfull bullish wave is and values below zero measures bearish forces.Up arrow appears on bearish market when it's ready to reverse, dn arrow appears on weak bullish market, as a result of reverse expectation. S
Here   our more valuable tools SMC Trend Trading   ,  Easy SMC Trading  ,  Institutional SMC Architect Volume Analysis Tools  ,  Volume flow Profile  ,  Market volume profile  , FVG with Volume  , Liquidity Heatmap Profile  ,  Volume Spread Analysis Trend Identification: Look for the color change. When candles turn Green , look for Buy opportunities. When they turn Red , look for Sell opportunities. Entry: Enter on the break of the trend line or on the pullback to the line. Stop Loss: Use the
TradeLogic Pro – The Advanced MT4 EA for Long Term Investing TradeLogic Pro   is an advanced   MetaTrader 4 Expert Advisor (EA)   designed to harness the power of price imbalances in the forex trading markets. Whether you’re a beginner or a professional trader,   TradeLogic Pro   uses sophisticated market analysis to identify high-potential entry points, allowing you to trade smarter and more efficiently. How Does TradeLogic Pro Work? At the core of   TradeLogic Pro   is its ability to   detect
This is a new strategy for SUPPLY DEMAND areas It is based on a calculation using the tick volume to detect the big price action in market for both bear /bull actions this smart volume action candles are used to determine the supply and demand areas prices in between main supply and demand lines indicate sideway market  up arrows will be shown when prices moves above the main supply and the secondary supply lines Down arrows will be shown when prices moves below the main demand and the secondary
Forex Gump
Andrey Kozak
2.4 (5)
Forex Gump is a fully finished semi-automatic trading system. In the form of arrows, signals are displayed on the screen for opening and closing deals. All you need is to follow the instructions of the indicator. When the indicator shows a blue arrow, you need to open a buy order. When the indicator shows a red arrow, you need to open a sell order. Close orders when the indicator draws a yellow cross. In order to get the most effective result, we recommend using the timeframes H1, H4, D1. There
もちろんです。以下は、提供いただいたテキストの日本語への翻訳です: MT4用の天文学指標をご紹介します:究極の天体トレーディングコンパニオン トレーディング体験を天空の高みに高める準備はできていますか?私たちの革命的なMT4用の天文学指標をご紹介します。この革新的なツールは、複雑なアルゴリズムの力を借りて、類まれなる天文学的洞察と精密な計算を提供します。 あなたの指先で宇宙の情報を: 宝のような天文学的データが明らかになる包括的なパネルをご覧ください。惑星の地理的/太陽中心座標、太陽と地球の距離、星の大きさ、伸び、星座、黄道座標および赤道座標、さらには水平座標まで、それぞれが綿密に計算され美しく表示されています。指標によって生成される垂直線は時間値に対応し、トレーディングの旅に宇宙の視点を提供します。 惑星のラインと関係: グラフを飾る惑星のラインの魔法を体験し、スケールと角度をカスタマイズできます。直感的なコントロールパネルを介して各惑星のラインの表示を簡単に切り替えることができます。指定された時刻範囲内での合会、六分会、四分会、三分会、対会、逆行の指標で天体の関係の芸術を発見してく
Awesome Oscillator by Bill Williams with the ability to fine-tune and replace the averaging algorithms of the indicator, which significantly expands the possibilities of using this oscillator in algorithmic trading and brings it closer in its properties to such an indicator as the MACD. To reduce price noise, the final indicator is processed with an additional Smooth averaging. The indicator has the ability to give alerts, send mail messages and push signals when the direction of movement of th
TPO Profile MT4
Kyra Nickaline Watson-gordon
5 (1)
Definition : TPO is a Time Price Opportunity. Instead of using bars or candles with an Open, High, Low, and Close price, each "bar" in a Market Profile is represented by horizontal bars against the price It is called Market Profile terminology. In other words time-price-opportunity (TPO) profiles are histograms of how much time was spent at each price within the span of the profile. By using a TPO chart, you are able to analyze the amount of trading activity, based on time, for each price level
VR Cub
Vladimir Pastushak
VR Cub は、質の高いエントリーポイントを獲得するためのインジケーターです。このインジケーターは、数学的計算を容易にし、ポジションへのエントリーポイントの検索を簡素化するために開発されました。このインジケーターが作成されたトレーディング戦略は、長年にわたってその有効性が証明されてきました。取引戦略のシンプルさはその大きな利点であり、初心者のトレーダーでもうまく取引することができます。 VR Cub はポジション開始ポイントとテイクプロフィットとストップロスのターゲットレベルを計算し、効率と使いやすさを大幅に向上させます。取引の簡単なルールを理解するには、以下の戦略を使用した取引のスクリーンショットを見てください。 設定、設定ファイル、デモ版、説明書、問題解決方法は、以下から入手できます。 [ブログ] レビューを読んだり書いたりすることができます。 [リンク] のバージョン [MetaTrader 5] エントリーポイントの計算ルール ポジションをオープンする エントリーポイントを計算するには、VR Cub ツールを最後の高値から最後の安値までストレッチする必要があります。 最初
EARLY REMINDER: The Starting price is 65 price will rise soon up to 365$ and then 750$ after first 10 copies of sales. Grab this offer now! Introduction Hello, traders! Welcome to the demonstration of the Forex Beast Indicator , a comprehensive tool designed to assist aspiring traders in navigating the complexities of the forex market. This indicator incorporates seven essential components to provide a well-rounded trading experience: Moving Averages Colored Zones Support and Resistance Levels
Money Flow Profile MT5 HERE   Here   our more valuable tools SMC Trend Trading   ,  Easy SMC Trading  ,  Institutional SMC Architect Volume Analysis Tools  ,  Volume flow Profile  ,  Market volume profile  , FVG with Volume  , Liquidity Heatmap Profile  ,  Volume Spread Analysis This Master Edition is engineered for clarity and speed, featuring a unique Auto-Theme Sync system that instantly beautifies your chart layout upon loading. Key Features: True Money Flow Calculation: Goes beyond stand
Chart Patterns Detect 15 patterns (Ascending Triangle, Descending Triangle, Rising Wedge, Falling Wedge, Bullish Flag, Bearish Flag, Bullish Rectangle, Bearish Rectangle Symmetrical triangle, Head and Shoulders, Inverted Head and Shoulders, Triple top, Triple Bottom, Double Top, Double Bottom) Use historical data to calculate the probability of each pattern to succeed (possibility to filter notification according to the chance of success) gives graphic indication about the invalidation level and
TT Arrows is a trend based indicator that very succesfully predicts the start of the new trend.  The indicator is working with all trading instruments and in M5, M15, H1 and H4 timeframes. Up arrow signals a good time to enter a bullish trade while down arrow signals a good time to enter a bearish trade. The trade should be taken when the candle that has the arrow is closed. Following this strategy you will have have a high percentage of winning trades. Enjoy!
MK_R It is based on contrary patterns for EURUSD.  Basically, it will entry using the condition of 1 buy wave and 6 sell wave of Granville's law. The EA does not use indicators, grid, martingale, arbitrage.  The EA has been proven to be profitable in the six months of 2020 and is particularly suitable for the current EURUSD market since mid-December 2020. Monitoring: https://www.mql5.com/en/signals/789229 Timeframe is M5. EA needs M1 chart,M5 chart,M15 Chart,H1 chart,H4 chart. Maxium Spread
CRT Candle Range Theory HTF MT4.   Ultimate CRT Indicator: Advanced ICT Concepts and Malaysian SnR Trading System Master the Market Maker's Footprints with the Most Advanced Candle Range Theory Indicator Unlock the true power of  Smart Money Concepts (SMC)  and trade precisely like the institutions with the  Ultimate CRT Indicator . Built exclusively for serious traders, this indicator automates the highly effective  Candle Range Theory (CRT) , a core pillar of  ICT Concepts (Inner Circle Trader
Intraday Levels shows intraday levels grid for intraday trading Shows a grid for the day levels, gives you a guide to know the trend and to measure intraday trades (stop-loss and take-profit). Parameters are: Levels Mode: Basic mode: Shows highest, lowest and middle levels. Advanced mode: Shows highest, lowest, middle and intermediate levels. Fibonacci mode: Shows session Fibonacci retracements levels. Momentum mode: Shows delayed Advanced levels to identify momentum. Smooth Period (Momentum m
Volume Profile ASA Professional Volume Profile Indicator for MetaTrader 4 Volume Profile ASA is a modern professional Volume Profile indicator designed for traders who make trading decisions based on real market activity rather than price movement alone. The indicator builds a Volume Profile directly on the chart, displaying the distribution of trading volume across price levels and helping traders quickly identify the most important market areas. Volume Profile ASA automatically calculates and
Market Maestro: Your Ideal Partner for Automated Forex Trading If you're looking for a reliable assistant for trading in the currency market, Market Maestro is exactly what you need. This modern Forex bot is built using the latest technologies and algorithms, allowing it to effectively analyze market data and make informed trading decisions in real-time. Key Features of Market Maestro 1. Multicurrency Capability for Broad Opportunities Market Maestro can work with a wide range of currency pairs,
このプロダクトを購入した人は以下も購入しています
TrendMaestro
Stefano Frisetti
4 (4)
Attention: beware of SCAMS, TRENDMAESTRO is only ditributed throught MQL5.com market place. note: this indicator is for METATRADER4, if you want the version for METATRADER5 this is the link:  https://www.mql5.com/it/market/product/108106 TRENDMAESTRO ver 2.5 TRENDMAESTRO recognizes a new TREND from the start, he never makes mistakes. The certainty of identifying a new TREND is priceless. DESCRIPTION TRENDMAESTRO identifies a new TREND in the bud, this indicator examines the volatility, volumes a
There is always a need to measure if the market is "quiet" or it is volatile. One of the possible way is to use standard deviations, but the issue is simple : We do not have some levels that could help us find out if the market is in a state of lower or higher volatility. This indicator is attempting to do that : •           values above level 0 are indicating state of higher volatility (=GREEN buffer) •           values below level 0 are indicating state of lower volatility (=RED buffer)
First time on MetaTrader, introducing IQ Star Lines - an original Vedic Astrology based indicator. "Millionaires don't use astrology, billionaires do" . - J.P. Morgan, Legendary American financier and banker. Welcome to  the new and updated  IQ Star Lines , the ultimate fusion of ancient planetary harmonic cycles and modern quantitative trading. published for the   first time on Metatrader. This is an indicator built by the developer, who has spent almost 2 decades trading while studying Vedic
Miraculous Indicator – ガン・スクエア・オブ・ナインに基づく100%非リペイントのFXおよびバイナリーツール この動画では、FXおよびバイナリーオプションのトレーダー向けに特別に開発された、非常に正確で強力な取引ツールである Miraculous Indicator を紹介しています。このインジケーターがユニークなのは、伝説的な ガン・スクエア・オブ・ナイン と ガンの振動の法則 に基づいている点で、現代の取引で利用できる最も正確な予測ツールの一つとなっています。 Miraculous Indicatorは 完全に非リペイント であり、ローソク足が確定した後にシグナルが変化したり消えたりすることはありません。つまり、見たものがそのまま利用できます。これにより、トレーダーは自信を持ってエントリーおよびエグジットを行うための信頼性と一貫性のある根拠を得ることができます。 主な特徴: ガン・スクエア・オブ・ナインとガン理論に基づいて構築 100%非リペイントのシグナルシステム すべての時間枠(M1、M5、H1、H4、日足、週足)で機能 FXおよびバイナリーオプション取引
「 Dynamic Scalper System 」インジケーターは、トレンド波の中でスキャルピング取引を行う手法のために設計されています。 主要通貨ペアと金でテスト済みで、他の取引商品との互換性があります。 トレンドに沿った短期的なポジションオープンのシグナルを提供し、追加の価格変動サポートも提供します。 インジケーターの原理 大きな矢印はトレンドの方向を決定します。 トレンド波の中では、小さな矢印の形でスキャルピングシグナルを生成するアルゴリズムが機能します。 赤い矢印は強気方向、青い矢印は弱気方向です。 トレンドの方向には敏感な価格変動ラインが描かれ、小さな矢印のシグナルと連動します。 シグナルは次のように機能します。適切なタイミングでラインが現れるとエントリーシグナルが形成され、ラインが開いている間はポジションが保持され、完了すると取引が終了します。 推奨される動作時間枠はM1~H4です。 矢印は現在のローソク足に形成され、次のローソク足が開いている場合は、前のローソク足の矢印は再描画されません。 入力パラメータ Trend Wave Period - トレンド方向
The indicator is built on a non-standard Zig Zag, it draws accumulations after which if the price leaves this zone and a test of this zone occurs, then a sound signal is given and an arrow appears - after the test candle closes.The indicator does not redraw its signals, it is very easy to use, there are only three settings 1- this is the zig zag parameter 2- this is the minimum price exit from the zone 3- this is the maximum price exit from the zone. The lower the parameter for Zig Zag, the more
No Skam
Abdulkarim Karazon
NO SKAM矢印インジケーター NO SKAM矢印インジケーターは、パフォーマンス目標に基づいてシグナル生成とTP/SLレベルを自動的に微調整する自己最適化型の取引インジケーターです。 数百ものパラメータの組み合わせを手動でテストする代わりに、指標は最適化目標に最適な設定を検索します。例えば、 最低勝率 最大連敗 最小取引回数 正純利益 これにより、トレーダーは手動最適化にかかる数時間、あるいは数日を節約できます。 この指標は、ボリューム分析と価格アクションを組み合わせ、高品質なエントリーシグナルを生成しつつ、異なる市場状況間での一貫性を維持します。 機能 >自己最適化パラメータ 最適化(TWEAK)目標に応じて信号およびTP/SL設定を自動的に調整します。 > 高確率エントリー は、信頼できる取引セットアップのためにボリュームアクションとプライスアクションの組み合わせを使用します。 > 自動TP&SLレベル すべてのシグナルには推奨される利益切入およびストップロスレベルが含まれています。 > 詳細統計パネル 以下の重要なパフォーマンス指標を追跡します: 勝率
Route Lines Prices -は、価格の方向性を予測するために設計されたインジケーターです。シンプルなインターフェースには、価格変動と将来の方向性を計算するための複数のアルゴリズムが搭載されています。これらのアルゴリズムには、使用する時間枠に基づいたボラティリティ計算と価格平滑化が含まれています。 このインジケーターには、「 Calculating price values 」値を変更するためのパラメーターが1つだけあります。デフォルト値の1は、バランスの取れた自動計算を提供し、インジケーターを手動で設定することなく使用できます。 値を2から500まで手動で変更することで、インジケーターを独自のトレーディングシステムに合わせてカスタマイズできます。 このインジケーターは、M1からH4の時間枠での使用を推奨します。あらゆる取引銘柄で使用できます。 シグナル矢印はローソク足の終値で生成され、過去の履歴には再描画されません。 メインチャートには、重複した矢印が表示されます。 複数のアラートタイプが利用可能です。内蔵のライン軌跡カウンターは、終値に基づいて動作します。これ
Trend Breakout Arrows Indicator The Trend Breakout Arrows Indicator is a momentum-based signal tool designed to identify potential bullish and bearish breakout opportunities. It displays clear arrow signals directly on the price chart, helping traders quickly recognize possible trend changes and continuation setups. Up Arrow (Buy Signal) A magenta up arrow appears below a candle when bullish momentum begins to strengthen. This signal indicates that buying pressure may be overtaking selling press
Binary Booster
Yaroslav Varankin
5 (1)
Binary Options Trading Indicator: A Reliable Tool for Your Trades This indicator is specifically designed for binary options trading and has proven its high quality, reliability, and adequate accuracy, depending on the dynamics of the chart. Key Points: Signal Interpretation: When a blue cross signal appears, it indicates a potential entry into a trade, though it is considered a weak signal on its own. However, if the blue cross is accompanied by an arrow, it is considered a more reliable buy s
TRADING STRATEGY GUIDE DELIVERY The full Trading Strategy Guide will be sent directly to you after purchase. Just message me on MQL5 and ask for it — you'll receive it instantly, along with priority support and setup help. Powered Market Scanner for Smart Trading Decisions Keypad Support & Resistance is a next-generation MT4 trading system built for serious traders who demand precision, reliability, and clarity. It combines advanced smart filters with real-time price structure logic to genera
一款信号统计指标(MT4)——实现基于当前图表周期下的单线MA转向和双线MA金叉/死叉统计 . 转向定义:前一K向下或走平,当前K向上,视为转向向上;反之,转向向下。 金死叉定义:前一K快线在慢线下方,当前K快线在慢线上方,为金叉;反之,死叉。 参数及使用说明: 1、可指定统计K线数。 2、可指定4个不同的日内时间段,格式如"03:00-07:59",4个时间段可交叉任意输入。 3、可配置ABC三个浮盈区间段点值。如:分界区间统计小点值设为500,即当某转向信 号出现后到下一反向信号止浮盈<=此点值,计入A区间; 若大于此点值<大分界点值时,计入B区间;若大于“大分界点值”计入C区间。 4、最大/最小浮盈统计。显示所有统计区间内的最大浮盈点值和最小浮盈点值(亏损点值)。 5、输出完整信号,按信号出现顺序排列,如“ACCBCA”之类。 6、综合预测。使用概率、周期、趋势、马尔可夫链等综合概算输出预测该信号出现的归类概率值。 7、加载指定MA线。在当前图表自动载入相应设置的MA线。 8、自适应列宽。以完整显示统计信号数。 9、用法:点击相应统计按钮即输出相应的统计表格.
SYSTEM INTRODUCTION:   The Binary Options Channels System Is Specifically Designed For Binary Options Trading. Unlike Other Systems And Indicators That Were Adopted From Other Trading Environments For Binary Options. Little Wonder Why Many Of Such Systems Fail To Make Money . Many End Up Loosing Money For Their Users.  A Very Important Fact That Must Be Noted Is The Fact That Application Of Martingale Is not Required. Thus Making It Safer For Traders Usage And Profitability. A Trader Can Use Fi
Fxland Price Reversal Zones (MT4) FXLAND Smart Reversal Indicator is a professional technical analysis tool designed to help traders identify potential price reversal zones and key market turning points with clarity and precision. The best reversal indicator and price return by choosing only one ceiling or floor in each time frame A masterpiece of combining mathematics and Gann, fractal matrix, Fibonacci, movement angle and time. Completely intelligent Key Features Detects potential pr
VTrende Pro MT4 - MTF indicator for trend trading with a display panel for MT5 *** Videos can be translated into any language using subtitles (video language - Russian) Although the signals of the VTrende Pro indicator can be used as signals of a full-fledged trading system, it is recommended to use them in conjunction with the Bill Williams TS. VTrende Pro  MT4 is an extended version of the VTrende indicator. Difference between Pro version and VTrende: - Time zones - Signal V - signal 1-2 wave
A scalping indicator based on mathematical patterns, which on average gives signals with relatively small SL, and also occasionally helps to catch big moves in the markets (more information in the video) This indicator has three main types of notifications: The first type warns of a possible/upcoming signal on the next bar The second type indicates the presence of a ready signal to enter the market/open a position The third type is for SL and TP levels - you will be notified every time price re
FFx Engulfing Setup Alerter gives trade suggestions with Entry, Target 1, Target 2 and StopLoss. Below are the different options available: Entry suggestion - pips to be added over the break for the entry 3 different options to calculate the SL - by pips, by ATR multiplier or at the pattern High/Low 3 different options to calculate the 2 TPs - by pips, by ATR multiplier or at Risk/Reward Offset the dashboard - any place on the chart Remove the suggestion once the price reached the SL line Lines
FFx InsideBar Setup Alerter gives trade suggestions with Entry, Target 1, Target 2 and StopLoss. Below are the different options available: Entry suggestion - pips to be added over the break for the entry Minimum candle size - to avoid too close buy/sell entry suggestions 3 different options to calculate the SL - by pips, by ATR multiplier or at the pattern High/Low 3 different options to calculate the 2 TPs - by pips, by ATR multiplier or at Risk/Reward Offset the dashboard - any place on the c
FFx OutsideBar Setup Alerter gives trade suggestions with Entry, Target 1, Target 2 and StopLoss. Below are the different options available: Entry suggestion - pips to be added over the break for the entry. 3 different options to calculate the SL - by pips, by ATR multiplier or at the pattern High/Low. 3 different options to calculate the 2 TPs - by pips, by ATR multiplier or at Risk/Reward. Offset the dashboard - any place on the chart. Remove the suggestion once the price reached the SL line.
FFx PinBar Setup Alerter gives trade suggestions with Entry, Target 1, Target 2 and StopLoss. Below are the different options available: Entry suggestion - pips to be added over the break for the entry Minimum candle size - to avoid too small candles 3 different options to calculate the SL - by pips, by ATR multiplier or at the pattern High/Low 3 different options to calculate the 2 TPs - by pips, by ATR multiplier or at Risk/Reward Offset the dashboard - any place on the chart Remove the sugges
Automatic, live & interactive picture of all trendlines. Assign push, email and sound alerts to the lines of your choice and be informed about price rollback, breakout, rollback after breakout, number of rollbacks, line expiration by double breakout. Correct, drag or delete the lines and interactively tune the line system. https://youtu.be/EJUo9pYiHFA . Chart examples https: //www.mql5.com/en/users/efficientforex Price Interaction Events All events are effective immediately and only after one
Stochastic Oscillator is one of the most popular and accurate oscillators widely used by traders to capture overbought and oversold areas of price action. Although the Stochastic indicator works fine for an interval of the market, it fails to generate profitable signals when the market conditions change, and hence it produces wrong signals resulting in big losses. Have you ever thought about an adaptive Stochastic indicator that adapts its period of calculation based on the market conditions? Th
The purpose of this new version of the MT4 standard indicator provided in your platform is to display in a sub-window multiple timeframes of the same indicator with its divergences. See the example shown in the picture below. But the display isn't like a simple MTF indicator. This is the real display of the indicator on its timeframe. Here's the options available in the FFx divergences indicator: Select the timeframes to be displayed (M1 to Monthly) Define the width (number of bars) for each tim
The purpose of this new version of the MT4 standard indicator provided in your platform is to display in a sub-window multiple timeframes of the same indicator with its divergences. See the example shown in the picture below. But the display isn't like a simple MTF indicator. This is the real display of the indicator on its timeframe. Here's the options available in the FFx divergences indicator: Select the timeframes to be displayed (M1 to Monthly). Define the width (number of bars) for each ti
The FFx Dashboard MTF alerter will show you on a single chart all the timeframes (M1 to Monthly) with their own status for the indicator. 2 Alert Options: Single timeframe: each selected timeframe alert separately when a signal occurs Multi timeframes: all selected timeframes must agree for an alert to be triggered Both options have an input to select the timeframes to be used for the alert(s). How to Understand the Status: Green/Red square: histogram above/below 0 line Green square + Red bord
The FFx Dashboard MTF alerter will show you on a single chart all the timeframes (M1 to Monthly) with their own status for the indicator. 2 Alert Options: Single timeframe: each selected timeframe alert separately when a signal occurs Multi timeframes: all selected timeframes must agree for an alert to be triggered Both options have an input to select the timeframes to be used for the alert(s). How to understand the status: Green/Red square: RSI above/below 50 line Green square + Red border: R
The FFx Dashboard MTF alerter will show you on a single chart all the timeframes (M1 to Monthly) with their own status for the indicator. 2 Alert Options: Single timeframe: each selected timeframe alert separately when a signal occurs Multi timeframes: all selected timeframes must agree for an alert to be triggered Both options have an input to select the timeframes to be used for the alert(s). How to understand the status: Green/Red square: Stoch above/below 50 line Green square + Red border:
作者のその他のプロダクト
Description: An advanced equity protection and trade management script. It monitors individual trade P&L and closes positions when floating equity targets (profit or loss) are met. It features "skip closing hours" for high volatility, wide spreads, or price instability   times . Features: Closes trades at a target profit (`MAX_FLOATING_EQUITY`) or maximum loss (`MAX_FLOATING_LOSS`). Includes a `FORCE_CLOSE_AT_MAX_EQUITY` level that bypasses all exit protection checks. "SKIP_CLOSING_HOURS" inpu
FREE
An advanced equity protection and trade management script. It monitors individual trade P&L and closes positions when floating equity targets (profit or loss) are met. It features "skip closing hours" for high volatility, wide spreads, or price instability times . Features: Closes trades at a target profit (`MAX_FLOATING_EQUITY`) or maximum loss (`MAX_FLOATING_LOSS`). Includes a `FORCE_CLOSE_AT_MAX_EQUITY` level that bypasses all exit protection checks. "SKIP_CLOSING_HOURS" input to pause loss
FREE
Close Time
Frank William Jr Colbert
A simple, time-based execution utility that closes all open trades at a specific hour and minute each day. It operates continuously, checking every tick for the designated closing time. Features: Inputs for `CloseHour` (0-23) and `CloseMinute` (0-59). Independent controls for closing Buy and Sell orders. Once the current time equals or exceeds the set time, all eligible orders are closed. Effective Uses: Daily Cut-off: Automatically close all intraday trades at the end of your trading session
FREE
Close at Friday
Frank William Jr Colbert
A position management utility designed to automatically close all trades and stop further trading on Friday evenings before the market closes for the weekend. This helps traders avoid weekend gap risk. Features: Activates on Friday based on the broker’s server time. User-definable exit time (e.g., 22:00). Can close Buy orders only, Sell orders only, or both. Includes a flag (`tradingStopped`) to prevent new trades after the Friday exit is triggered. Effective Uses: Weekend Gap Protection: Clo
FREE
Have patterns that drive your trading success or failure. The Equity Performance Analyzer breaks down your trade history by symbol, day of the week, and hour of entry to identify exactly when your strategies perform best and worst. It ranks every possible trading pattern (e.g., "EURUSD-BUY-Mon-14") by Net Profit, Win Rate, Return/Drawdown, and a Monte Carlo Proxy. More than just an analytics tool, it generates ready-to-use input parameters for your EAs and a crucial "Worst Patterns to Avoid" se
Ensure your trading strategy's future performance by trading only on stable, reliable pairs. The Pair Stability Indicator analyzes the velocity and volatility of any symbol to determine if it can support consistent strategy execution. It calculates critical metrics like Pips per Second, Dollars per Pip, and Dollars per Second of movement, scoring each pair from 0-100%. By identifying highly stable instruments (e.g., EURUSD) and flagging unstable ones (e.g., XAGAUD), this indicator acts as a cru
Turn market pullbacks into profitable recovery trades with the PullBack Velocity Indicator. This tool identifies when a currency pair is in a pullback phase and calculates its velocity to project potential recovery profits. By analyzing the depth and duration of a pullback against the pair's current momentum, the indicator provides a clear "Expected Profit" in pips and dollars, along with an estimated recovery time. It actively alerts you to "HIGH POTENTIAL RECOVERY" scenarios, giving you a qua
Speed Trade Master filters your trade history and open positions to find only the fastest, most efficient trades—winners that hit profit targets quickly and losers that are cut short with minimal drawdown. By applying strict filters for Max MAE ($ and time) and Max MFE (time), it isolates "Lightning Trades." The tool then projects future performance and analyzes weekly patterns, providing a free, essential dashboard for any trader looking to optimize for speed and efficiency. Key Features: Tri
Day Trade Close
Frank William Jr Colbert
An advanced profit-taking EA that closes only *profitable* trades at the end of the day (Monday-Friday) and on Friday, while allowing losing trades to continue running or be handled by other logic. Features: Closes profitable trades at a user-defined "ProfitCloseTime". Separate profit thresholds for regular weekdays (`PROFIT_CLOSE_MG`) and Fridays (`PROFIT_CLOSE_FD`). Includes the full "ExitOnFriday" logic to close *all* trades after a specific Friday time. Can filter by Magic Number, only clo
A time-based position expiration system that moves trades to a "watch list" after they reach a certain age. It does not close them immediately but waits for them to hit a profit target (or loss target) before exiting. Features: Global and Magic-specific expiration periods (format: HH:MM:SS). Tracks expired trades separately and only closes them when a `MIN_PROFIT_CLOSE` target is met (or loss target if "Close Only Profitable" is false). Includes a manual control and statistics reporting functi
Trading tool combining a sophisticated equity stop-loss, dynamic take-profit management (Breakeven & Trailing), and symbol-group-based closing logic. It is a complete risk management and trade supervision tool. Features: All features of `Equity Master Stop v1` (floating profit/loss limits, exit protection, skip hours). Take-Profit Override: Can force a TP on any order to lock in a `MAX_FLOATING_PROFIT`. Step Breakeven: Locks in increasing amounts of profit as a trade moves favorably (e.g., aft
Open Trade EA
Frank William Jr Colbert
A basic entry and position management EA that opens trades on multiple currency pairs at specific times. It includes its own internal trailing stop and take-profit logic, as well as integrated "end-of-day" and "Friday" profit-close features from the other scripts. Features: Opens trades on user-defined `PairsSet1` through `Set6` at specific `TradeTime` inputs. Configurable position sizing (`Lots`), Stop Loss, and Take Profit. Includes its own `TrailOrders` function that trails both SL and TP b
Open Round Level
Frank William Jr Colbert
A Expert Advisor that automatically opens trades when price crosses predefined pip-based round levels. Unlike simple round number EAs that only trade on psychological levels like 1.1000 or 1.2000, this EA allows you to define up to five independent pip intervals simultaneously, each with its own Magic Number for separate tracking and management. The EA functions as a complete trading system, combining automated entry based on price crossing round levels, directional control, integrated trailin

Echo Simulator Trader is a powerful hybrid simulation-to-live EA that runs thousands of pure price-action simulated trades in parallel with your live account. It opens simulated LONG and SHORT positions at regular intervals on multiple pairs, meticulously tracks their performance using your exact risk rules, and only activates real trading once simulated strategies pass your custom performance filters (Net Profit, Profit Factor, Win Rate, Drawdown, etc.). Built for complete control and proof-of
Echo Simulator Trader v2 expands the simulation engine of v1 hybrid simulation-to-live EA that runs thousands of pure price-actions simulated trades in parallel with specified day and time. It opens simulated LONG and SHORT positions at regular intervals on multiple pairs, meticulously tracks their performance using your exact risk rules, and only activates real trading once simulated strategies pass your custom performance filters (Net Profit, Profit Factor, Win Rate, Drawdown, etc.). Built fo
Echo Simulator Trader v3 expands the simulation engine of v2 with 5 independent Property Sets (P1–P5). Each set can run on its own timeframe, magic number, position limits, and pip-interval grid logic — allowing you to test and run completely different strategies simultaneously within one EA. Simulated trades feed into a unified performance analyzer that decides which strategies graduate to real trading. With enhanced multi-magic support, pip-based round-level entries (mean reversion or breakou
Project profits with precision. Equity Master Projection is a comprehensive trade management and analytics dashboard that goes beyond simple equity tracking. It analyzes both open positions and historical trades across multiple symbols and magic numbers, applying powerful filters to isolate your best-performing strategies. With unique features like a "Cut Mode" for profit capping and dynamic HTML/CSV reporting with equity curve charts, this tool transforms raw trading data into a clear, actiona
A time-based position expiration system that moves trades to a "watch list" after they reach a certain age. It does not close them immediately but waits for them to hit a profit target (or loss target) before exiting. Features: Global and Magic-specific expiration periods (format: HH:MM:SS). Tracks expired trades separately and only closes them when a `MIN_PROFIT_CLOSE` target is met (or loss target if "Close Only Profitable" is false). Includes a manual control and statistics reporting functi
Trading tool combining a sophisticated equity stop-loss, dynamic take-profit management (Breakeven & Trailing), and symbol-group-based closing logic. It is a complete risk management and trade supervision tool. Features: All features of `Equity Master Stop v1` (floating profit/loss limits, exit protection, skip hours). Take-Profit Override: Can force a TP on any order to lock in a `MAX_FLOATING_PROFIT`. Step Breakeven: Locks in increasing amounts of profit as a trade moves favorably (e.g., aft
Open Trade MT5
Frank William Jr Colbert
A basic entry and position management EA that opens trades on multiple currency pairs at specific times. It includes its own internal trailing stop and take-profit logic, as well as integrated "end-of-day" and "Friday" profit-close features from the other scripts. Features: Opens trades on user-defined `PairsSet1` through `Set6` at specific `TradeTime` inputs. Configurable position sizing (`Lots`), Stop Loss, and Take Profit. Includes its own `TrailOrders` function that trails both SL and TP b
Have patterns that drive your trading success or failure in MT5. The Equity Performance Analyzer breaks down your trade history by symbol, day of the week, and hour of entry to identify exactly when your strategies perform best and worst. It ranks every possible trading pattern (e.g., "EURUSD-BUY-Mon-14") by Net Profit, Win Rate, Return/Drawdown, and a Monte Carlo Proxy. More than just an analytics tool, it generates ready-to-use input parameters for your EAs and a crucial "Worst Patterns to Av
A Expert Advisor that automatically opens trades when price crosses predefined pip-based round levels. Unlike simple round number EAs that only trade on psychological levels like 1.1000 or 1.2000, this EA allows you to define up to five independent pip intervals simultaneously, each with its own Magic Number for separate tracking and management. The EA functions as a complete trading system, combining automated entry based on price crossing round levels, directional control, integrated trailin

Echo Simulator Trader is a powerful hybrid simulation-to-live EA that runs thousands of pure price-action simulated trades in parallel with your live account. It opens simulated LONG and SHORT positions at regular intervals on multiple pairs, meticulously tracks their performance using your exact risk rules, and only activates real trading once simulated strategies pass your custom performance filters (Net Profit, Profit Factor, Win Rate, Drawdown, etc.). Built for complete control and proof-of

Echo Simulator Trader v2 expands the simulation engine of v1 hybrid simulation-to-live EA that runs thousands of pure price-actions simulated trades in parallel with specified day and time. It opens simulated LONG and SHORT positions at regular intervals on multiple pairs, meticulously tracks their performance using your exact risk rules, and only activates real trading once simulated strategies pass your custom performance filters (Net Profit, Profit Factor, Win Rate, Drawdown, etc.). Built fo
Echo Simulator Trader v3 expands the simulation engine of v2 with 5 independent Property Sets (P1–P5). Each set can run on its own timeframe, magic number, position limits, and pip-interval grid logic — allowing you to test and run completely different strategies simultaneously within one EA. Simulated trades feed into a unified performance analyzer that decides which strategies graduate to real trading. With enhanced multi-magic support, pip-based round-level entries (mean reversion or breakou
フィルタ:
レビューなし
レビューに返信