Pitchfork Precise
- インディケータ
-
Part-time Day Trader
 I build MT4 and MT5 tools that help traders trade with more structure, discipline, and consistency.
 - バージョン: 3.0
- アクティベーション: 8
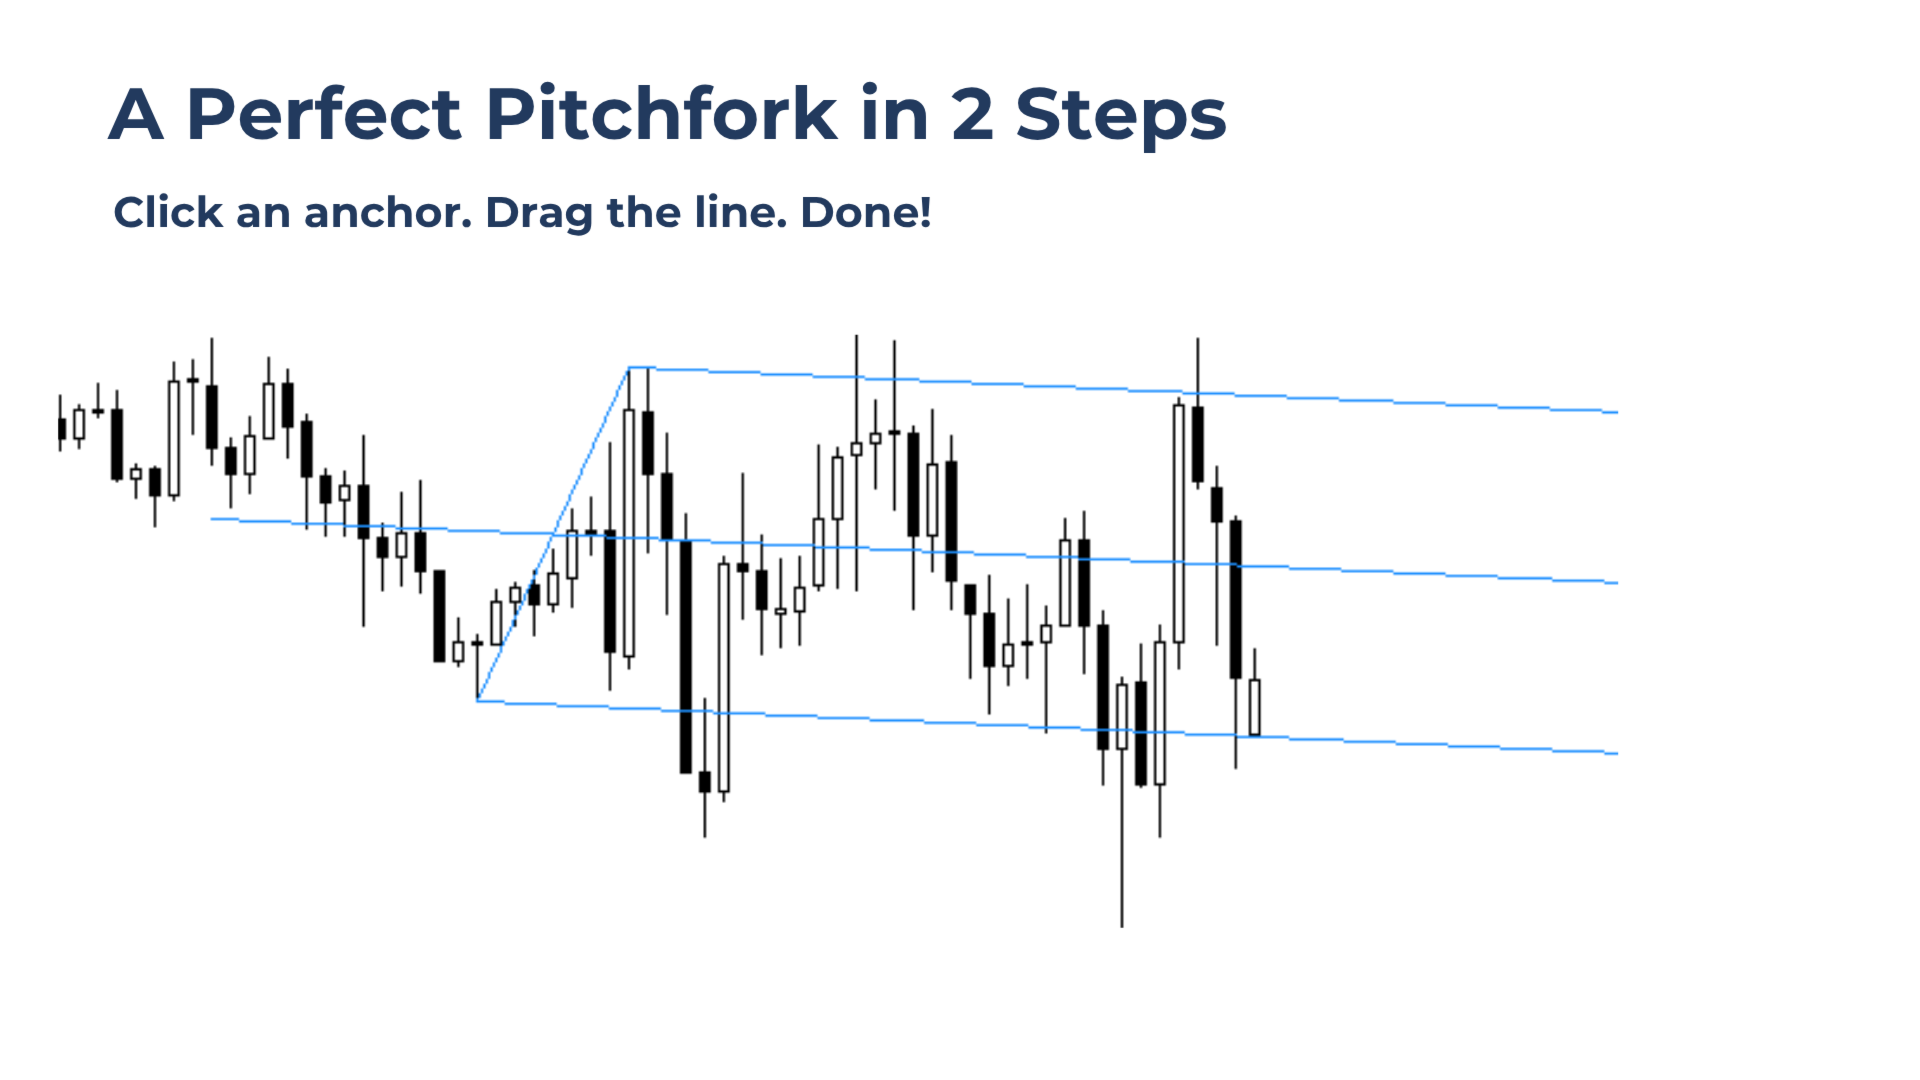
Construct precise wick-to-wick pitchfork structures in seconds with Pitchfork Precise.
Simply place the start anchor, P0, with one click. Then drag the vertical line just to the right of the third anchor swing, P2. Done.
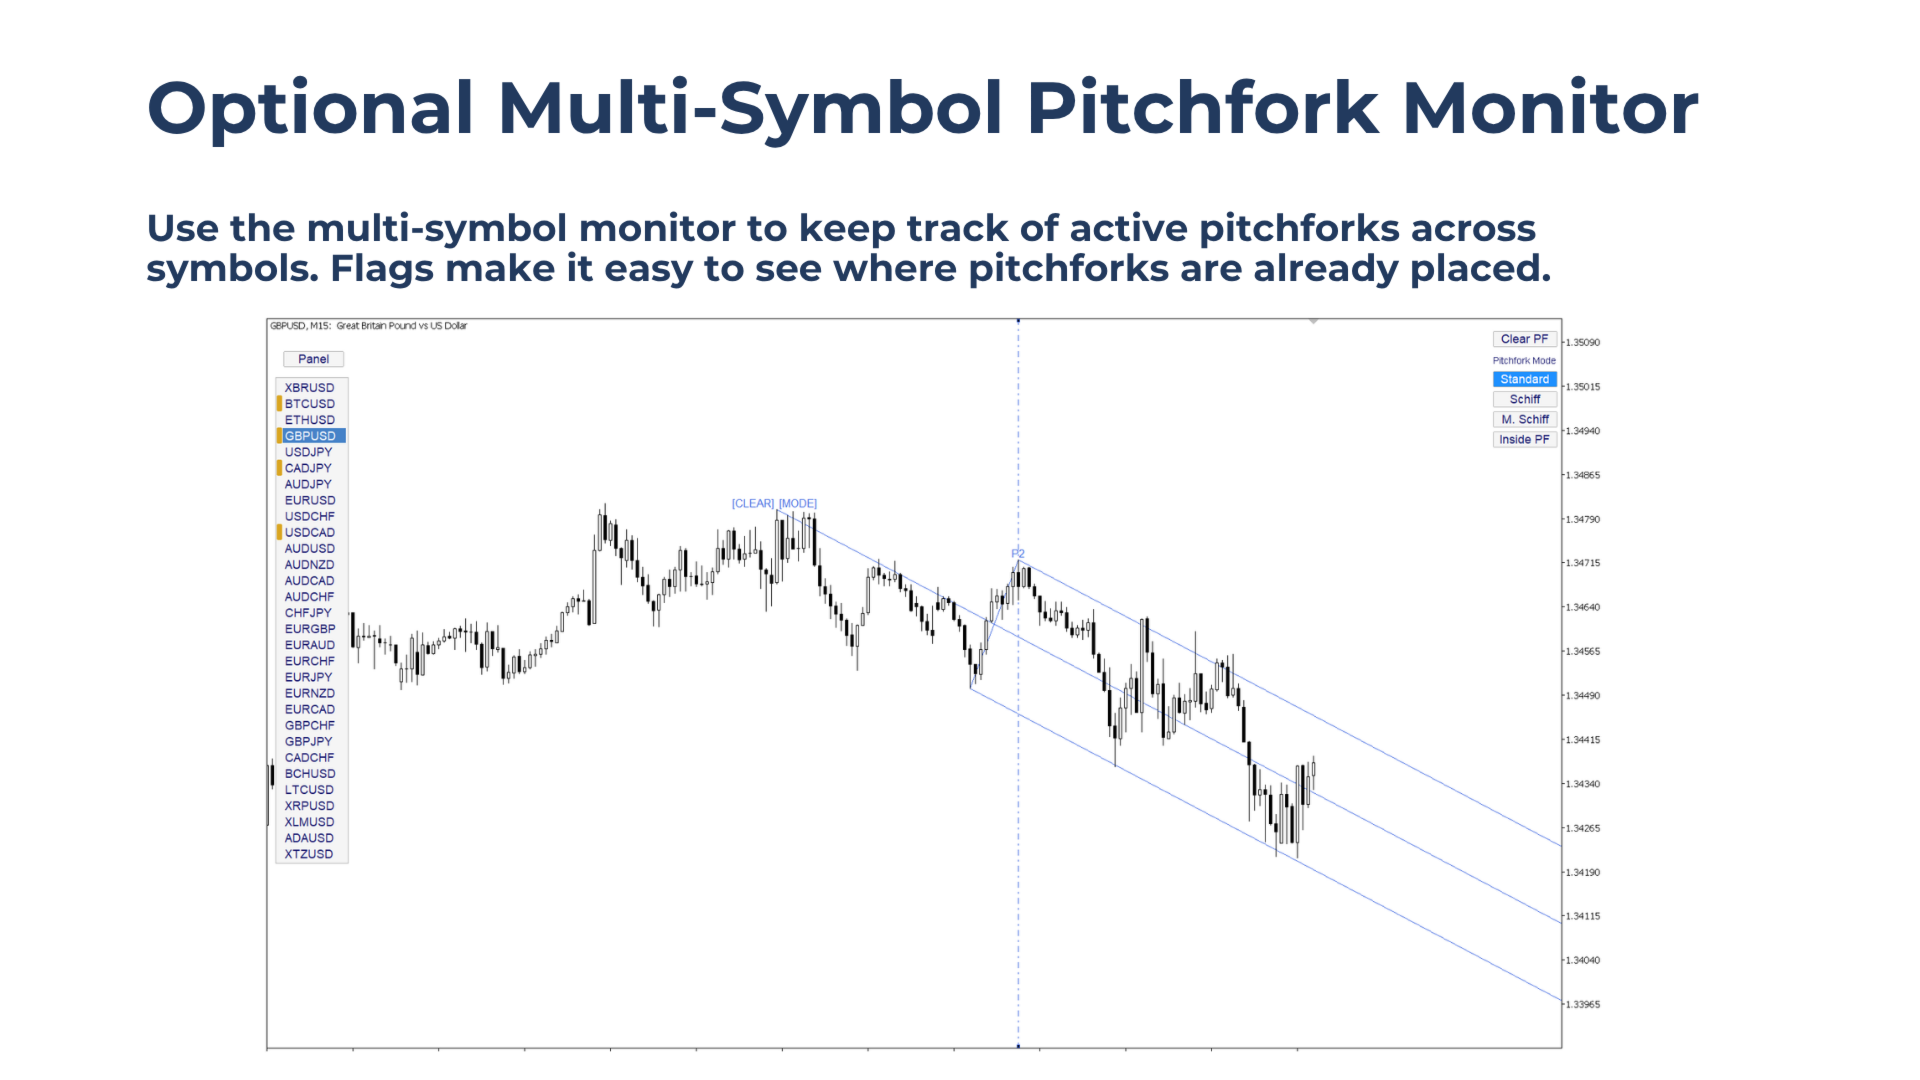
Pitchforks stay locked across timeframe changes and remain saved when switching symbols. The optional symbol monitor flags symbols with active pitchforks in memory, making them easy to revisit.
The reason for this tool is simple: precision matters when working with pitchforks. But manually placing the standard MetaTrader pitchfork exactly on three wick anchors takes time, especially when done frequently or across multiple symbols.
Pitchfork Precise removes that friction and lets traders quickly switch between Andrews, Schiff, Modified Schiff, and Inside Pitchfork variations.
Who this tool is for:
- Pitchfork traders who care about accurate wick-to-wick placement.
- Traders who want faster and more precise pitchfork placement than the standard MetaTrader tool.
- Traders who use pitchfork variations and want the same precision across different modes.
- Multi-symbol traders who want pitchfork structures to stay intact while scrolling between symbols.
- Place fast, precise pitchfork structures using authentic pitchfork rules.
- Keeps pitchforks locked when changing timeframes.
- Saves pitchfork structures per symbol, allowing traders to keep different pitchforks for multiple symbols on the same chart.
- Switch instantly between Andrews (= Standard) , Schiff, Modified Schiff, and Inside Pitchfork modes.
Main features
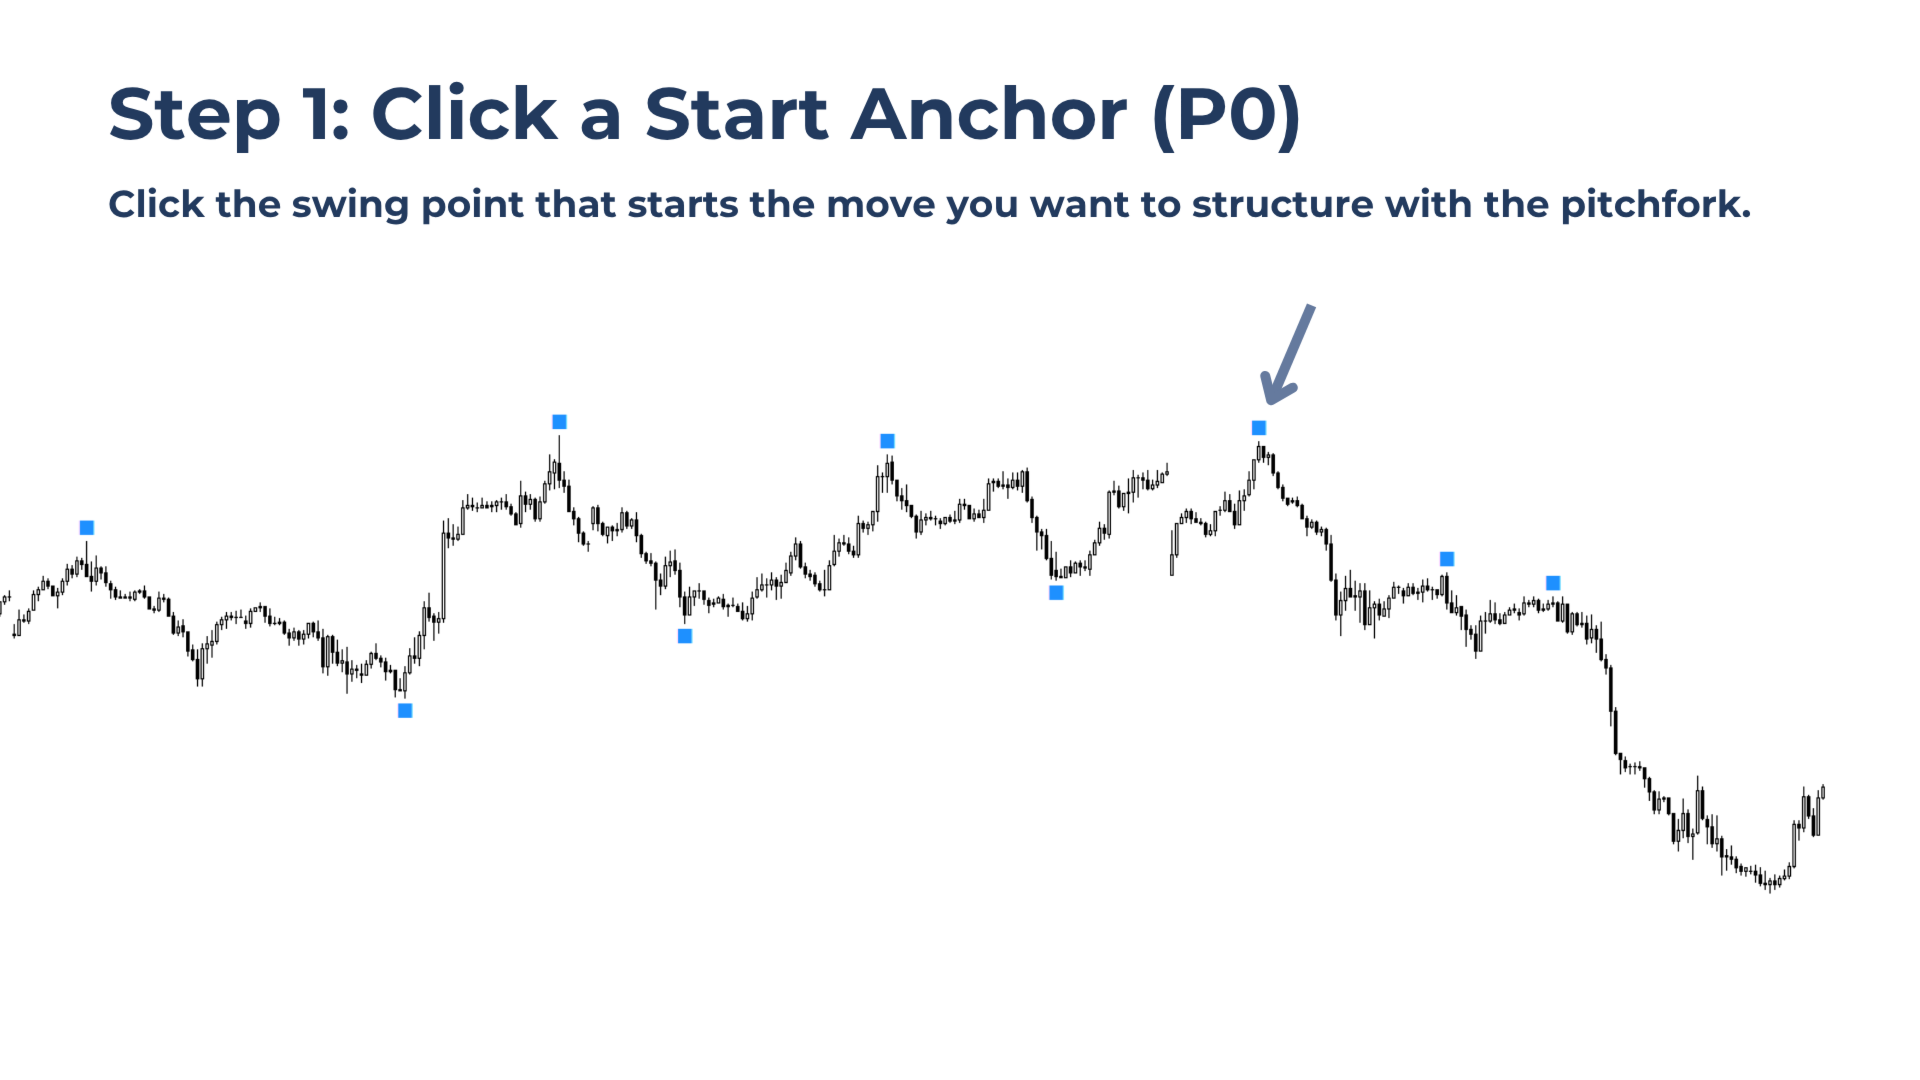
On-Chart Anchors for Easy Start Selection
Pitchfork Precise displays clickable anchors on significant swing points, making it easy to select the starting anchor of the pitchfork.
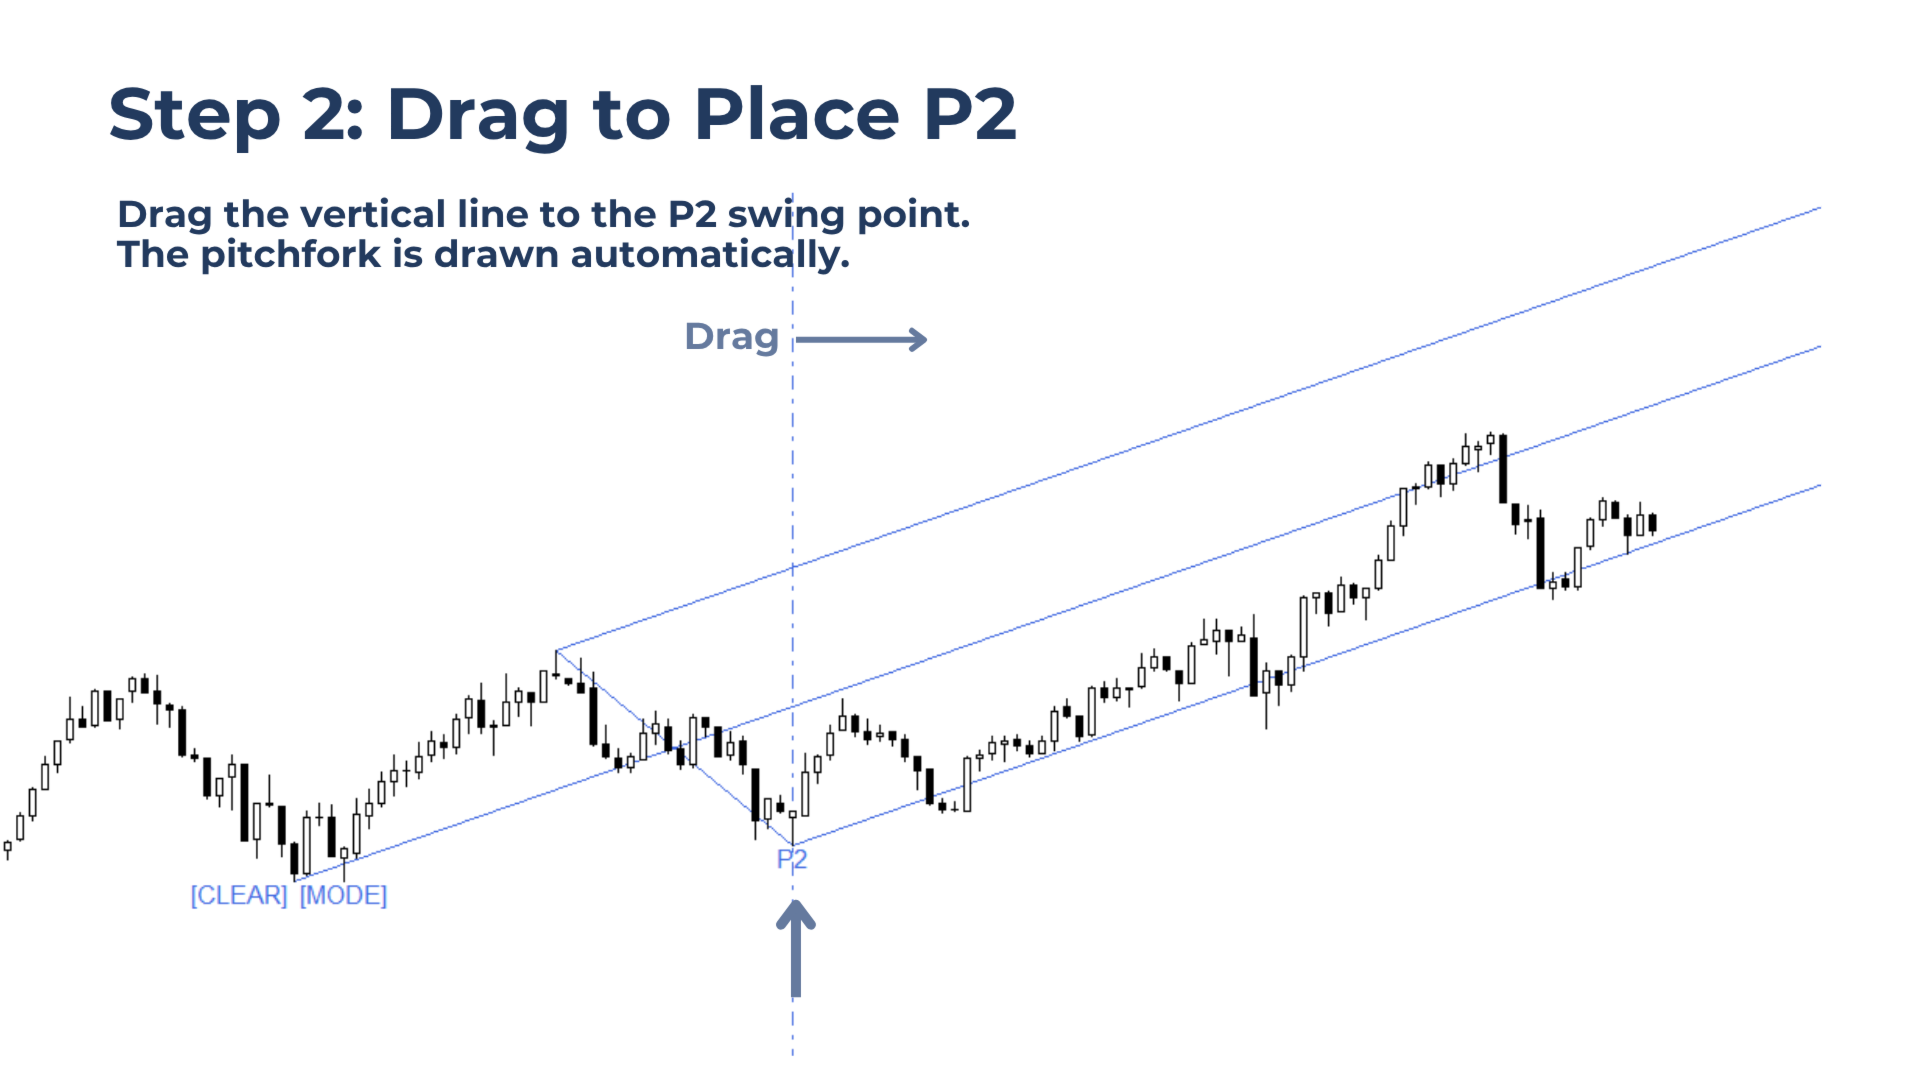
Drag Line for Fast P1 and P2 Placement
After selecting P0, drag the vertical line just to the right of the desired P2 swing. The tool calculates the matching P1 automatically, so the pitchfork can be placed faster while still following the correct anchor structure.
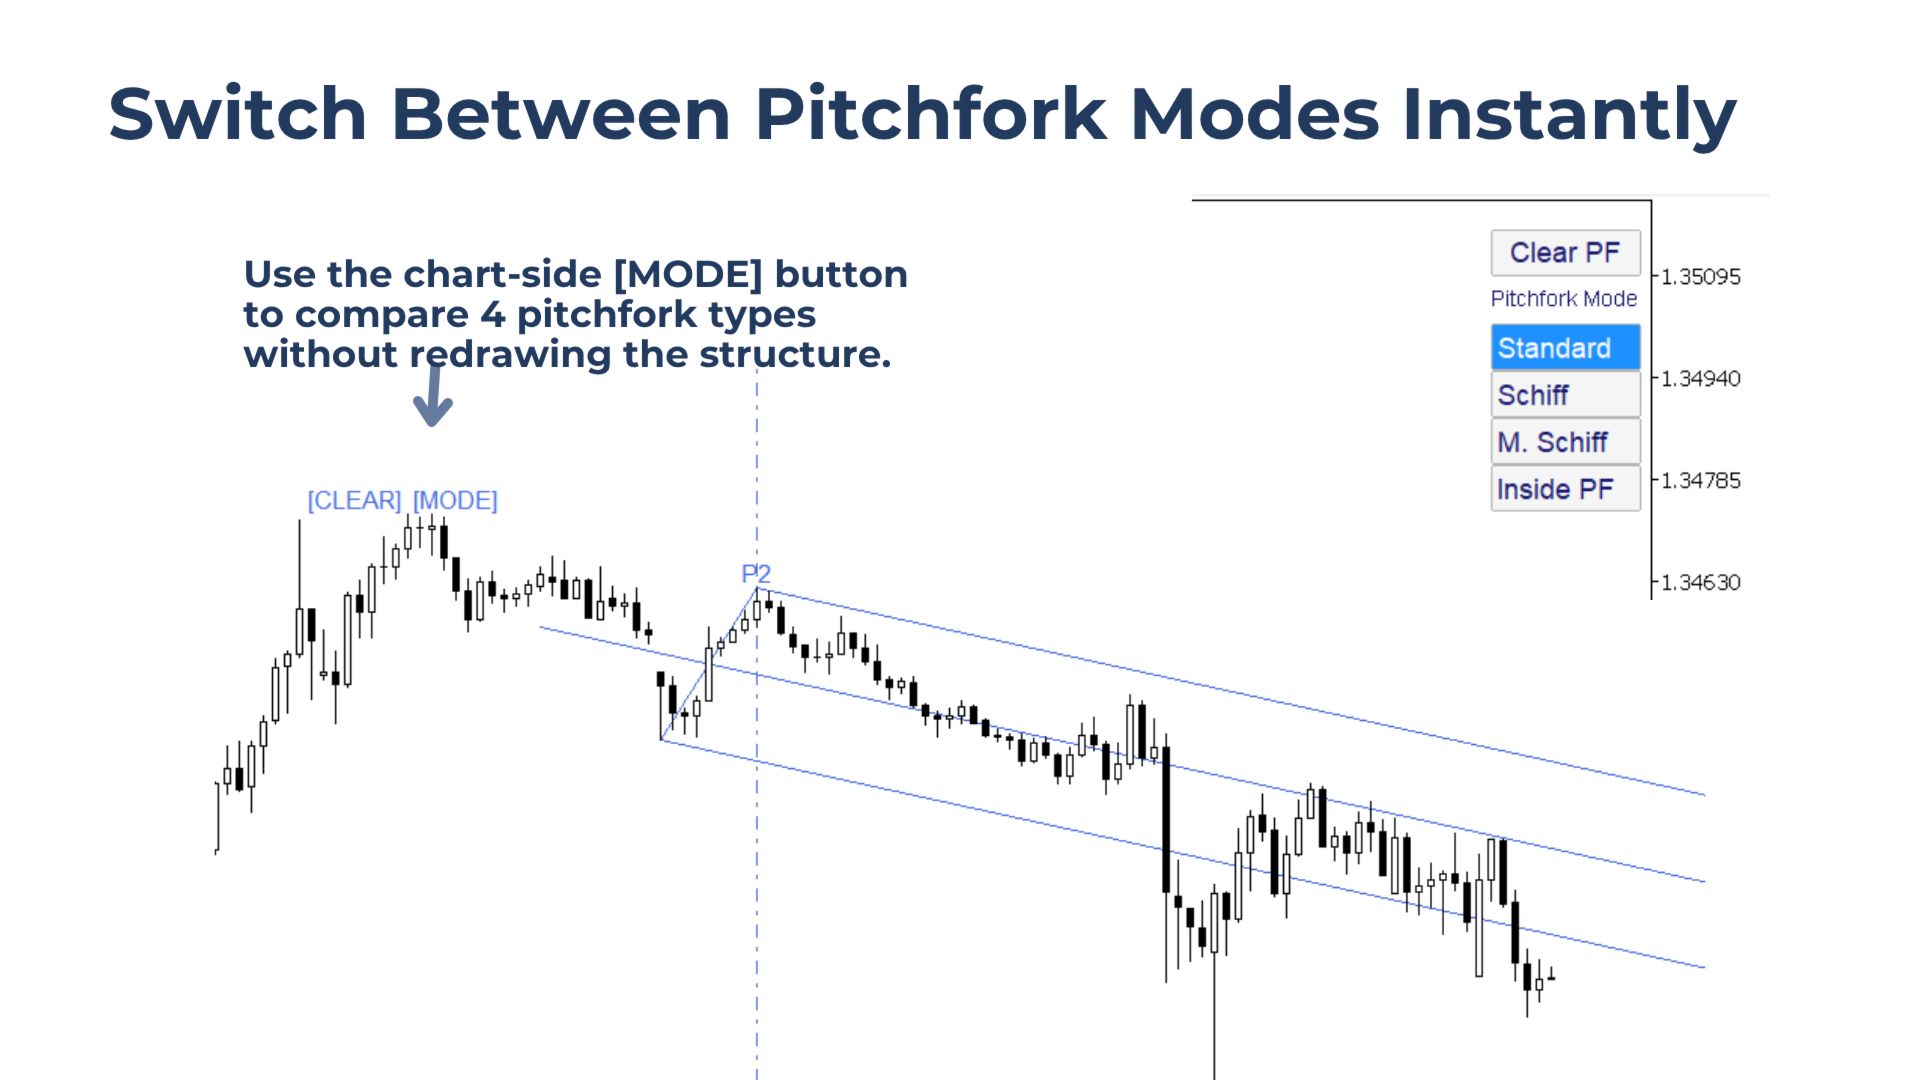
Switch Pitchfork Mode Using the Corner Panel
Use the compact corner panel to switch between:
- Standard
- Schiff
- Modified Schiff
- Inside Pitchfork
Multi-Timeframe Use
Pitchfork structures remain fixed when changing timeframes, making them useful for higher-timeframe planning and lower-timeframe execution.
Multi-Symbol Panel with Flags
Pitchfork structures are saved per symbol. Enable the panel in the input settings to see which symbols already have active pitchforks attached, for easy re-visit.
Click the symbol buttons to instantly load that symbol on the chart.
How to Use Pitchfork Precise
1. Add the indicator to the chart.
2. Click an anchor to instantly place the pitchfork start point, P0. (Usually, P0 should be the highest swing in a downtrend or the lowest swing in an uptrend.)
3. Drag the vertical line just to the right of the desired third anchor, P2.
4. Use the corner panel to switch between different pitchfork variations.
5. To choose a different starting anchor, click Reset to show the anchors again and repeat the process.
Important Notes:
When a start anchor is selected, all other anchor markers are removed instantly for cleaner chart work. Need a different starting anchor? Click the Reset button to bring the anchors back, then select a new one. When switching to a different timeframe, the drag line is hidden and the mode buttons are removed to keep the chart clean.
What Does Correct Pitchfork Placement Mean?
Pitchfork Precise is designed for correct pitchfork placement based on the original Andrews logic.
A downtrend pitchfork is built from:
- A high
- Followed by a low
- Followed by a lower high
An uptrend pitchfork is built from:
- A low
- Followed by a high
- Followed by a higher low
This tool follows that anchor logic automatically. The result is a clean, authentic pitchfork structure based on the correct swing sequence.
Pitchfork Variations Explained
Pitchfork Precise includes multiple pitchfork variations, so you can quickly compare different structures and choose the one that fits price action best.
Schiff Pitchfork
The Schiff Pitchfork shifts the start point, P0, halfway in price toward P1, while keeping the same time position. This creates a flatter pitchfork, which can fit slower or shallower trends better.
Modified Schiff Pitchfork
The Modified Schiff Pitchfork shifts P0 halfway toward P1 in both price and time. This creates an angle between the standard Andrews Pitchfork and the Schiff Pitchfork. It can be useful when Andrews is too steep, but Schiff is too flat.
Inside Pitchfork (if enabled in the Input Settings)
The Inside Pitchfork uses a different construction method to test an alternative structure when the other variations do not fit price action well. It is less common and can sometimes point in a different direction than the standard pitchfork.
Notes and Limitations
Pitchfork Precise supports one pitchfork per chart per symbol.
The tool is not supported in the Strategy Tester.
The multi-symbol monitor buttons can be clicked to change the chart symbol. Compatibility with Expert Advisors attached to the same chart is not guaranteed.