Painel Otrader

Painel Pro:

O Pro Trader Dashboard   é a ferramenta profissional definitiva para MetaTrader 5, projetada para resolver o maior problema no trading: Disciplina e Gestão de Risco .  

Esta ferramenta funciona como seu "Gerenciador de Risco", aplicando limites diários para proteger seu capital e, ao mesmo tempo, oferecendo uma interface rápida e intuitiva para a execução de ordens. Seja você um Scalper ou um Day Trader, este painel ajuda você a executar negociações rapidamente e a parar quando atingir seus objetivos (ou limites).

Principais características:

1. Gestão Avançada de Riscos (O "Travamento Diário")

  • Limite de Perda Diária ($):   Bloqueia automaticamente novas negociações se o seu limite de perda diária for atingido. Impede negociações de "vingança".

  • Meta de Lucro Diário ($):   Garante seus ganhos! Bloqueia as negociações assim que sua meta financeira for atingida.

  • Número máximo de operações por dia:   Impede o excesso de negociações, limitando o número de operações diárias.

  • Reinicialização automática:   Todas as estatísticas são reinicializadas automaticamente à meia-noite do horário da corretora ou em um horário específico.

2. Execução Inteligente de Ordens

  • Negociação com um clique:   Botões grandes de COMPRA e VENDA para execução instantânea.

  • Ordens Pendentes Visuais:   Defina ordens de compra/venda com limite e stop simplesmente criando linhas no gráfico. Chega de digitar números manualmente.

  • Fechamento rápido:   Botões dedicados para "Fechar todas as posições" ou "Fechar apenas as lucrativas".

3. Calculadora de Dimensionamento de Posição

  • Cálculo automático de lotes:   Pare de adivinhar! Insira sua porcentagem de risco (por exemplo, 1% do saldo) e os pontos de Stop Loss, e o painel calculará automaticamente o tamanho correto do lote.

  • Valores em tempo real:   Mostra o valor monetário ($) do seu Stop Loss (SL) e Take Profit (TP) antes de você entrar na operação.

4. Interface Moderna

  • Móvel:   Arraste e solte o painel em qualquer lugar do gráfico usando as setas direcionais.

  • Escalável:   Botões de zoom para ajustar a qualquer resolução de tela (Full HD / 4K).

  • Modo minimizado:   recolha o painel para economizar espaço na tela ao analisar o gráfico.

Parâmetros de entrada:

  • MaxLossDiarioEmDolares:   Perda máxima permitida para o dia (ex.: 100,0).

  • MaxLucroDiarioEmDolares:   Meta de lucro diário para interromper as negociações.

  • TaxaPorLoteEmDolares:   Custo da comissão por lote (para cálculo preciso do lucro líquido).

  • MaxTradesDiarios:   Número máximo de negociações permitidas por dia.

  • Modo de operação:   Escolha entre "Automático" (Gerenciado com limites) ou "Livre" (Sem limites).

[PT-BR] Descrição em Português

Painel Pro Trader   é a ferramenta definitiva para MetaTrader 5, focada em resolver o maior problema dos traders: Disciplina e Gestão de Risco .  

Este importado atua como seu "Gerente de Risco", forçando limites diários para proteger seu capital, ao mesmo tempo que oferece um boleto rápido e intuitivo. Seja você um Scalper ou Day Trader, este painel ajuda a operar rápido e a parar quando a meta (ou o stop) é atingida.

Principais Funcionalidades:

1. Gestão de Risco Profissional (A "Trava do Dia")

  • Limite de Perda Diária ($):   Bloqueia novas ordens se o limite de perda para os atingidos. Evita o "dia de fúria".

  • Meta de Lucro Diária ($):   Protege seu ganho! Bloqueia operações assim que a meta financeira é batida.

  • Máximo de negociações:   evite o overtrading limitando a quantidade de transações no dia.    

  • Reset Automático:   As estatísticas zeram confidencialmente no dia seguinte.

2. Execução Inteligente

  • Boleta Rápida:   Botões grandes de COMPRA e VENDA.

  • Ordens Pendentes Visuais:   Coloque Buy/Sell Limit ou Stop apenas arrastando linhas no gráfico.

  • Fechamento Rápido:   Botões para "Fechar Tudo" ou "Fechar Apenas no Lucro".

3. Calculadora de Lote

  • Cálculo Automático:   Defina seu risco (ex: 1% da conta) e o tamanho do Stop, e o painel defina o lote exato.

  • Valores em Reais/Dólar:   Mostra quanto dinheiro vale seu Stop ou Alvo antes de entrar.

4. Interface Moderna

  • Movimentação:   Mova o painel para qualquer lugar da tela com as setas.

  • Zoom:   Aumente ou diminua o tamanho do painel (ideal para telas 4K ou notebooks).

  • Minimizar:   Oculte o corpo do painel para liberar espaço no gráfico. 


おすすめのプロダクト
GDS Renko Pip ST Chart - Pip-Based Renko Chart Indicator for MetaTrader 5 GDS Renko Pip ST Chart is a pip-based Renko chart indicator for MetaTrader 5. It helps traders build and study cleaner Renko price movement using a practical fixed pip or point-based brick structure. This tool is designed as a Renko chart foundation for manual analysis. It does not predict the market, does not generate buy or sell signals and does not decide whether a trade should be opened. Renko EDGE EA Golden Delta | A
Orion Vwap Bands
Joao Paulo Botelho Silva
Fundamentação teórica   A VWAP é uma média móvel ajustada pelo volume, ou seja, o peso de cada preço corresponde ao volume de ações negociadas no período, dando mais importância ao período em que se tenha mais negociações. A Orion Vwap Bands permite que o usuário use plote 8 bandas que podem ser utilizadas como suportes e resistências para o preço. Cada banda é calculada a partir da Vwap Tradicional: Ex.: Se escolhermos o valor 0.25 para a plotagem da Banda 1, pega-se o preço da Vwap e acrescent
Server Clock
Flavio Javier Jarabeck
5 (5)
Many friends asked me for a simple, non-obtrusive, resource-friendly clock to track the time during their trades. It seems pretty obvious, but it is a must-have for those trading the market manually, waiting for the Market News, or just to visually know what time it is... Trading is an absorbing endeavor! So, here it is... Totally configurable, including Font Type, Font Size and Chart Location: Upper Left/Center/Right OR Lower Left/Center/Right, with a little twist of adjusting the Offset, just
FREE
Smart Adaptive Renko Pro – Dynamic ATR & Fixed Box Renko Indicator Smart Adaptive Renko Pro is a powerful non-time-based Renko indicator designed to eliminate market noise and reveal true price momentum with precision. Unlike standard chart candles, this indicator builds Renko bricks based purely on price movement — helping traders focus on trend strength, reversals, and clean breakout structures. Key Features Adaptive ATR-Based Box Size (Auto-adjusts to market volatility) Fixed Pip Box M
Big Player Candles
Flavio Javier Jarabeck
4.91 (23)
If you heard about The Wyckoff Method, Volume Spread Analysis, etc... You are probably searching for the candlestick indicator that shows you the Volume spread all over the current bar, signaling every types of market status... You can control the several Market Levels with custom colors... It is up to you to decide how to use it. Our job is provide you with the indicator... If you like this indicator, all I am asking is a little Review (not a Comment, but a REVIEW! )...    This will mean A LO
FREE
Timeless Charts
Samuel Manoel De Souza
5 (8)
Timeless Charts is an all-in-one trading utility for professional traders. It combines custom chart types such as Seconds Charts and Renko with advanced order flow analysis using Footprints , Clusters , Volume Profiles , VWAP studies, and anchored analysis tools for deeper market insight. Trading and position management are handled directly from the chart through an integrated trade management panel , while Market Replay and Virtual Accounts provide environments for practicing trading skills and
Master HMA
Leonel Alberto Jose Quintana
MetaTrader 5 用 Master HMA Master HMA は、MetaTrader 5 向けに開発されたテクニカルインジケーターで、複数の Hull Moving Average の計算を1つのビジュアル構造に統合し、価格の方向性、傾き、値動きの状態を分析するために設計されています。 このインジケーターは Fast、Main、Slow の3つの HMA 期間を使用します。これらのラインの関係を見ることで、値動きの構造変化を確認し、市場のさまざまな局面を追跡できます。 Main HMA は、システムが判定した状態に応じて異なる色で表示されます。また、Fast HMA と Slow HMA の関係によって形成されるクラウドを表示することもできます。 構造分析 Master HMA は、移動平均線の挙動に関するさまざまな特徴を分析します。これには、傾き、HMA 間の距離、収縮、拡大、加速、勢いの低下、クラウド幅の変化などが含まれます。 これらの情報を組み合わせることで、現在の値動きの構造を視覚的に把握できます。 Master Score このインジケーターには Master
Donchian Channel DC is the indicator of Donchian Channels, that plots maximum and minimum values of a specific period, besides mean value line. It´s possible to configure simple period for analysis and the indicator will plot all three values. You can trade with this indicator as trend or reversal, according to each strategy. Do not let to test others indicators as soon as others expert advisors.
Bar CountDown Price - Dynamic Candlestick Timer Only for Today Offer EA:  Overlap King Gold The Bar CountDown Price indicator is a lightweight, essential visual tool designed for precision traders who rely on candlestick closing times for their entry and exit strategies. Unlike traditional countdown indicators that hide the timer in the corner of the chart, this utility anchors the countdown directly next to the live current price. This ensures your eyes remain focused on the price action whe
FREE
TradePad
Ruslan Khasanov
5 (1)
TradePad は、手動取引とアルゴリズム取引の両方に使用できるツールです。複数の取引商品での迅速な取引操作とポジション管理のためのシンプルなソリューションを提供します。 注意: アプリケーションは戦略テスターでは動作しません。 デモアカウント用のアプリケーションの試用版とすべてのツールの説明 アプリケーション インターフェイスは高解像度のモニターに適応しており、シンプルで直感的です。快適な作業のために、トレーダーには次のツール セットが提供されます: 取引操作の管理、メイン チャートの期間の切り替え、TradePad 商品の切り替えを行うホット キー マネージャー。 ポジションを開くときや保留中の注文を設定するときに、ドローダウンのリスクを評価し、潜在的な利益を計算するために取引レベルをマークするツール。 複数の取引シンボルを視覚的に監視し、アルゴリズム取引の取引シグナルを受信するための MultiCharts ツール。利便性のために、取引ペアのセットを整理できます。これにより、複数の時間枠で価格を監視し、複数の通貨取引を行うことができます。 履歴の任意の期間の取引統計を表示するた
Weis Waves
Flavio Javier Jarabeck
2.83 (18)
The original author is David Weis, an expert in the Wyckoff Method. The Weis Wave is a modern adaptation of the 1930's Wyckoff Method, another expert in Tape Reading techniques and Chart Analysis. Weis Waves takes market volume and stacks it into waves according to price conditions giving the trader valuable insights about the market conditions. If you want to learn more about this subject you can find tons of videos in YouTube. Just look for "The Wickoff Method", "Weis Wave" and "Volume Spread
FREE
QuantMatrix Volume Depth is a MetaTrader 5 indicator for visual analysis of market activity across different price levels. The indicator builds a horizontal profile across the analyzed price range and shows where trading activity has been concentrated. It displays the Point of Control, Value Area High, Value Area Low and the distribution of activity across multiple price levels. The indicator can use real volume when it is available from the symbol. When real volume is not available, tick vol
Caicai L&S Yield Histogram Important Notice: This indicator is an integral tool of the automated EA Caicai Long and Short Pair Trading . This indicator visually displays the percentage deviation (Yield %) of a pair's current spread relative to its own historical mean. It is an excellent tool for quickly visualizing the gross financial potential of a market distortion in Long & Short operations. Main Features: Percentage Visualization: Understand the size of the distortion in palpable percentage
CosmiCLab SMC FIBO CosmiCLab SMC FIBO is a professional trading indicator designed for traders who use Smart Money Concepts (SMC), market structure analysis and Fibonacci retracement levels. The indicator automatically detects market swings and builds Fibonacci levels based on the latest impulse movement. It also identifies market structure changes such as BOS (Break of Structure) and CHOCH (Change of Character), helping traders understand the current market direction. CosmiCLab SMC FIBO also pr
Enhanced Elliott Wave Pro – Advanced Market Structure & Wave Analysis   Enhanced Elliott Wave Pro is a lightweight, institutional-grade MT5 indicator that eliminates chart clutter by detecting and displaying only the current, active market structure: the 1-2-3-4-5 Impulse wave and the subsequent A-B-C Correction.   Built with classic Prechter wave rules and ATR-adaptive pivot detection, it delivers clean, real-time wave counts without bogging down your terminal.   ――――――――――――――――――――――――――――
HAS RSI Signal — SL/TP自動計算機能付き プロフェッショナル・トレンドインジケーター HAS RSI Signal は、信頼性の高いクラシックな手法と最新のノイズ除去アルゴリズムを融合させた強力なトレーディングツールです。 平均足スムーズド(Heiken Ashi Smoothed) と RSI を組み合わせることで、トレンドの転換点や買われすぎ・売られすぎ圏からの脱出タイミングを正確に捉え、明確なエントリーシグナルを提示します。 主な特徴: 二重のフィルタリング: 平均足スムーズドで市場の「ノイズ」を除去し、RSIで勢い(モメンタム)の強さを確認します。 損切り・利確ラインの自動計算: 単にシグナルを出すだけでなく、ボラティリティ( ATR )に基づいた最適なストップロス(SL) と テイクプロフィット(TP)を自動で算出します。 視覚的な分かりやすさ: シグナルはチャート上にカラーキャンドルとして表示されるため、一目でトレンドを把握でき、取引画面をスッキリと保てます。 充実の通知機能: アラート、音声、スマートフォンへのプッシュ通知機能を搭載。チャンスを逃すこと
Fundamentação teórica A VWAP é uma média móvel ajustada pelo volume, ou seja o peso de cada preço corresponde ao volume de ações negociadas no período, dando mais importância ao período em que se tenha mais negociações. [1] VWAP = sum(price[i]*volume[i]) / sum(volume[i]) Metodologia É possível configurar o período que será utilizado para o calculo da VWAP, a cor, a espessura e o estilo da linha. A linha é desenhada desde a o começo da série disponível apenas uma vez para economizar recursos com
FREE
Weis Wave Scouterは、MetaTrader 5向けに開発された革新的なインジケーターであり、WyckoffメソッドとVSA(Volume Spread Analysis)の確立された原則を組み合わせています。精度と深みを求めるトレーダー向けに設計され、累積ボリューム波の分析を通じて市場を戦略的に読み取り、トレンドの反転ポイントや継続ポイントを特定する支援を行います。 Weis Wave Scouterは、クラシック、ナイトビジョン、オーシャンブリーズといったカスタマイズ可能なカラーテーマで、上昇波と下降波を色分けしたヒストグラムで明瞭に表示します。主な機能には、ボリュームピークの検出、低アクティビティゾーン(DeadZone)の識別、およびボリュームベースの波の反転に関するカスタマイズ可能なアラートが含まれます。また、エフォート対リザルト分析、因果関係、需給バランスといったWyckoffおよびVSA理論の基本概念をサポートしています。Brick Size、Volume Scale Factor、Pivot Lookbackといったパラメータで柔軟に調整でき、あらゆるスタ
The Metatrader 5 has a hidden jewel called Chart Object, mostly unknown to the common users and hidden in a sub-menu within the platform. Called Mini Chart, this object is a miniature instance of a big/normal chart that could be added/attached to any normal chart, this way the Mini Chart will be bound to the main Chart in a very minimalist way saving a precious amount of real state on your screen. If you don't know the Mini Chart, give it a try - see the video and screenshots below. This is a gr
Crypto_Forex MT5用インジケーター「 WPR with 2 Moving Averages 」(リペイント機能なし) - WPR自体はスキャルピングに最適なオシレーターの1つです。 - 「WPR and 2 Moving Averages」インジケーターを使用すると、WPRオシレーターの高速移動平均線と低速移動平均線を確認できます。 - このインジケーターを使用すると、価格調整を早期に把握できます。 - このインジケーターはパラメータで簡単に設定でき、どの時間枠でも使用できます。 - 買いと売りのエントリー条件は画像で確認できます。 - WPR MA クロスの PC およびモバイル アラート付き。 買いシグナルの条件例: (1) - 高速MAが低速MAを下向きにクロスし、WPR値が-50を下回っている場合:買いトレードを開きます。 (2) - WPR値が-20を超える買われすぎゾーンに入ったら:買いトレードを終了します。 売りシグナルの条件例: (1) - 高速MAが低速MAを下向きにクロスし、WPR値が-50を超えている場合:売りトレードを開きます。 (2) WP
RENKO PRICE ACTION ATRは、レンコチャートの作成を通じて開発された「エキスパートアドバイザー」であり、各BRICKは、ユーザーが選択した期間のATRによって計算されたサイズを持ちます。 レンコチャートは、マイナーな価格変動を除外するように設計されているため、トレーダーは重要なトレンドに集中しやすくなります。 価格動向の検出効率が高いため、支持と抵抗、および上下の相違を明確に識別して、取引機会をより有効に活用することもできます。 手術 RENKO PRICE ACTION ATRは、どの通貨ペアでも機能します。 RENKO PRICE ACTION ATRは、優れたリアルタイム更新パフォーマンスを備えています。 設定 ATR計算時間枠:ATRの平均を適用し、各BRICKのサイズを計算/再計算するためのRENKO PRICE ACTIONATRのユーザー選択期間。 ATR計算平均化期間:各BRICKのサイズ計算を実行するためのRENKO PRICE ACTIONATRのATR平均化のユーザー選択期間。 ATRサイズのパーセンテージ:各BRICKの形成に使用される計
Inverted_Chart_EA Utility Expert Advisor Inverted_Chart_EA creates and maintains a mirror-inverted chart of any symbol and timeframe. It automatically generates a custom instrument (e.g. US30_INV ) and keeps its price history updated in real time, with bars mirrored around a chosen pivot. This utility gives traders a new way to analyze the market from a different perspective by flipping the chart upside down. Why use an inverted chart? Highlight hidden patterns – price formations that look ordin
Fibo + Elliott + CME The Expert Adviso r is designed as an assistant for manual trading. Ready-made trading system based on  Elliott waves   and Fibonacci retracement levels . It is simple and affordable. Display of the marking of Elliott waves (main or alternative option) on the chart. Construction of horizontal levels, support and resistance lines, a channel. Superposition of Fibonacci levels on waves 1, 3, 5, A Display data from CME (CME - Chicago Mercantile Exchange Chicago Mercantile Excha
Crypto_Forex MT5用インジケーター「ハンマー&シューティングスターパターン」。リペイント不要、遅延なし。 - インジケーター「ハンマー&シューティングスターパターン」は、プライスアクショントレードに非常に強力なインジケーターです。 - このインジケーターは、チャート上で強気のハンマーパターンと弱気のシューティングスターパターンを検出します。 - 強気のハンマーパターン:チャート上に青い矢印シグナルを表示します(画像参照)。 - 弱気のシューティングスターパターン:チャート上に赤い矢印シグナルを表示します(画像参照)。 - PC, Mobile alerts. - インジケーター「ハンマー&シューティングスターパターン」は、サポートレベル/レジスタンスレベルと組み合わせるのに最適です。 高品質のトレーディングロボットとインジケーターをご覧になるにはここをクリックしてください! これは、このMQL5ウェブサイトでのみ提供されるオリジナル製品です。
Volume Waves
Paulo Henrique Faquineli Garcia
One of the best tools for analyzing volume, Weis Wave was devised by David Weis to facilitate reading the directional flow. For the disciples of the Wyckoff method, this means an evolution, facilitating a predictive reading of the market, always looking for Accumulation and Distribution zones for traded assets. For better understanding, in this indicator we try to cover every reading of EFFORT (traded volume) versus RESULT (price change). Thus, you can apply the indicator on the chart twice to
True Weis Wave
Atila Goncalves Firmino
A version based on David Waves' description in his book 'Trade About to Happen' of his adaptation of the Wyckoff wave chart. The indicator directionally accumulates volume, adding to each brick or candle close, with color indication for up and down. it can be used it with tick or real volume, it also changes color when the accumulated value of the previous wave is exceeded, being the trade signal. Yellow color is used for doji candlestick, it will continue with accumulation without zero the sum
Vwap Candles Matrix
Thales Bitencourt De Souza
Vwap Candles Matrix See what price alone cannot show. Vwap Candles Matrix is a professional market-flow analysis system for MetaTrader 5, created to transform complex volume and directional information into a clear visual structure. This is not a conventional buy/sell indicator. It is an analytical framework designed to reveal market participation, directional pressure, liquidity behavior and flow structure through a proprietary synthetic candle environment. Instead of adding more noise to the c
FREE
Multi-Timeframe Heiken Ashi (Smoothed with Dashboard) Professional Market Structure Visualization with Weighted Confluence Scoring Transform your trading with crystal-clear multi-timeframe analysis. This indicator combines smoothed Heiken Ashi candles with an intelligent weighted scoring system to give you unprecedented clarity in any market condition. YOUR TRADING QUESTIONS – ANSWERED INSTANTLY: 1. What's the REAL trend direction? Dashboard Reveals:   Higher timeframe (MN1, W1, D1, H4) trend a
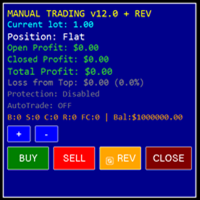
ReplayStrategy EA v12.04 - Professional Trading Panel Overview Manual Trading EA is a comprehensive visual trading assistant for discretionary traders who want enhanced control, automation features, and detailed profit tracking. This EA provides a sophisticated control panel with real-time statistics, intelligent position management, and advanced protection systems. Key Features Complete Information Panel Real-time position tracking (LONG/SHORT/FLAT) Live profit monitoring (open, closed
Gino Renko
Stephane, Andr Valette
1 (1)
Another renko-based indicator. It returns different usable values ​​for an EA, and is directly displayed on the main chart. Its setting is very simple: The size of the renko The number of bars taken into account The falling color The color on the rise Returned values: Buffer 0 : Value of the middle Buffer 1 : Value of the Top Buffer 2 : Value of the Bottom Buffer 3 : Direction of renko (0.0 for top ; 1.0 for bottom) Buffer 4 : Ratio of the renko, for example, if it is twice, 3 times, ro more of
このプロダクトを購入した人は以下も購入しています
Trade Assistant MT5
Evgeniy Kravchenko
4.43 (216)
取引 ごとのリスクの 計算、新規注文 の 簡単 な 設置、部分的 な 決済機能 を 持 つ 注文管理、 7 種類 のトレーリングストップなど 、便利 な 機能 を 備 えています 。 追加の資料と説明書 インストール手順   -   アプリケーションの手順   -   デモアカウント用アプリケーションの試用版 ライン機能 チャート上にオープニングライン、ストップロス、テイクプロフィットを表示します。この機能により、新規注文を簡単に設定することができ、注文を出す前にその特徴を確認することができます。   リスク計算 リスク計算機能は、設定されたリスクとストップロス注文のサイズを考慮して、新規注文のボリュームを計算します。ストップロスの大きさを自由に設定できると同時に、設定したリスクを守ることができます。 Lot calc ボタン - リスク 計算 を 有効 / 無効 にします 。 Risk フィールドでは 、必要 なリスクの 値 を 0 から 100 までのパーセンテージまたは 預金通貨 で 設定 します 。 設定」 タブで 、 リスク 計算 の 種類 を 選択 します :「 $ 通
Trade Manager EAへようこそ。これは、取引をより直感的、正確、そして効率的にするために設計された究極の リスク管理ツール です。これは単なるオーダー実行ツールではなく、包括的な取引計画、ポジション管理、リスク管理のためのソリューションです。初心者から上級者、迅速な実行を必要とするスキャルパーまで、Trade Manager EAはあらゆるニーズに対応し、為替、指数、商品、暗号通貨などさまざまな市場で柔軟に対応します。 Trade Manager EAを使用すると、複雑な計算が過去のものになります。市場を分析し、エントリーポイント、ストップロス、テイクプロフィットのレベルをチャート上のラインでマークし、リスクを設定するだけで、Trade Managerが最適なポジションサイズを即座に計算し、SLとTPをピップ、ポイント、口座通貨でリアルタイムに表示します。すべての取引が簡単かつ効果的に管理されます。 主な機能: ポジションサイズ計算機 :定義されたリスクに基づいて取引サイズを瞬時に決定します。 簡単な取引計画 :エントリー、ストップロス、テイクプロフィットを設定するためのド
Telegram to MT5 Multi-Channel Copier   は、 Telegram と Discord チャンネルのトレードシグナルを MetaTrader 5 へ自動コピーします。ボット不要、ブラウザ拡張不要、手動コピー不要。Telegram や Discord にシグナルが届くと、EA が数秒であなたのターミナルに注文を出します。 さらに、チャンネルをコピーする前に、内蔵バックテスターでそのチャンネルがあなたの口座でどう動いたかを確認できます。 製品は 2 つのコンポーネントで構成されます:Telegram チャンネルを監視する Windows アプリと、MT5 ターミナルでシグナルを執行する本 EA です。MT4 版もあります   こちら . セットアップガイドとアプリのダウンロード:   https://www.mql5.com/en/blogs/post/768988 Telegramのシグナルチャンネルをバックテストする方法 をご覧ください。 現在の価格は今後値上げされます。 仕組み アプリはあなた自身の Telegram アカウントで接続するため、フォロ
================================================================================ POC BREAKOUT - V20.72. Full Professional Grade Toolkit ================================================================================ POC Breakout is a full MetaTrader 5 trading dashboard for discretionary traders who want breakout signals, Point of Control (POC) context, volume profiles, order flow, market structure, news, alerts, and advanced trade planning in one professional workspace. Attached directly to you
TradePanel MT5
Alfiya Fazylova
4.88 (170)
Trade Panelは多機能なトレーディングアシスタントです。アプリには手動取引用の50以上のトレーディング機能が搭載されており、ほとんどの取引作業を自動化することができます。 アプリの説明書: https://www.mql5.com/en/blogs/post/756482 デモ口座用アプリの試用版: https://www.mql5.com/en/blogs/post/750865 アプリのインストール方法: https://www.mql5.com/en/blogs/post/756239 アプリをビジュアルモードでテストする方法: https://www.mql5.com/en/blogs/post/770277 VPSのMetaTraderにアプリをインストールする方法: https://www.mql5.com/en/blogs/post/770190 取引。 ワンクリックで取引操作を行うことができます: リスクを自動計算して指値注文やポジションを開く。 複数の注文やポジションをワンクリックで開く。 注文のグリッドを開く。 保留中の注文やポジションをグループごとに閉じる
The Patch It never opens a trade. It walks behind the ones that did. Every open position, every pending order — checked twice a second for the one thing that's easy to forget: a stop, a target. Found bare, it doesn't ask. It writes the missing number in, measured in points from wherever the position began, and moves on to the next. No strategy, no opinion on direction. Just the quiet assumption that nothing should ever sit on the market unprotected — not because someone decided it shouldn't,
自分の取引ルールで Telegram のシグナルをコピー Telegram to MT5 Signal Trader は、Telegram の公開・非公開チャンネルやグループから、テキスト形式の取引シグナルを MetaTrader 5 へ自動でコピーします。1つのデスクトップアプリで複数の配信者と MT5 口座を管理し、 配信者ごとにリスクと取引設定を個別に指定 できます。 シグナルのコピーに Telegram ボットや API 設定は必要ありません。 電話番号または QR コードでご自身の Telegram アカウントにログインし、すでに参加しているチャンネルやグループを選ぶだけです。ボットの作成や、Telegram API トークン、API ID、API hash の入力は不要です。 ポジションサイズを選び、複数の利確水準に分けて決済し、建値へのストップ移動やトレーリングストップを自動化できます。配信者のシグナルを受け取りながら、実際の取引方法は自分で管理できます。 本製品は、この MT5 エキスパートアドバイザ(EA)と、必須の Windows 連携アプリで構成されます。 インス
Floor Watch
Syed Tauqeer Hussain Shah
Floor Watch One number, watched every thirty seconds: how far equity has fallen since the day began — or since its highest point, if it's told to trail the peak instead of the open. Cross the line and it doesn't argue. Every open position closes, every pending order vanishes, and anything that slips through afterward gets shut the moment it appears. Not asked. Removed. The floor holds until the clock turns 5 AM Pakistan time — then, and only then, does the day start over. One rule. No except
Power Candles Strategy Scanner - 自動最適化型マルチシンボル設定ファインダー パワーキャンドル・ストラテジー・スキャナーは 、パワーキャンドル・インジケーターを駆動するのと全く同じ自己最適化エンジンを、マーケットウォッチに登録されているすべての銘柄に対して並行して実行します。1つのパネルで、現在統計的に取引可能な銘柄、各銘柄で勝率の高い戦略、最適なストップロス/テイクプロフィットの組み合わせが表示され、新たなシグナルが発生した瞬間に通知が届きます。 このツールは、Stein Investmentsのエコシステムの一部です。  18種類以上のツールをすべて閲覧し、AIを活用したセットアップの推奨を受け取り、  https://stein.investments でコミュニティに参加しましょう 市場動向を網羅。銘柄ごとに3,000件以上の自動最適化。2種類のアラート。ワンクリックでチャートを切り替えて即座にアクション。 なぜこれが必要なのか 多くのマルチ銘柄スキャナーは、 価格の動き (ボラティリティ、変動率、銘柄ごとのRSI)を表示するだけです。それ
Grid Manual MT5
Alfiya Fazylova
4.73 (22)
「Grid Manual」は、注文のグリッドを操作するための取引パネルです。 ユーティリティはユニバーサルで、柔軟な設定と直感的なインターフェイスを備えています。 それは、損失を平均化する方向だけでなく、利益を増やす方向でも注文のグリッドで機能します。 トレーダーは注文のグリッドを作成して維持する必要はありません。 すべてが「Grid Manual」によって行われます。 注文を開くだけで十分であり、「Grid Manual」は注文のグリッドを自動的に作成し、非常に閉じるまでそれに付随します。 完全な説明とデモバージョン ここ。 ユーティリティの主な機能と機能 ユーティリティは、モバイル端末から開かれた注文を含め、あらゆる方法で開かれた注文を処理します。 「制限」と「停止」の2種類のグリッドで機能します。 グリッド間隔の計算には、固定と動的(ATRインジケーターに基づく)の2つの方法で機能します。 オープンオーダーグリッドの設定を変更できます。 チャート上の各注文グリッドの損益分岐点を表示します。 各注文グリッドの利益率を表示します。 ワンクリックでグリッドから収益性の高い注文を閉じるこ
一度の購入で、現在提供中および今後リリースする私のすべての MT4・MT5 インジケーターを追加料金なしで受け取れます。 購入後、受け取り方法について私にお問い合わせください。 10 件の購入ごとに 50$ ずつ、最大 999$ まで値上げする予定です。購入手続き時に Market に表示される価格が適用されます。 信頼するインジケーターをそのままに。周辺の取引作業を自動化。 あなたのシグナル。あなたのルール。あなたの取引執行。 信頼する MT5 インジケーターはあるのに、チャートの監視、シグナル待ち、ロット計算、発注、各ポジションの管理を手作業で行っていませんか? Stratiora Signal Engine MT5 は、これらの作業をつなぎます。対応する買い・売りバッファのシグナルを、エントリー、取引量計算、Stop Loss、Take Profit、フィルター、ポジション管理、口座保護までの自動処理に変換できます。 インジケーターや取引アイデアを変えるたびに別の EA を依頼する代わりに、柔軟な一つのエンジンで各シグナルの取引方法を決められます。 あなたのシグナル。あなたのル
Daily Trading Limiter
AL MOOSAWI ABDULLAH JAFFER BAQER
5 (8)
• Please test the product in the Strategy Tester before purchasing to understand how it works. • If you face any issues, contact me via private message—I’m always available to help. • After purchase, send me a screenshot of your order to receive a FREE EA as a gift. Daily Trading Limiter — the rule you cannot break Every trader knows the number. Three trades. Two percent. One bad day and stop. And every trader has watched themselves take the fourth trade anyway. The problem was never knowing th
VirtualTradePad PRO SE MT5 — MetaTrader 5向けプロフェッショナル取引コントロールセンター VirtualTradePad PRO SE は、 MetaTrader 5 向けのプレミアムなチャートベースの取引パネルであり、トレード管理ワークスペースです。より速い執行、明確なポジション管理、構造化されたトレード管理、視覚的なレベル計画、そしてチャート上で完結するプロフェッショナルなワークフローを求めるトレーダー向けに設計されています。 これは単なる BUY / SELL パネルではありません。PRO SE は、手動取引、予約注文、ポジション管理、部分決済、バスケット損益管理、平均化レベル、ATMルール、シグナル監視、リアルタイム市場情報、ストラテジーテスター (Strategy Tester) ワークフロー、VPS向け運用を、1つの連携されたインターフェースに統合します。 MT4版 | 完全な説明とスクリーンショット | 購入方法 | インストール方法 | ログファイルの取得方法 | テストと最適化の方法 | Expforex のすべての製品 PRO
FUTURES ORDERFLOW FOOTPRINT CHART Professional OrderFlow EA for MetaTrader 5 Version 1.01| Professional tool for real traders | Institutional-Grade Visualization STRATEGY TESTER USERS - PLEASE SELECT EVERY REAL TICK WHEN TESTING AND YOU HAVE DOWNLOADED HISTORICAL DATA. IF YOU SEE A WAITING SCREEN AND IT IS NOT DOWNLOADING, IT MEANS YOU HAVE LOW HISTORICAL DATA. TRY 1 MIN AND 5 MIN FIRST ON 1 DAY DATA. ONE DAY DATA SHOULD BE THE NEWEST AND MOST CURRENT DATE. PLEASE WAIT UNTIL THE MARKET HAS ROL
Trading Chaos Expert
Hennadii Stanilevych
5 (11)
This software has no equals in the world and represents a universal trade "console" covering trading signals, automated market entry, setting of Stop Loss and Take Profit, as well as Trailing Profit for multiple trades at the same time in a single open window. Intuitive control of the Expert Advisor in "three clicks" ensures a comprehensive use of all its functions on different computers, including tablets PCs. Interacting with additional signal indicators that mark the chart to give a real mark
The product will copy all telegram signal to MT5 ( which you are member) , also it can work as remote copier.  Easy to set up, copy order instant, can work with almost signal formats, image signal,  s upport to translate other language to English Work with all type of channel or group, even channel have "Restrict Saving Content", work with  multi channel, multi MT5 Work as remote copier: with signal have ticket number, it will copy exactly via ticket number. Support to backtest signal. How to s
Footprint Chart Pro — Professional OrderFlow EA for MetaTrader 5 Version 6.34 | Professional tool for real traders | Institutional-Grade Visualization DEMO USERS - PLEASE SELECT EVERY TICK / REAL TICK WHEN TESTING AND YOU HAVE DOWNLOADED HISTORICAL DATA. IF YOU SEE A WAITING SCREEN AND IT IS NOT DOWNLOADING, IT MEANS YOU HAVE LOW HISTORICAL DATA. TRY 1 MIN AND 5 MIN FIRST ON 1 DAY DATA. ONE DAY DATA SHOULD BE THE NEWEST AND MOST CURRENT DATE. PLEASE WAIT UNTIL THE MARKET HAS ROLLED OVER PERIOD.
Trade Indicator Assistant   is a powerful MT5 utility designed to turn indicators into automated trading systems. Its main feature is the ability to automatically detect an indicator’s   BUY and SELL signal buffers , without requiring you to know the buffer numbers, search through indicator settings, or modify the indicator source code. Bonus Indicator:   After purchasing Trade Indicator Assistant, contact me to receive   Trade Signal Pro   completely free as a bonus indicator. [Download Demo V
Premium Trade Manager - コーチ内蔵型トレードパネル Premium Trade Manager は、AIトレーディングコーチをあなたのチャートの中に置き、その下に完全な執行エンジンを備えたツールです。いつも通りにトレードをセットアップし、あなた専任のAIトレーディングコーチ Max にそのセットアップをそのまま読み取らせて、発注前に率直な見解を伝えてもらいましょう。ストップの幅が規律あるアプローチに合っているか、リスクサイズは適切か、高影響のニュースイベントが数分後に迫っていないか、プロップファームの制限に近づいていないか。その下には、クリックの後をすべて処理するエンジンが備わっています。ワンクリックのリスクサイズ計算による発注、チャート上でドラッグして組み立て、発注後も動かせるプラン、最大4段階の分割利確、7種類のトレール方式、リアルタイムのプロップファームコンプライアンス、ニュースガード、そしてコストを自ら採点するスプレッド機能。判断はあなたが下す。Max がもう一度確認する。後のことはすべてパネルが担う。 購入前に実際に触れて試せます。 ブラウザ上でライブ
YuClusters
Yury Kulikov
4.93 (43)
Attention: You can view the program operation in the free version  YuClusters DEMO .  YuClusters is a professional market analysis system. The trader has unique opportunities to analyze the flow of orders, trade volumes, price movements using various charts, profiles, indicators, and graphical objects. YuClusters operates on data based on Time&Sales or ticks information, depending on what is available in the quotes of a financial instrument. YuClusters allows you to build graphs by combining da
Farmed Hedge Yield Farming | All Markets (Manual - Hybrid - Semi/Automated EA) VERIFIED TRADING RESULTS - Farmed Hedge Yield Axi Copy:  https://www.mql5.com/en/signals/2356376 - Farmed Hedge Yield Exn Copy:   https://www.mql5.com/en/signals/2356404 - Farmed Hedge Yield V Copy:  https://www.mql5.com/en/signals/2357156 IMPORTANT NOTICE: FarmedHedge is a MANUAL-FOCUSED TRADING UTILITY ,not a fully automated EA. Results shown on this Signal include manual trades and overall strategic management.
Your EAs cannot see each other, but Anchor can. Anchor gives you one place to coordinate your EAs, manage risk, and decide when trading is allowed. It works alongside the trading bots you already use without any changes to them. The Problem One EA opens a trade. Then another starts trading. The next thing you know, you wake up to multiple grids built across your account. Each EA may be doing exactly what it was designed to do, but together they can place far more risk on your account than you in
Take a Break pauses your Expert Advisors when trading is a bad idea: before news, after a daily loss, outside your trading hours, or when a rule you wrote yourself says so. When the pause is over, your EAs simply continue. Account protection for all your EAs in one tool: news filter, drawdown and equity protection, time filter and custom rules. One EA on one chart protects the whole account, the free indicator gives every chart its own rules on top. Free demo | What is new in 26.09 | Support Ass
is a lightweight but powerful utility designed for traders who need instant visual feedback and automated exit levels . It seamlessly integrates a customizable Information Panel directly onto your trading chart while managing your risk in the background . Dynamic UI: Move the information display to any of the four corners of your chart and customize the font, size, and colors to match your template . Precision Control: Define your Stop Loss and Take Profit in points, which the EA then calculates
AI Arbitron — an MT5 Spot vs Future Gold Arbitrage Bot designed to capture price discrepancies between correlated Spot and Future instruments through hedged, non-directional trading. Platform: MT5 Asset: Mainly Gold (XAUUSD) using Spot + Future/CFD price feeds. Core strategy: It monitors the price gap between Spot and Future. When the gap reaches your defined threshold, it opens hedged positions—typically Buy Spot + Sell Future (or the reverse depending on the gap). Exit: Positions are closed
EASY Insight AIO – スマートで手間いらずな取引のオールインワンソリューション 概要 数秒で市場全体——FX、ゴールド、暗号資産、指数、さらには株式まで——を、手作業のチャート確認や複雑なセットアップ・インジケーター導入なしにスキャンできたらどうでしょうか? EASY Insight AIO はAIトレードのための究極のプラグ&プレイ型エクスポートツールです。市場全体のスナップショットを、クリーンなCSVファイルで一括出力。ChatGPT、Claude、Gemini、Perplexityなど、さまざまなAIプラットフォームで即座に解析できます。 ウィンドウの切り替えやグラフのごちゃごちゃしたオーバーレイはもう不要。自動エクスポートされる純粋で構造化されたインサイトだけで、無駄なチャート監視に悩まされず、スマートなデータ主導の判断に集中できます。 なぜEASY Insight AIOなのか? 本当のオールインワン • セットアップ不要、インジケーターのインストール不要、チャートへのオーバーレイ不要。インストールして起動し、エクスポートするだけです。 マルチアセット対
One button. One trade. MT5 Trading Deck is a hotkey trading panel for MetaTrader 5 that turns the platform into a keyboard-driven execution cockpit. Stop loss, take profit and lot size are pre-calculated for every key; the moment you press, a market order is live on the broker. A complete technical user manual is attached in the product Comments section. It documents every input parameter, the full hotkey map, the recommended Stream Deck XL layout, and the advanced workflows for Pre-Limit orders
Custom Timeframe Manager Pro: MetaTrader 5 で無制限のタイムフレームを ターミナルの標準設定では、価格変動の重要な詳細が隠れてしまうことがよくあります。分析をクラシックな期間のみに制限すると、トレーダーはトレンドの発生の瞬間や真のボラティリティレベルを見逃すリスクがあります。 Custom Timeframe Manager Pro は、MetaTrader 5 の限界を広げるプロフェッショナルなユーティリティです。分数やエキゾチックな期間を含む、あらゆるカスタム期間を作成し、ターミナルのネイティブチャートと同じように操作できます。 利用可能な期間タイプ: 秒足 :任意の数値(例:S1, S5, S15, S30)。 分数足 :分析を微調整するための非標準インターバル(例:M1.5, H1.5, D1.2)。 カスタム :戦略的分析のための多日、多週の拡大期間。 メリット: 本格的なチャート :作成された期間はMT5のネイティブチャートとして機能し、あらゆるインジケーター、オシレーター、テンプレート、EAを適用できます。これは「オーバーレイ」
EA Slipstream
Stephen J Martret
5 (1)
Your backtest filled every order at the price it asked for. Your account does not. EA Slipstream measures what execution costs your EA, using your own fills, slippages and spreads to show you the true performance of your EA. A backtest prices every trade at the level the EA named. In live trading a pending order fills at whatever price is available when it triggers, a stop closes wherever the market is when it is hit, and the spread at that moment is whatever the account was quoting. The differ
作者のその他のプロダクト
Replay Study — Train the Market as If It Were Live Replay Study is a tool designed for traders who want to accelerate their growth through realistic practice. With it, the trader can go back in time, choose a specific date and time, and follow the market candle by candle, simulating decisions as if they were trading live. Instead of simply looking at a static chart after the move has already happened, Replay Study allows you to study price behavior in motion, test entries, train market reading,
フィルタ:
レビューなし
レビューに返信