ArfimaPro
- インディケータ
- バージョン: 1.0
- アクティベーション: 5

ArfimaPro – Real‑Time Market Regime Detection
Most strategies fail because they trend‑follow during mean‑reverting markets and mean‑revert during trending markets. ArfimaPro solves this by measuring the market's long‑memory structure in real time using the Geweke‑Porter‑Hudak (GPH) estimator of the fractional differencing parameter d – the key ARFIMA statistic.
Key Features
-
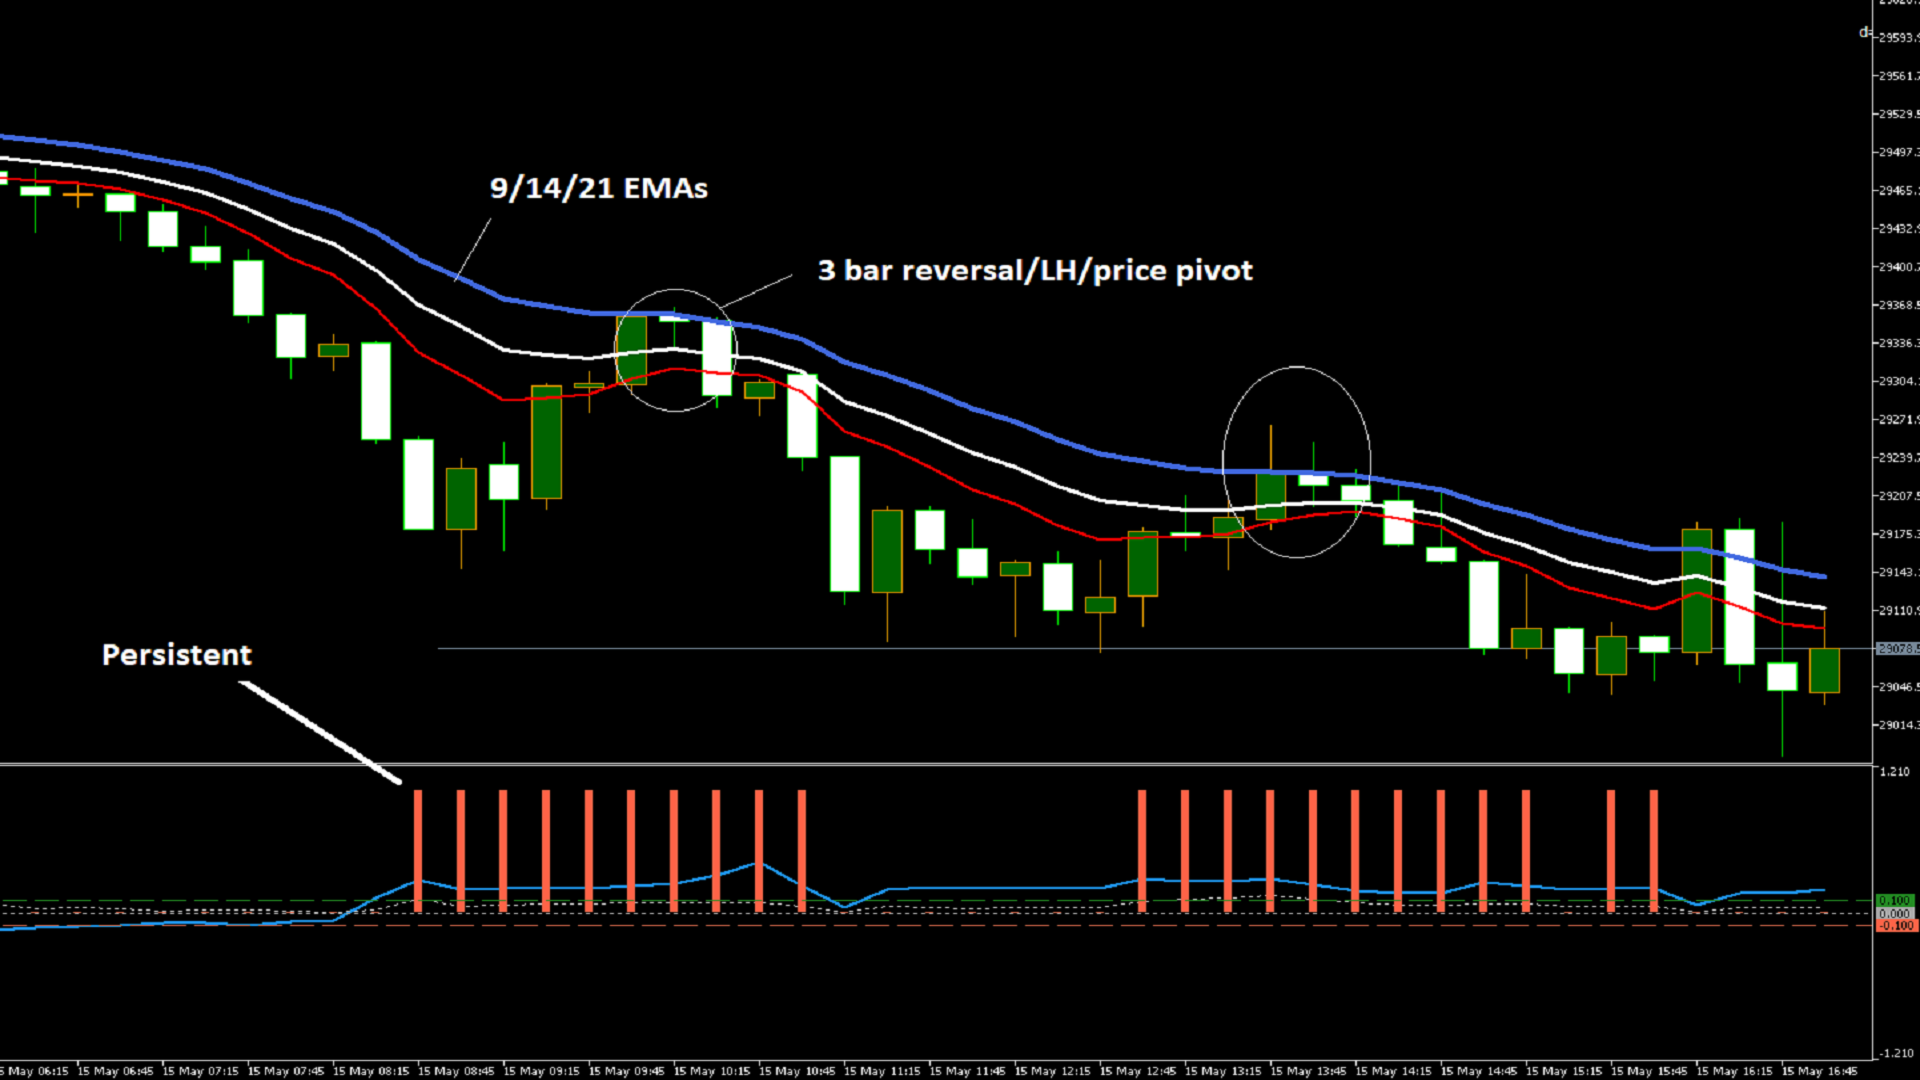
GPH d(t) estimation – Plots the fractional differencing parameter d (blue line). d > 0 indicates long memory (persistence); d < 0 indicates anti‑persistence (mean‑reversion).
-
R² confidence line – Grey dotted line showing the goodness‑of‑fit of the log‑periodogram regression (0..1). The regime signal is only displayed when confidence > 0.05.
-
Regime histogram – Coloured histogram (+1, 0, –1) showing persistent (+1), anti‑persistent (–1), or neutral (0) state.
-
Three reference lines – Horizontal lines at d = +0.1, 0, and –0.1 for quick visual orientation.
-
Optional d smoothing – Simple moving average of d (golden line) can be enabled to reduce noise.
-
Text label – Shows current d, confidence, and regime (TREND/MEAN‑REVERT/NEUTRAL) on the main chart.
-
Alerts – Popup, email, and push notifications on regime changes.
-
Fully customisable – Adjustable lookback period (default 120), regime thresholds, smoothing, colours, and more.
Why This Matters
-
Persistent regime (d > 0.1): trend‑following strategies have a statistical edge.
-
Anti‑persistent regime (d < –0.1): mean‑reversion strategies are more appropriate.
-
Neutral zone (d near zero or low confidence): no directional bias – staying out preserves capital.
Manual Trading Strategies (No Coding Required)
Use these simple rules with the regime histogram:
Regime +1 (TREND):
-
54‑period LWMA pullback: price pulls back to touch the 54 LWMA, then closes back in the trend direction. Exit on opposite regime signal or 2× ATR trailing stop.
-
Breakout of previous bar's high/low: enter long on break of previous bar's high (short on break of low). Exit when price closes below 10‑period low (long) or above 10‑period high (short).
Regime –1 (MEAN‑REVERT):
-
RSI(14) extremes: RSI < 30 → buy; RSI > 70 → sell. Exit when RSI crosses back above 40 (buy) or below 60 (sell).
-
Bollinger Bands (20,2): price touches lower band → buy; touches upper band → sell. Exit when price returns to the middle band (20 SMA).
Regime 0 (NEUTRAL):
-
Stand aside or trade with 50% reduced position size. Wait for regime to become +1 or –1.
Input Parameters
- InpPeriod = 120 – Lookback period in bars (recommended 90–150 for M15)
- InpLongMemThresh = 0.1 – d above this → long memory regime (trend‑following)
- InpAntiPersThresh = -0.1 – d below this → anti‑persistent regime (mean‑reversion)
- InpShowConfidence = true – Plot R² confidence line
- InpShowRegimeHist = true – Plot regime histogram
- InpShowSmooth = false – Show smoothed d (SMA)
- InpSmoothPeriod = 5 – Smoothing period for d (if enabled)
- InpShowValueLabel = true – Show text label on main chart
- InpEnableAlerts = true – Enable alerts on regime change
- InpAlertPopup = true – Popup alert
- InpAlertEmail = false – Send email
- InpAlertPush = false – Send push notification
Installation
-
Attach the indicator to any M1–M15 chart (US100/USTECH/NQ100 recommended).
Disclaimer
Past performance does not guarantee future results. This indicator provides no guarantee of profitability. Trading financial markets involves substantial risk. The product description may not be copied or reproduced without permission.
References
- Geweke, J. and Porter‑Hudak, S. (1983). The estimation and application of long memory time series models. Journal of Time Series Analysis;
- Based on the "Market Microstructure in MQL5" article series.