Abnormal situation mt5
- インディケータ
- バージョン: 1.0
- アクティベーション: 5

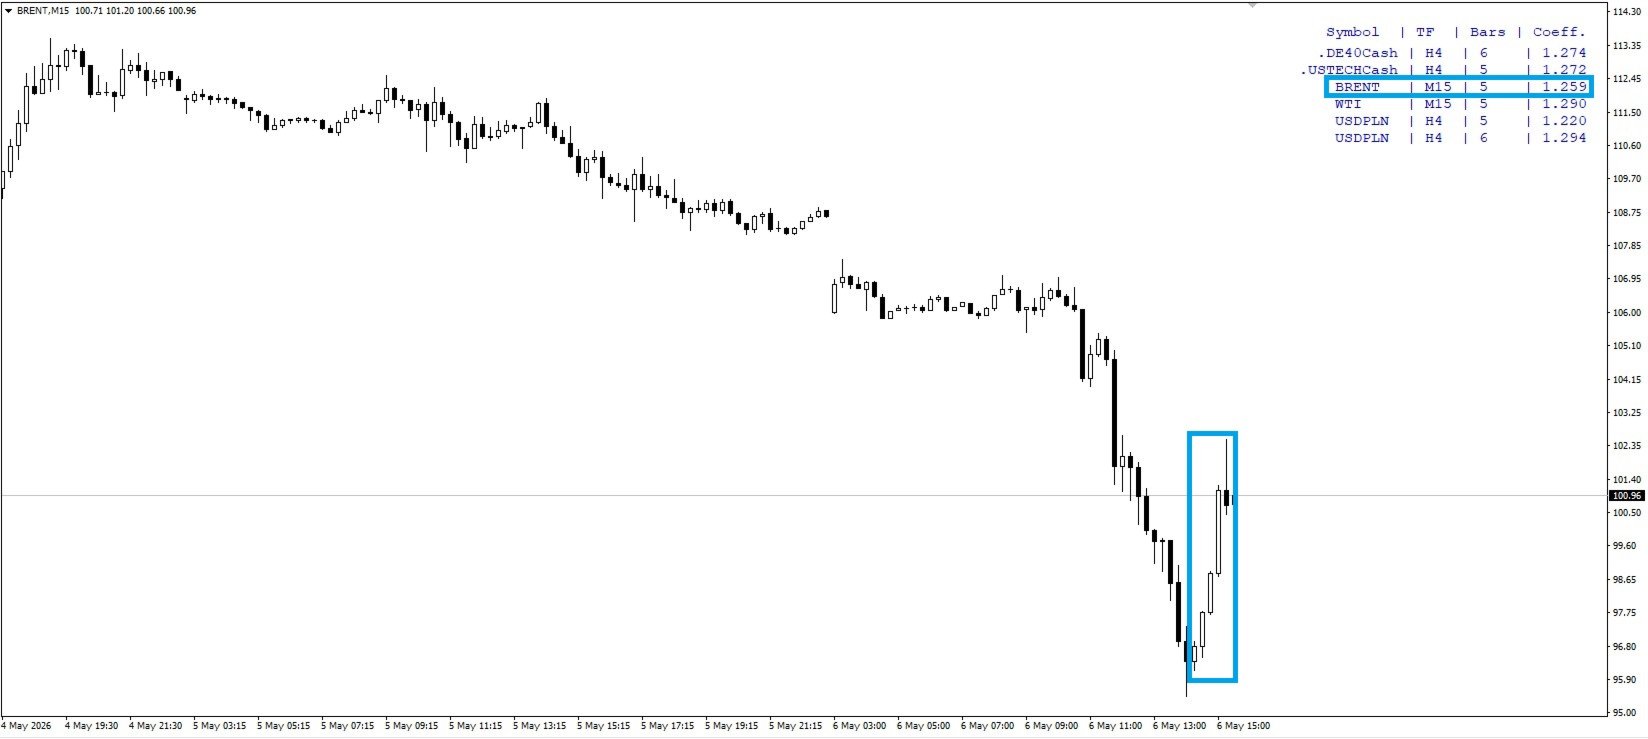
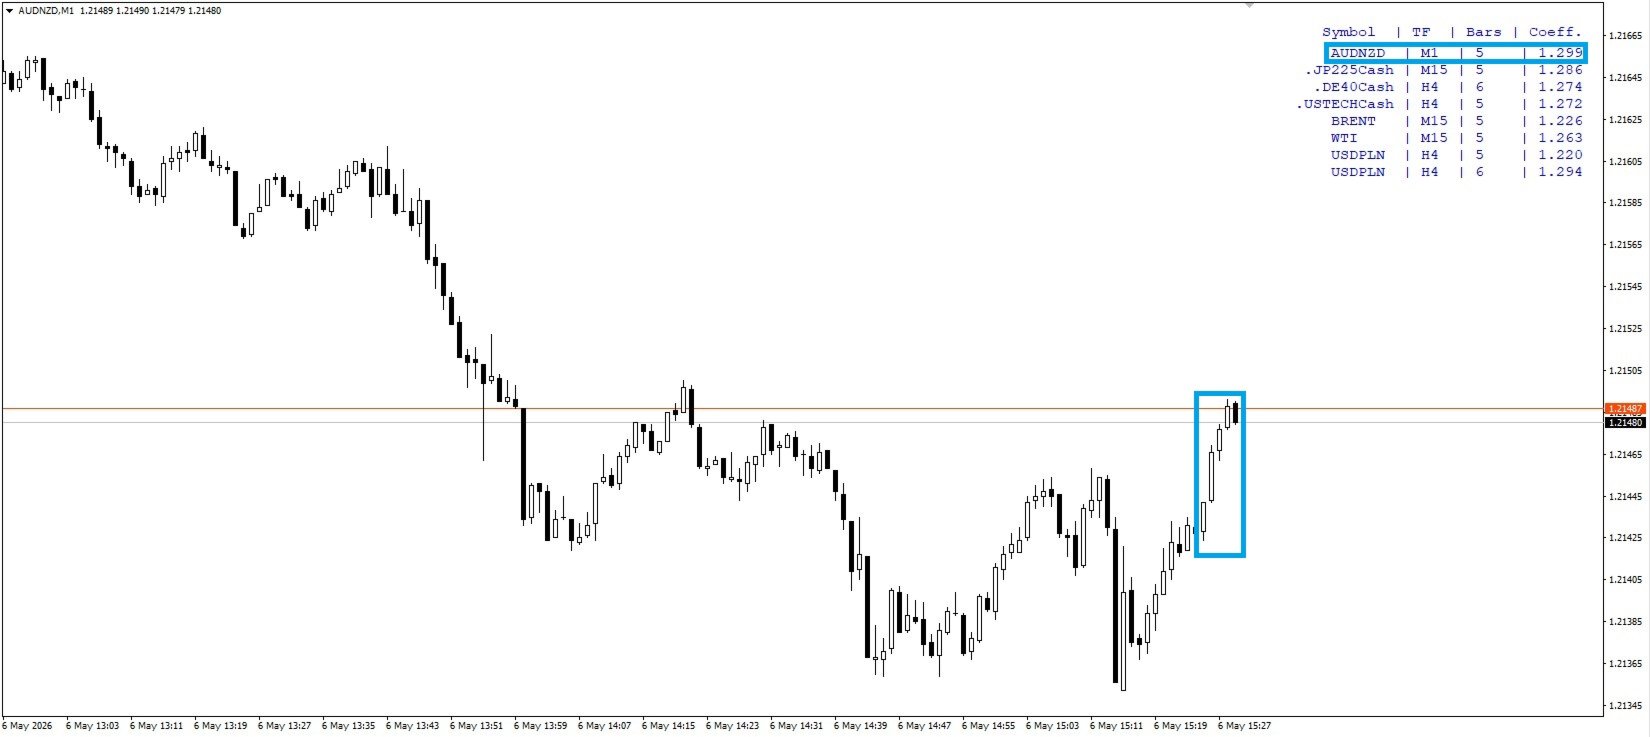
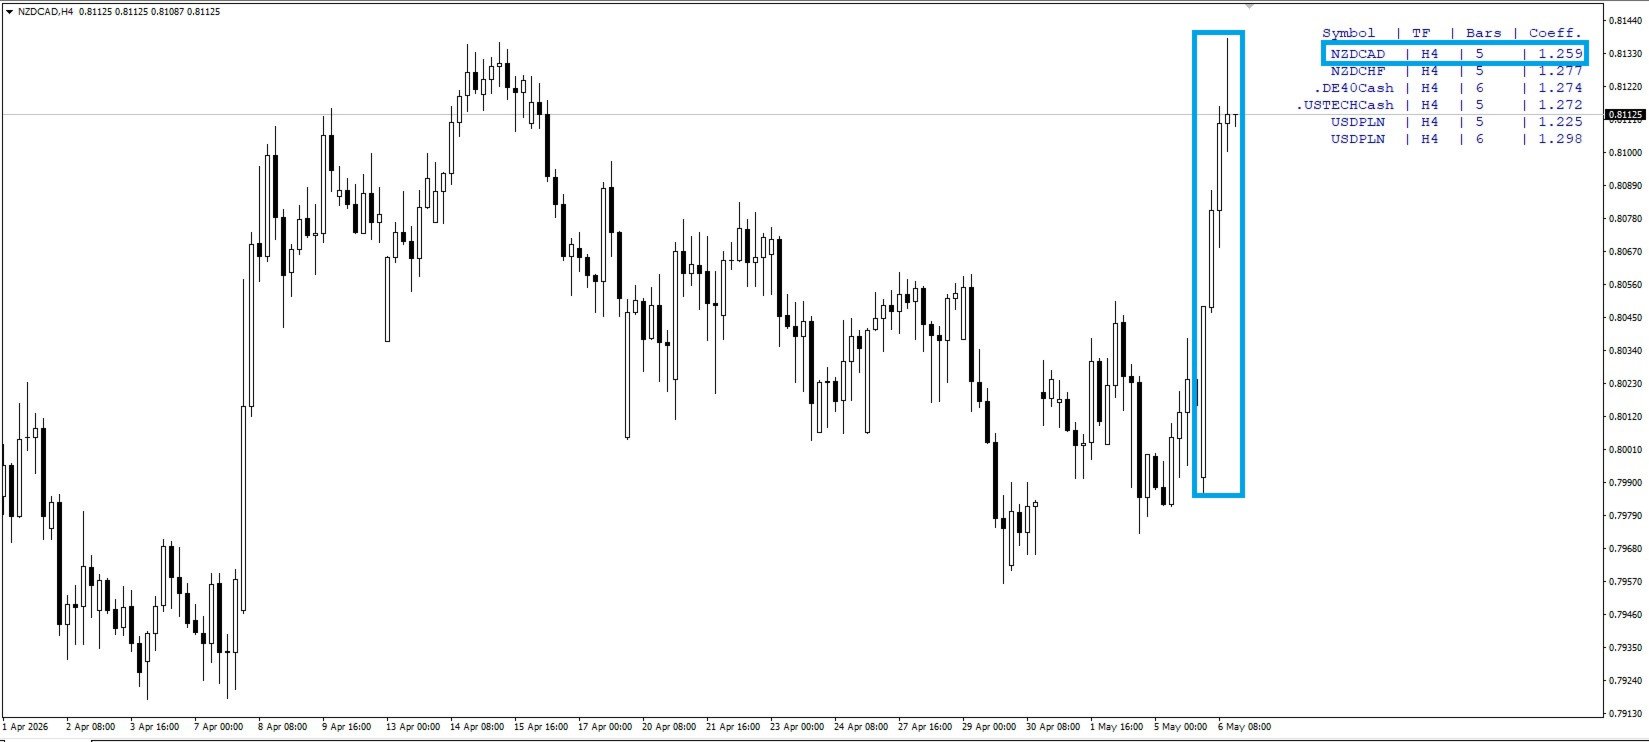
Markets don't tend to move for long in tight, taut-rope-like ranges. They require corrections. When a prolonged, uncorrected movement occurs, it's an anomaly that will soon end. There's a healthy ratio of channel length to width, and it's no more than 10 to 1. If this ratio increases, expect a very quick break in this "stretched rope." There's a coefficient that reflects how long a movement is and how long it's been without corrections. The closer the value is to 1, the more abnormal the market's condition, and a break will soon occur, bringing the trend's length to width ratio back to normal.
Settings:
The screen's information panel displays symbols and timeframes that meet search criteria, the most important of which is the threshold coefficient, which will select symbols whose movements do not exceed the threshold set by this coefficient. Moreover, the same instrument can appear multiple times simultaneously, as it will satisfy the filter conditions in several candlestick series at once. This indicator is valuable because it allows you to quickly see a multitude of potential developing situations (more than 30 symbols x 9 timeframes), which is at least 270 charts of different timeframes in a single information panel.