BELevelsPro
- インディケータ
-
Mikhail Tcvetkov
 Меня всегда можно найти в телеграмм по нику @mike0023.
Я торгую тут https://clck.ru/364XN8
и тут https://clck.ru/364XR3 - バージョン: 2.12
- アクティベーション: 5
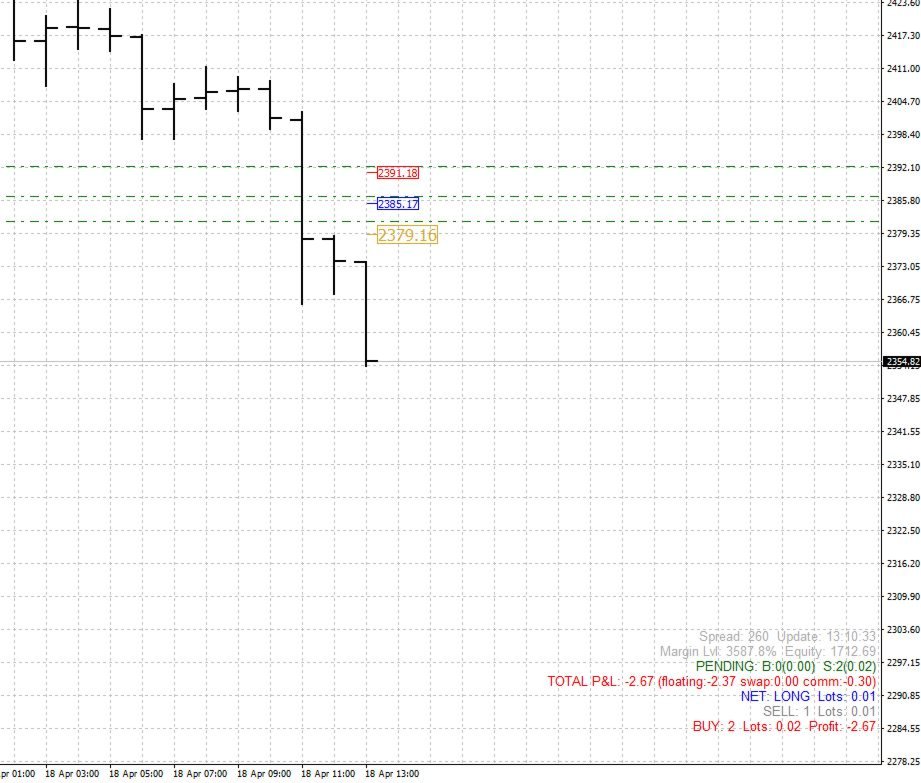
BELevelsPro indicator – visualization of break-even levels of positions
The indicator displays the break-even (BE) prices for your positions on the chart, taking into account accumulated swaps and commissions. It also shows the average prices of pending orders and an information panel with detailed statistics.
, What is displayed on the chart:
The blue mark is the price at which all BUY positions will go to zero (including swaps and commissions)
The red mark is the price at which all SELL positions will go to zero.
🟡 Golden mark - total break-even for all positions (net position). If the buy and sell lots are equal (full hedge), mark the current price.
DarkGreen Green label Weighted average price of pending orders (limit/stop)
All prices take into account accumulated swaps and commissions if the corresponding options are enabled.
🔹 Information panel (lower right corner)
The panel contains 7 lines (the distance between them is adjustable):
BUY – quantity, total lot, current profit on buy-positions.
SELL – quantity and total lot.
NET – the direction of the net position (LONG / SHORT /NEUTRAL) and the net lot.
TOTAL P&L – total profit/loss divided into floating parts, swaps and commissions.
PENDING – the number and lots of pending orders (by direction).
Margin Lvl – margin level (in %) and current Equity.
Spread – the current spread, the time of the last update.