Breakout Architect
- インディケータ
- バージョン: 6.0
- アクティベーション: 5
高確率トレーディング向けレンジブレイクアウトインジケーター
🎯 BREAKOUT ARCHITECT とは?
Breakout Architect は、MetaTrader 5 用に特別に開発された高度なインジケーターであり、外国為替市場での高品質なレンジブレイクアウトを特定し、トレードするために設計されています。このシステムは自動的にマスターキャンドル——各機関投資家向けセッションを開始する1時間足キャンドル——を識別し、その高値と安値に基づいてレンジボックスを構築し、専門的な検証基準でそのボックスをブレイクする際に確認済みのエントリーシグナルを生成します。
このインジケーターは予測しません。確認し、検証する実際の市場動向を定量的な手法で行います。
⭐ 主な利点
1. 自動化された確認済みトレーディング
- インジケーターはテクニカル分析の95%をあなたの代わりに実行
- 明確なシグナル、強気または弱気、正確なエントリー価格を生成
- 自動検証チェックリスト:すべての基準が緑の場合のみトレード
2. 統合されたリスク管理
- ストップロス(SL)はボックスの端で自動的に計算される
- 最大5つの設定可能なテイクプロフィット(TP)レベル
- 事前設定および最適化されたリスク:リワード比率
- 数学的検証により感情的なエントリーを防止
3. 完全な運用の自由度
- マルチチャネルアラート(ポップアップ、サウンド、スマートフォンへのプッシュ通知)
- 画面から離れていてもリアルタイムでシグナルを受信
- どこからでもトレード可能:スマートフォンと MetaTrader 5 があれば OK
4. 最大限の多用途性
- すべての外国為替通貨ペアで機能
- すべてのタイムフレーム(M1、M5、H1 など)に対応。分析は H1 ベース
- 複数のトレーディングセッション:ロンドン、ニューヨーク、東京、シドニーなど
- すべてのブローカー(Exness、XM、ICMarkets など)に対応
5. 完全なストラテジーコントロール
- すべてのパラメーターが100%カスタマイズ可能
- アグレッシブレベル、トレーディングウィンドウ、利益目標を調整
- 保守的なトレーダーと積極的なトレーダーの両方に理想的
6. 機関投資家向けグレードのシグナル品質
- マスターキャンドル動作に基づく(流動性セッションに関連)
- パーセンテージ確認:動きに「確信」がある場合のみ有効なブレイク
- 統合ニューズディテクター:高インパクトイベントを自動回避
🛠️ 入力パラメーター — 完全なリスト
セッションおよびタイムフレームパラメーター
| パラメーター | デフォルト値 | 範囲 | 説明 |
|---|---|---|---|
| HoraObjetivo | 10 | 0–23 | マスターキャンドルが開始するサーバー時間(ブローカーの GMT/UTC)。Exness のロンドンセッション(10:00)用にデフォルト最適化。 |
| DuracionHoras | 8 | 4–12 | マスターキャンドルからトレーディングウィンドウがアクティブなままである時間数。デフォルトはロンドン~ニューヨーク間をカバー。 |
ブレイクアウト確認パラメーター
| パラメーター | デフォルト値 | 範囲 | 説明 |
|---|---|---|---|
| PorcentajeConfirmacion | 20% | 0–40% | ブレイクアウトを検証するために価格が超える必要があるレンジの割合。20% = 推奨される標準モード。高ボラティリティ時に増加。 |
| PorcentajeSL | 0.0 | 0–10 | ボックスの端を超える追加のストップロス余裕。0 = 正確な端(より良い R:R)。価格が端を「スイープ」する場合は増加。 |
テイクプロフィットパラメーター
| パラメーター | デフォルト値 | 説明 |
|---|---|---|
| MultiplicadorTP1 | 1.0 | TP1 はボックスレンジの 1 倍(最小目標、部分確定) |
| MultiplicadorTP2 | 2.0 | TP2 はレンジの 2 倍(中程度のスウィング) |
| MultiplicadorTP3 | 3.0 | TP3 はレンジの 3 倍(広いスウィング) |
| MultiplicadorTP4 | 4.0 | TP4 はレンジの 4 倍(強いトレンド) |
| MultiplicadorTP5 | 5.0 | TP5 はレンジの 5 倍(最大トレンドポテンシャル) |
品質フィルターとインテリジェンス
| パラメーター | デフォルト値 | 説明 |
|---|---|---|
| HorasAvisoAmarillo | 4 時間 | これらの時間がブレイクなしで経過した場合、ボックスは黄色に変わります(横ばい警告)。 |
| HorasAvisoRojo | 8 時間 | これらの時間がブレイクなしで経過した場合、ボックスは赤に変わります(トレードしない、横ばいセッション)。 |
| HorasRevisionNoticias | 4 時間 | 高インパクトニューズディテクターの将来スキャン範囲。 |
アラートと通知パラメーター
| パラメーター | デフォルト値 | 説明 |
|---|---|---|
| MostrarAlertasPopup | 有効 | 各イベントの MetaTrader 5 ポップアップウィンドウ。 |
| ReproducirSonido | 有効 | 新しいシグナル、TP、SL タッチのアラート音。 |
| EnviarNotificacionPush | 有効 | MetaTrader 5 経由のスマートフォンへのプッシュ通知(MetaQuotes ID が必要)。 |
📊 独特なテクニカル機能
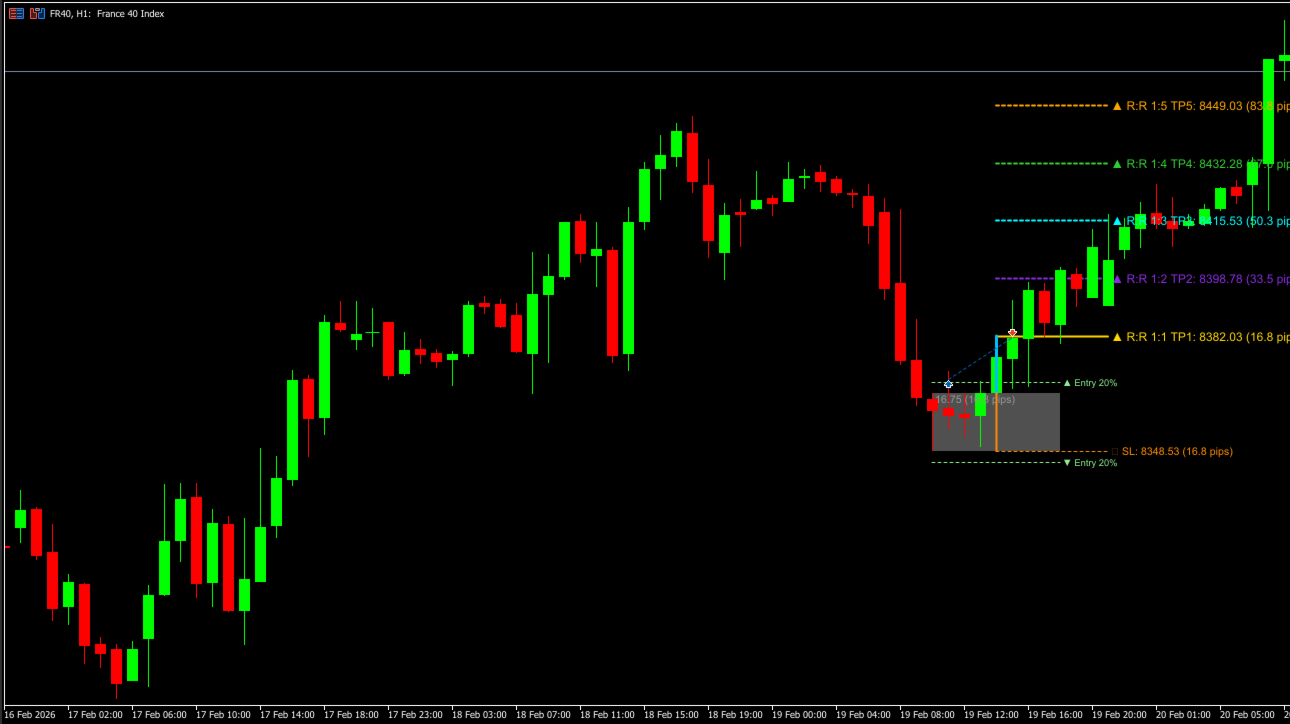
✅ プロフェッショナルコントロールパネル — 一元化された情報:マスターキャンドル、レンジボックス、エントリー価格、SL、5 つの TP、ピップス確認、ニューズディテクターステータス。
✅ スマートエントリーチェックリスト — 6 個以上の品質条件を自動検証。すべてが緑の場合のみポジションをオープン。
✅ クリアなチャートライン — レンジボックス(灰色)、エントリーライン(点線)、SL と TP レベル(カラー)がリアルタイムで表示。
✅ 完全なシグナル履歴 — すべてのトレード、確認、結果、統計を記録。
✅ マルチペア互換 — 複数のペアを同時にモニタリング、相互干渉なし。
✅ 統合ニューズディテクター — トレードに影響を与える可能性のある重要な経済イベントを警告。
✅ Exness 向けに最適化 — 推奨ブローカーで広くテスト済み。追加調整不要。
💼 誰向けか?
- 初心者トレーダー: 初日から規律あるトレーディングを教える完全なシステム
- 中級トレーダー: 時間と感情を節約する分析自動化
- プロトレーダー: 完全なコントロール可能な確認とリスク管理ツール
- 忙しいオペレーター: 画面に縛られずにトレード可能
- 保守的なトレーダー: 穏やかなセッション向けの調整可能な品質フィルター
- 積極的なトレーダー: 最小確認モード(0%)で最大シグナル頻度
🚀 結果
Breakout Architect はテクニカル分析の不確実性を排除します。 以下を提供します:
✨ 数学的に検証されたシグナル
✨ 自動リスク管理
✨ 運用の自由度(スマートフォン + 通知)
✨ 完全なストラテジーコントロール
✨ 保証された一貫性と規律


Purchased this indicator a few days ago and now the indicator isn't working. I've contacted the seller and haven't received no support