Breakout Architect

BREAKOUT ARCHITECT

The Range Breakout Indicator for High-Probability Trading

🎯 WHAT IS BREAKOUT ARCHITECT?

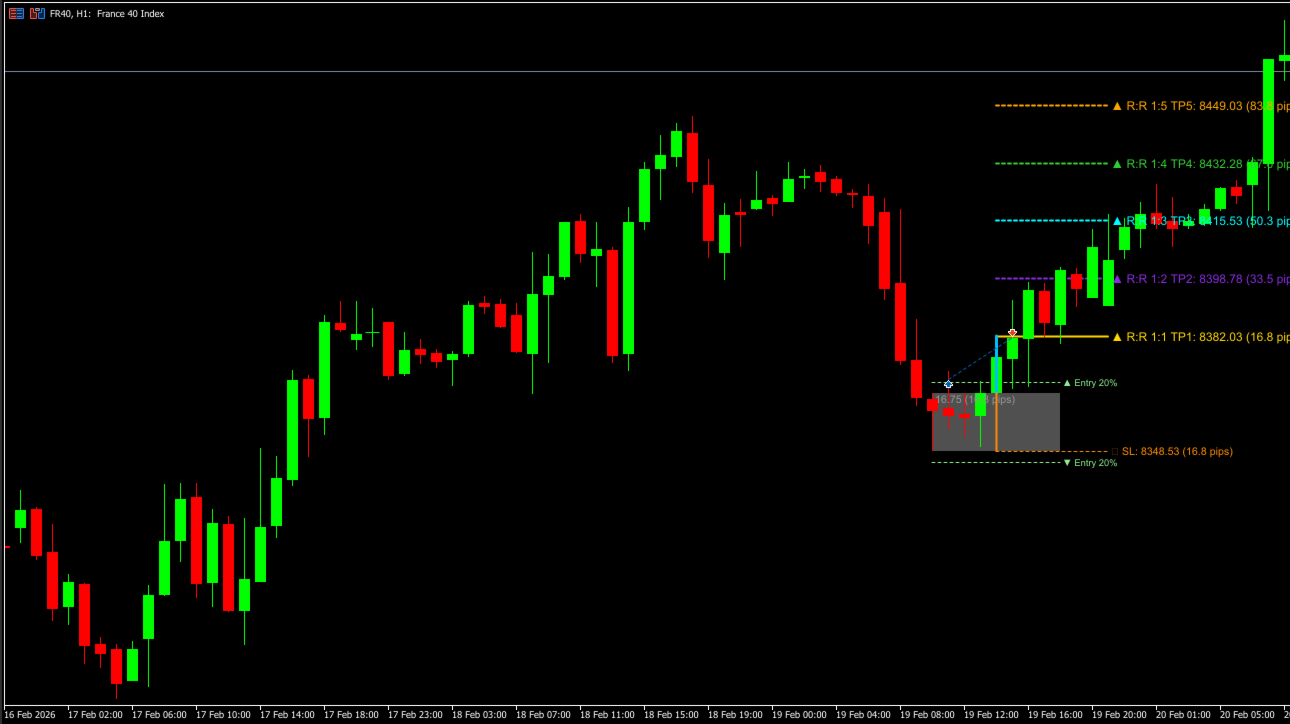
Breakout Architect is an advanced indicator for MetaTrader 5 specifically designed to identify and trade high-quality range breakouts in the Forex market. The system automatically identifies the master candle —the 1-hour candle that opens each institutional session— builds a range box based on its high and low, and generates confirmed entry signals when price breaks that box with professional validation criteria.

The indicator does not predict; it confirms and validates real market movements with quantifiable methodology.

 MAIN ADVANTAGES

1. Automated and Confirmed Trading

  • The indicator performs 95% of technical analysis for you
  • Generates clear signals, bullish or bearish, with exact entry price
  • Automated validation checklist: only trade when ALL criteria are green

2. Integrated Risk Management

  • Stop Loss (SL) automatically calculated at the box edge
  • Up to 5 Take Profit (TP) levels with configurable multiple objectives
  • Predetermined and optimized Risk:Reward ratio
  • Prevents emotional entries with mathematical validation

3. Complete Operational Freedom

  • Multi-channel alerts (popup, sound, push notifications to mobile)
  • Receive signals in real-time even when you're away from the screen
  • Trade from anywhere: all you need is your smartphone and MetaTrader 5

4. Maximum Versatility

  • Works with any Forex currency pair
  • Compatible with any timeframe (M1, M5, H1, etc.), though analysis is based on H1
  • Multiple trading sessions: London, New York, Tokyo, Sydney, etc.
  • Adapts to any broker (Exness, XM, ICMarkets, etc.)

5. Full Strategy Control

  • All parameters are 100% customizable
  • Adjust aggressiveness, trading window, and profit targets
  • Ideal for both conservative and aggressive traders

6. Institutional-Grade Signal Quality

  • Based on master candle behavior (associated with liquidity sessions)
  • Percentage confirmation: only valid breakout if the move has "conviction"
  • Integrated news detector: automatically avoids high-impact events

🛠️ INPUT PARAMETERS — COMPLETE LIST

Session and Timeframe Parameters

Parameter Default Range Description
HoraObjetivo 10 0–23 Server hour (GMT/UTC of broker) when the master candle begins. Default optimized for London session (10:00 on Exness).
DuracionHoras 8 4–12 Number of hours the trading window remains active from the master candle. Default covers London to New York.

Breakout Confirmation Parameters

Parameter Default Range Description
PorcentajeConfirmacion 20% 0–40% Percentage of the range that price must exceed to validate the breakout. 20% = recommended standard mode. Increase in high volatility.
PorcentajeSL 0.0 0–10 Additional Stop Loss margin beyond the box edge. 0 = exact edge (better R:R). Increase if price "sweeps" edges.

Take Profit Parameters

Parameter Default Description
MultiplicadorTP1 1.0 TP1 at 1x the box range (minimum target, take partials)
MultiplicadorTP2 2.0 TP2 at 2x the range (moderate swing)
MultiplicadorTP3 3.0 TP3 at 3x the range (wide swing)
MultiplicadorTP4 4.0 TP4 at 4x the range (strong trend)
MultiplicadorTP5 5.0 TP5 at 5x the range (maximum trend potential)

Quality Filters and Intelligence

Parameter Default Description
HorasAvisoAmarillo 4 hours If these hours pass without breakout, box turns yellow (laterality warning).
HorasAvisoRojo 8 hours If these hours pass without breakout, box turns red (don't trade, sideways session).
HorasRevisionNoticias 4 hours Future scan range for high-impact news detector.

Alert and Notification Parameters

Parameter Default Description
MostrarAlertasPopup Enabled Pop-up windows in MetaTrader 5 for each event.
ReproducirSonido Enabled Alert sound for new signal, TPs, and SL touched.
EnviarNotificacionPush Enabled Push notifications to mobile via MetaTrader 5 (requires MetaQuotes ID).

📊 DISTINCTIVE TECHNICAL FEATURES

Professional Control Panel — Centralized information: master candle, range box, entry price, SL, 5 TPs, confirmation in pips, news detector status.

Smart Entry Checklist — Automatically verifies 6+ quality conditions. Only open position when EVERYTHING is green.

Clear Chart Lines — Range box (gray), entry lines (dotted), SL and TP levels (colored) visible in real-time.

Complete Signal History — All trades of the day recorded with confirmation, result, and statistics.

Multi-Pair Compatible — Monitor multiple pairs simultaneously without interference.

Integrated News Detector — Warns of important economic events that could affect the trade.

Optimized for Exness — Extensively tested on the recommended broker. No additional adjustments required.

💼 WHO IS IT FOR?

  • Beginner traders: Complete system teaching disciplined trading from day one
  • Intermediate traders: Analysis automation to save time and emotion
  • Professional traders: Confirmation and risk management tool with full control
  • Busy operators: Freedom to trade without being glued to the screen
  • Conservative traders: Adjustable quality filters for calm sessions
  • Aggressive traders: Minimum confirmation mode (0%) for maximum signal frequency

🚀 THE RESULT

Breakout Architect eliminates the uncertainty of technical analysis. It provides you with:

✨ Mathematically validated signals
✨ Automatic risk management
✨ Operational freedom (smartphone + notifications)
✨ Full strategy control
✨ Guaranteed consistency and discipline


추천 제품
RBreaker
Zhong Long Wu
RBreaker Gold Indicators는 금 선물을 위한 단기 데이 트레이딩 전략으로, 추세 추종과 데이 내 반전의 두 가지 거래 방식을 결합합니다. 추세 장에서 수익을 포착할 수 있을 뿐만 아니라, 시장이 반전될 때 적시에 이익을 확정하고 추세에 맞춰 반대 포지션을 잡을 수 있습니다. 이 전략은 미국 잡지 Futures Truth에서 15년 연속으로 가장 수익성 높은 트레이딩 전략 상위 10위 안에 선정되었습니다. 긴 라이프사이클을 자랑하며, 현재까지 국내외에서 널리 사용되고 연구되고 있습니다. 본 지표는 2026년 금 선물의 움직임을 반영하여 14일 ATR 지표를 기반으로 돌파 계수 A, 관찰 계수 B, 반전 계수 R을 보다 합리적인 값으로 정의했습니다. 매우 훌륭한 지표이며, 안정적인 연간 수익성을 달성했습니다. 강력히 추천합니다~ 위 지표는 변동성이 높은 상품에 적합하며, 매개변수는 금 선물, 주가 지수 선물 등에 적합합니다. 다른 상품이 필요한 경우 돌파 계수 A
Follow The Line MT5
Oliver Gideon Amofa Appiah
4.6 (35)
This indicator obeys the popular maxim that: "THE TREND IS YOUR FRIEND" It paints a GREEN line for BUY and also paints a RED line for SELL. (you can change the colors). It gives alarms and alerts of all kinds. IT DOES NOT REPAINT and can be used for all currency pairs and timeframes. Yes, as easy and simple as that. Even a newbie can use it to make great and reliable trades. NB: For best results, get my other premium indicators for more powerful and reliable signals. Get them here: https://www.m
FREE
Price Magnet — Price Density and Attraction Levels Indicator Price Magnet is a professional analytical tool designed to identify key support and resistance levels based on statistical Price Density. The indicator analyzes a specified historical period and detects price levels where the market spent the most time. These zones act as “magnets,” attracting price action or forming a structural base for potential reversals. Unlike traditional Volume Profile tools, Price Magnet focuses on price-time d
Donchian Breakout And Rsi
Mattia Impicciatore
4.5 (2)
개요 이 지표는 클래식 돈치안 채널(Donchian Channel) 의 향상된 버전으로, 실전 트레이딩을 위한 다양한 기능이 추가되었습니다. 표준 세 개의 선(상단, 하단, 중앙선) 외에도 브레이크아웃 을 감지하여 차트에 화살표로 시각적으로 표시하며, 차트를 깔끔하게 보기 위해 현재 추세 방향의 반대 라인만 표시 합니다. 지표 기능: 시각적 신호 : 브레이크아웃 시 컬러 화살표 표시 자동 알림 : 팝업, 푸시 알림, 이메일 RSI 필터 : 시장의 상대 강도를 기반으로 신호 검증 사용자 맞춤 설정 : 색상, 선 두께, 화살표 코드, RSI 임계값 등 동작 원리 돈치안 채널은 다음을 계산합니다: 상단선 : 최근 N개의 종가 완료 캔들에서 가장 높은 고가 하단선 : 최근 N개의 종가 완료 캔들에서 가장 낮은 저가 중앙선 : 고가와 저가의 평균값 상방 브레이크아웃 은 종가가 상단선을 돌파할 때 발생하며, 하방 브레이크아웃 은 종가가 하단선 아래로 내려갈 때 발생합니다. 이 지표는: 세 개의
FREE
CosmiCLab FIBO
Kirils Subins
CosmiCLab SMC FIBO CosmiCLab SMC FIBO is a professional trading indicator designed for traders who use Smart Money Concepts (SMC), market structure analysis and Fibonacci retracement levels. The indicator automatically detects market swings and builds Fibonacci levels based on the latest impulse movement. It also identifies market structure changes such as BOS (Break of Structure) and CHOCH (Change of Character), helping traders understand the current market direction. CosmiCLab SMC FIBO also pr
Maximum Trend Arrows OT MT5
Mulweli Valdaz Makulana
STRICTLY FOR BOOM INDEX ONLY!!!!! Here I bring the Maximum Trend Arrows OT1.0 MT5 indicator. This indicator is made up of a combination of different trend indicators for entries and exits, for entries an orange arrow will paint on the chart below the current market and a red flag for closing of trades and it produces buy arrows only. When the orange arrow appears, it will appear along with it's sound to notify you. The 1H timeframe is recommended, don't use it anywhere else than on the 1H timefr
Tops and Bottoms Indicator
Josue De Matos Silva
4.6 (5)
Tops & Bottoms Indicator FREE   Tops abd Bottoms:   An effective indicator for your trades The tops and bottoms indicator helps you to find  ascending and descending channel formations with indications of ascending and/or descending tops and bottoms. In addition, it  show possibles  opportunities with a small yellow circle when the indicator encounters an impulse formation. This indicator provide to you  more security and speed in making entry decisions. Also test our FREE advisor indicator:  
FREE
Caicai L&S Yield Histogram Important Notice: This indicator is an integral tool of the automated EA Caicai Long and Short Pair Trading . This indicator visually displays the percentage deviation (Yield %) of a pair's current spread relative to its own historical mean. It is an excellent tool for quickly visualizing the gross financial potential of a market distortion in Long & Short operations. Main Features: Percentage Visualization: Understand the size of the distortion in palpable percentage
True Day
Aurthur Musendame
5 (1)
True Days is a tool designed specifically for the trader who wants to catch intraday volatility in price charts.  True day makes it easier for the trader to avoid trading in the dead zone - a period in time where markets are considered dead or non volatile. The trader can concentrate on finding opportunities only during periods of profound market movements. By default the indicator gives you a true day starting at 02:00 to 19:00 hours GMT+2. You can adjust according to your Time Zone. By deafult
FREE
Prime Power ML
Artem Koliada
Prime Power ML 은 신호를 표시하기 전에 승률로 필터링하는 두 개의 ONNX 신경망 모델이 내장된 고급 Currency Strength Meter입니다. 통화 간의 모든 괴리를 표시하는 기존 CSM 지표와 달리, Prime Power ML은 AI가 통계적 우위를 확인한 신호만 강조 표시합니다. 작동 방식 이 지표는 28개 통화 쌍 전체에 걸친 RSI 스코어링을 사용하여 8개 주요 통화(USD, EUR, GBP, JPY, AUD, CAD, CHF, NZD)의 강도를 실시간으로 계산합니다. 두 통화 간에 강도 괴리가 나타나면 내장 AI 모델이 14개 시장 특성을 평가하고 신호에 Win Probability(0-100%) 점수를 부여합니다. 최소 임계값을 충족하는 신호만 AI TOP SIGNALS 로 표시됩니다 — 신뢰도 순으로 정렬된 현재 차트의 최고 2개 기회입니다. 두 개의 AI 모델 — 타임프레임에 맞춘 선택 모드 타임프레임 학습 데이터 Win Rate (out-of-s
Mitimom
Danil Poletavkin
The indicator is based on Robert Miner's methodology described in his book "High probability trading strategies" and displays signals along with momentum of 2 timeframes. A Stochastic oscillator is used as a momentum indicator. The settings speak for themselves period_1 is the current timeframe, 'current' period_2 is indicated - the senior timeframe is 4 or 5 times larger than the current one. For example, if the current one is 5 minutes, then the older one will be 20 minutes The rest of the s
FREE
Visual Range Directional Force Indicator
AL MOOSAWI ABDULLAH JAFFER BAQER
Range Directional Force Indicator – Designed for You to Optimize! The Range Directional Force Indicator is a cutting-edge tool designed to empower traders by visualizing market dynamics and directional strength. Built to offer insights into market trends and reversals, this indicator is an invaluable asset for traders seeking precision in their strategies. However, it is important to note that this indicator is not optimized, leaving room for you to tailor it to your unique trading preferences.
Universal Trend
Maryna Shulzhenko
The Universal Trend indicator was created to detect trends in price movement and allows you to quickly determine not only the direction of the trend, but also understand the levels of interaction between buyers and sellers. The indicator works on all timeframes and currency pairs. The indicator gives fairly accurate signals and it is customary to use it both in trending and flat markets. It is advisable to use the indicator in combination with other tools for more reliable signals and making a
High Low Open Close
Alexandre Borela
4.98 (44)
이 프로젝트를 좋아한다면 5 스타 리뷰를 남겨주세요. 이 지표는 열리고, 높은, 낮은 및 마감 가격을 지정합니다. 기간과 그것은 특정한 시간대를 위해 조정될 수 있습니다. 이들은 많은 기관 및 전문가에 의해 보는 중요한 수준입니다 상인은 당신이 더 많은 것일 수있는 장소를 알고 도움이 될 수 있습니다 이름 * 사용 가능한 기간: 이전 날. 이전 주. 지난 달. 이전 분기. 이전 연도. 또는: 현재 날. 현재 주. 현재 달. 현재 분기. 현재 년.
FREE
"Adjustable Fractals"는 프랙탈 지표의 고급 버전으로, 매우 유용한 거래 도구입니다! .................................................................................................................. - 알다시피 표준 프랙탈 MT5  지표에는 설정이 전혀 없습니다. 이는 거래자에게 매우 불편합니다. - Adjustable Fractals는 이 문제를 해결했습니다. 필요한 모든 설정이 있습니다. - 지표의 조정 가능한 기간(권장 값 - 7 이상). - 가격의 고점/저점으로부터 조정 가능한 거리. - 프랙탈 화살표의 조정 가능한 디자인. - 표시기에는 모바일 및 PC 알림 기능이 내장되어 있습니다. 여기를 클릭하여 고품질 트레이딩 로봇과 지표를 확인하세요! 이 MQL5 웹사이트에서만 제공되는 오리지널 제품입니다.
MACD Enhanced
Nikita Berdnikov
5 (3)
Introducing the MACD  Enhanced – an advanced MACD (Moving Average Convergence Divergence) indicator that provides traders with extended capabilities for trend and momentum analysis in financial markets. The indicator uses the difference between the fast and slow exponential moving averages to determine momentum, direction, and strength of the trend, creating clear visual signals for potential entry and exit points. Attention! To achieve the best results, it is recommended to adapt the indicator
FREE
Donchian Channel DC
Renato Takahashi
Donchian Channel DC is the indicator of Donchian Channels, that plots maximum and minimum values of a specific period, besides mean value line. It´s possible to configure simple period for analysis and the indicator will plot all three values. You can trade with this indicator as trend or reversal, according to each strategy. Do not let to test others indicators as soon as others expert advisors.
Girassol Sunflower MT5 Indicator
Saullo De Oliveira Pacheco
3.86 (7)
This is the famous Sunflower indicator for Metatrader5. This indicator marks possible tops and bottoms on price charts. The indicator identifies tops and bottoms in the asset's price history, keep in mind that the current sunflower of the last candle repaints, as it is not possible to identify a top until the market reverses and it is also not possible to identify a bottom without the market stop falling and start rising. If you are looking for a professional programmer for Metatrader5, please
FREE
Half ma
Artem Svistunov
The Half ma arrow indicator for the MetaTrader 5 trading terminal is a simple but effective tool that gives a signal about a change in the current trend. The Half ma indicator looks like a solid dynamic line that changes color at the points where the trend changes. At these points, the indicator draws arrows of the corresponding color and direction.The Half ma arrow indicator for the MT5 terminal is not an independent source of input signals. It will be most effective to use it as a trend filte
Reversal Candles MT5
Nguyen Thanh Cong
4.86 (7)
Introduction Reversal Candles is a cutting-edge non-repainting   forex indicator designed to predict price reversals with remarkable accuracy through a sophisticated combination of signals. Signal Buy when the last closed candle has a darker color (customizable) and an up arrow is painted below it Sell when the last closed candle has a darker color (customizable) and a down arrow is painted above it
FREE
Renko System
Marco Montemari
This indicator can be considered as a trading system. It offers a different view to see the currency pair: full timeless indicator, can be used for manual trading or for automatized trading with some expert advisor. When the price reaches a threshold a new block is created according to the set mode. The indicator beside the Renko bars, shows also 3 moving averages. Features renko mode median renko custom median renko 3 moving averages wicks datetime indicator for each block custom notification
SMC Buy Sell Indicator SMC Buy Sell Indicator is a price action-based trading tool designed to identify market structure using Smart Money Concepts. It focuses on detecting meaningful swing points, structural breaks, and confirmation signals directly from chart data. The indicator operates using closed candle data and does not rely on future bars. All calculations are performed on confirmed price action, which helps maintain consistent and stable signals. Key Features Market Structure Detection
Antique Trend
Nadiya Mirosh
The Antique Trend Indicator is a revolutionary trend trading and filtering solution with all the important features of a trend tool built into one tool! The Antique Trend indicator is good for any trader, suitable for any trader both for Forex and binary options. There is no need to configure anything, everything has been perfected by time and experience, it works great during flats and trends. The Antique Trend indicator is a tool for technical analysis of financial markets, reflecting curren
Statistical Arbitrage Spread Generator for Cointegration [MT5] What is Pair Trading? Pair trading is a market-neutral strategy that looks to exploit the relative price movement between two correlated assets — instead of betting on the direction of the market. The idea? When two assets that usually move together diverge beyond a statistically significant threshold, one is likely mispriced. You sell the expensive one, buy the cheap one , and profit when they converge again. It’s a statistica
FREE
Free automatic Fibonacci is an indicator that automatically plots a Fibonacci retracement based on the number of bars you select on the BarsToScan setting in the indicator. The Fibonacci is automatically updated in real time as new highest and lowest values appears amongst the selected bars. You can select which level values to be displayed in the indicator settings. You can also select the color of the levels thus enabling the trader to be able to attach the indicator several times with differe
FREE
Fibaction
Abdelkhalek Orabi
Indicator Name: Fibaction – price action candle Detector Description: Fibo Signal Boxes is a powerful Smart Money Concept (SMC)-inspired indicator that auto-detects price action candles. bullish hammers and shooting stars, then draws precise Fibonacci entry zones and multiple take-profit levels directly on the chart. as for the SL personally i use 40 pips rules  Key Features: Detects bullish hammer and shooting star reversal candles. Automatically draws Fibonacci entry and TP boxes. as
Liquidity Oscillator
Paolo Scopazzo
3 (2)
A powerful oscillator that provide Buy and Sell signals by calculating the investor liquidity. The more liquidity the more buy possibilities. The less liquidity the more sell possibilities. Please download the demo and run a backtest! HOW IT WORKS: The oscillator will put buy and sell arrow on the chart in runtime only . Top value is 95 to 100 -> Investors are ready to buy and you should follow. Bottom value is 5 to 0 -> Investors are ready to sell and you should follow. Alert + sound will appe
Candle Countdown — MT5용 정확한 캔들 종료 시간 카운트다운 Candle Countdown은 차트 위에 현재 캔들이 종료될 때까지 남은 시간 을 표시하는 간단하고 정확한 도구입니다. 진입 시점이 캔들 마감에 의존하는 경우, 몇 초의 차이도 중요합니다. 이 인디케이터는 정확한 시간을 보여주어 서두르거나 추측하지 않고 결정을 내릴 수 있도록 도와줍니다. 캔들 종료 시간을 정확하게 제어하기 위한 인디케이터입니다. 표시 내용: 캔들 종료까지 남은 시간 현재 서버 시간 스프레드 Stop Level 타이머는 틱에 의존하지 않고 플랫폼의 내부 타이머를 통해 업데이트되므로, 시장 움직임이 적은 상황에서도 안정적으로 동작합니다. 이로 인해 낮은 변동성 구간에서도 부드럽고 안정적인 카운트다운을 제공합니다. 모든 정보는 배경 블록에 표시되어 어떤 차트 색상에서도 잘 보이며, 차트 분석을 방해하지 않습니다. 캔들 종료 시점이 가까워질수록 타이머 색상이 변경되어 빠르게 상황을 파악할 수
FREE
Noize Absorption Index
Ekaterina Saltykova
Noize Absorption Index - is the manual trading system that measures the difference of pressure between bears forces and bulls forces. Green line - is a noize free index that showing curent situation. Zero value of index shows totally choppy/flat market.Values above zero level shows how powerfull bullish wave is and values below zero measures bearish forces.Up arrow appears on bearish market when it's ready to reverse, dn arrow appears on weak bullish market, as a result of reverse expectation.
SMC Venom Model BPR 지표는 Smart Money(SMC) 개념 내에서 일하는 트레이더를 위한 전문 도구입니다. 가격 차트에서 두 가지 주요 패턴을 자동으로 식별합니다. FVG (공정 가치 갭)는 3개의 캔들의 조합으로, 첫 번째와 세 번째 캔들 사이에 갭이 있습니다. 이는 볼륨 지원이 없는 레벨 사이에 구역을 형성하여 종종 가격 수정으로 이어집니다. BPR (균형 가격 범위)은 두 개의 FVG 패턴의 조합으로, "브리지"를 형성합니다. 이는 가격이 낮은 볼륨 활동으로 움직일 때 브레이크아웃과 레벨로의 복귀 구역으로, 캔들 사이에 갭을 생성합니다. 이러한 패턴은 거래자가 차트에서 거래량과 가격 역학을 분석하여 주요 지지/저항 수준, 돌파 구역 및 진입 지점을 식별하는 데 도움이 되며, 여기서 대형 시장 참여자와 일반 참여자 간의 상호 작용이 발생합니다. 이 지표는 사각형과 화살표 형태로 패턴을 시각화하며 유연한 경고 설정도 지원합니다. 주요 특징: 패턴 표시 모드
이 제품의 구매자들이 또한 구매함
Divergence Bomber
Ihor Otkydach
4.9 (86)
이 지표를 구매하신 분께는 다음과 같은 혜택이 무료로 제공됩니다: 각 거래를 자동으로 관리하고, 손절/익절 수준을 설정하며, 전략 규칙에 따라 거래를 종료하는 전용 도우미 툴 "Bomber Utility" 다양한 자산에 맞게 지표를 설정할 수 있는 셋업 파일(Set Files) "최소 위험", "균형 잡힌 위험", "관망 전략" 모드로 설정 가능한 Bomber Utility의 셋업 파일 이 전략을 빠르게 설치, 설정, 시작할 수 있도록 돕는 단계별 영상 매뉴얼 주의: 위의 모든 보너스를 받기 위해서는 MQL5 개인 메시지 시스템을 통해 판매자에게 연락해 주세요. 독창적인 커스텀 지표인 “Divergence Bomber(다이버전스 봄버)”를 소개합니다. 이 지표는 MACD 다이버전스(괴리) 전략을 기반으로 한 올인원(All-in-One) 거래 시스템입니다. 이 기술 지표의 주요 목적은 가격과 MACD 지표 간의 다이버전스를 감지하고, **향후 가격이 어느 방향으로 움직일지를 알려주는
Azimuth Pro
Ottaviano De Cicco
5 (6)
Azimuth Pro V2: Synthetic Fractal Structure and Confirmed Entries for MT5 Overview Azimuth Pro is a multi-level swing structure indicator by Merkava Labs . Four nested swing layers, swing-anchored VWAP, ABC pattern detection, three-timeframe structural filtering, and closed-bar confirmed entries — one chart, one workflow from micro-swings to macro-cycles. This is not a blind signal product. It is a structure-first workflow for traders who care about location, context, and timing. V2 Launch Offe
Quantum TrendPulse
Bogdan Ion Puscasu
5 (23)
SuperTrend   ,   RSI   ,   Stochastic   의 힘을 하나의 포괄적인 지표로 결합하여 트레이딩 잠재력을 극대화하는 궁극의 트레이딩 도구   인 Quantum TrendPulse를   소개합니다. 정밀성과 효율성을 추구하는 트레이더를 위해 설계된 이 지표는 시장 추세, 모멘텀 변화, 최적의 진입 및 종료 지점을 자신 있게 식별하는 데 도움이 됩니다. 주요 특징: SuperTrend 통합:   주요 시장 추세를 쉽게 따라가고 수익성의 물결을 타세요. RSI 정밀도:   매수 과다 및 매도 과다 수준을 감지하여 시장 반전 시점을 파악하는 데 적합하며 SuperTrend 필터로 사용 가능 확률적 정확도:   변동성이 큰 시장에서 숨겨진 기회를 찾기 위해 확률적 진동   을 활용하고 SuperTrend의 필터로 사용 다중 시간대 분석:   M5부터 H1 또는 H4까지 다양한 시간대에 걸쳐 시장을 최신 상태로 유지하세요. 맞춤형 알림:   맞춤형 거래 조건이 충족되면
이 지표를 구매하면 제 프로페셔널 트레이드 매니저를 무료로 드립니다. 우선 이 거래 시스템이 리페인팅, 리드로잉 및 레이그 인디케이터가 아니라는 점을 강조하는 것이 중요합니다. 이는 수동 및 로봇 거래 모두에 이상적인 것으로 만듭니다. 온라인 강좌, 설명서 및 프리셋 다운로드. "스마트 트렌드 트레이딩 시스템 MT5"은 새로운 및 경험이 풍부한 트레이더를 위해 맞춤형으로 제작된 종합적인 거래 솔루션입니다. 10개 이상의 프리미엄 인디케이터를 결합하고 7개 이상의 견고한 거래 전략을 특징으로 하여 다양한 시장 조건에 대한 다목적 선택이 가능합니다. 트렌드 추종 전략: 효과적인 트렌드 추이를 타기 위한 정확한 진입 및 손절 관리를 제공합니다. 반전 전략: 잠재적인 트렌드 반전을 식별하여 트레이더가 범위 시장을 활용할 수 있게 합니다. 스캘핑 전략: 빠르고 정확한 데이 트레이딩 및 단기 거래를 위해 설계되었습니다. 안정성: 모든 인디케이터가 리페인팅, 리드로잉 및 레이그가 아니므로 신뢰
OmniSync Projection
Antonio-alin Teculescu
5 (1)
Chronos Fractal Engine is an innovative price projection indicator for MetaTrader 5, designed to transform your technical analysis by intelligently identifying and projecting historical price patterns. Built upon an advanced correlation algorithm and the fractal principles of the market, this powerful tool visualizes potential future price movements, giving you a unique edge in your trading decisions. What is Chronos Fractal Engine? At its core, the Chronos Fractal Engine employs a sophisticat
소개       Quantum Breakout PRO   , 브레이크아웃 존 거래 방식을 변화시키는 획기적인 MQL5 지표! 13년 이상의 거래 경험을 가진 숙련된 트레이더 팀이 개발한       퀀텀 브레이크아웃 PRO       혁신적이고 역동적인 브레이크아웃 존 전략으로 거래 여정을 새로운 차원으로 끌어올리도록 설계되었습니다. Quantum Breakout Indicator는 5개의 이익 목표 영역이 있는 브레이크아웃 영역의 신호 화살표와 브레이크아웃 상자를 기반으로 한 손절 제안을 제공합니다. 초보자 거래자와 전문 거래자 모두에게 적합합니다. Quantum EA 채널:       여기를 클릭하세요 중요한! 구매 후 설치 매뉴얼을 받으려면 개인 메시지를 보내주십시오. 추천: 기간: M15 통화쌍: GBPJPY, EURJPY, USDJPY,NZDUSD, XAUUSD 계정 유형: 스프레드가 매우 낮은 ECN, Raw 또는 Razor 브로커 시간: GMT +3 중개인 :
CGE Trading Suite
Carl Gustav Johan Ekstrom
5 (2)
Institutional-Grade Analytics for MT5 C GE Trading Suite delivers the analytical edge typically reserved for professional trading desks. The platform integrates a full suite of analytical tools into one seamless workflow: dynamic grid mapping, liquidity behavior analysis, ECM, trend lines, MIDAS, trade cycles, and directional channel projections. Together, these provide a unified view of market structure and momentum. Directional clarity is further enhanced by the capital flow index, which meas
Meridian Pro
Ottaviano De Cicco
5 (1)
Meridian Pro: Professional Multi-Timeframe Trend Matrix for MT5 Overview Meridian Pro is a multi-timeframe trend matrix by Merkava Labs that compresses directional state, strength, momentum condition and matrix agreement into one compact panel. One adaptive engine, applied consistently from M1 to W1. No per-symbol tuning. No indicator stacking. One structured readout across every asset and every timeframe. Launch Offer — Get Meridian Pro for USD 99 (introductory). Regular price: USD 149. 1. Why
Grabber System MT5
Ihor Otkydach
4.83 (23)
탁월한 기술적 지표인 Grabber를 소개합니다. 이 도구는 즉시 사용 가능한 “올인원(All-Inclusive)” 트레이딩 전략으로 작동합니다. 하나의 코드 안에 강력한 시장 기술 분석 도구, 매매 신호(화살표), 알림 기능, 푸시 알림이 통합되어 있습니다. 이 인디케이터를 구매하신 모든 분들께는 다음의 항목이 무료로 제공됩니다: Grabber 유틸리티: 오픈 포지션을 자동으로 관리하는 도구 단계별 영상 매뉴얼: 설치, 설정, 그리고 실제 거래 방법을 안내 맞춤형 세트 파일: 인디케이터를 빠르게 자동 설정하여 최고의 성과를 낼 수 있도록 도와줍니다 다른 전략은 이제 잊어버리세요! Grabber만이 여러분을 새로운 트레이딩의 정점으로 이끌어 줄 수 있습니다. Grabber 전략의 주요 특징: 거래 시간 프레임: M5부터 H4까지 거래 가능한 자산: 어떤 자산이든 사용 가능하지만, 제가 직접 테스트한 종목들을 추천드립니다 (GBPUSD, GBPCAD, GBPCHF, AUDCAD, AU
Btmm state engine pro
Garry James Goodchild
5 (4)
BTMM State Engine Pro is a MetaTrader 5 indicator for traders who use the Beat The Market Maker approach: Asian session context, kill zone timing, level progression, peak formation detection, and a multi-pair scanner from a single chart. It combines cycle state logic with a built-in scanner dashboard so you do not need the same tool on many charts at once. What it does Draws the Asian session range; session times can follow broker server offset or be set in inputs. Tracks level progression (L
Atomic Analyst MT5
Issam Kassas
3.94 (31)
우선적으로 언급할 점은이 거래 지표가 다시 그리지 않고 지연되지 않으며 이를 통해 수동 및 로봇 거래 모두에 이상적이라는 점입니다. 사용자 매뉴얼: 설정, 입력 및 전략. Atomic Analyst는 가격의 강도와 모멘텀을 활용하여 시장에서 더 나은 이점을 찾는 PA Price Action Indicator입니다. 고급 필터를 장착하여 잡음과 거짓 신호를 제거하고 거래 잠재력을 높이는 데 도움이 됩니다. 복잡한 지표의 다중 레이어를 사용하여 Atomic Analyst는 차트를 스캔하고 복잡한 수학적 계산을 간단한 신호와 색상으로 변환하여 초보 트레이더가 이해하고 일관된 거래 결정을 내릴 수 있도록합니다. "Atomic Analyst"는 새로운 및 경험이 풍부한 트레이더를위한 종합적인 거래 솔루션입니다. 프리미엄 지표와 최고 수준의 기능을 하나의 거래 전략에 결합하여 모든 종류의 트레이더에 대한 다재다능한 선택지가되었습니다. 인트라데이 거래 및 스캘핑 전략 : 빠르고 정확한 일일
RelicusRoad Pro MT5
Relicus LLC
5 (24)
RelicusRoad Pro: 퀀트 시장 운영 체제 70% 할인 평생 이용권 (한정 시간) - 2,000명 이상의 트레이더와 함께하세요 왜 대부분의 트레이더는 "완벽한" 지표를 가지고도 실패할까요? 진공 상태에서 단일 개념 만으로 거래하기 때문입니다. 문맥 없는 신호는 도박입니다. 지속적인 승리를 위해서는 컨플루언스(중첩) 가 필요합니다. RelicusRoad Pro는 단순한 화살표 지표가 아닙니다. 완전한 퀀트 시장 생태계 입니다. 독점적인 변동성 모델링을 사용하여 가격이 이동하는 "공정 가치 로드"를 매핑하고, 단순 노이즈와 실제 구조적 돌파를 구분합니다. 추측은 그만두세요. 기관급 로드 로직으로 거래를 시작하세요. 핵심 엔진: "Road" 알고리즘 시스템의 중심에는 시장 상황에 실시간으로 적응하는 동적 변동성 채널인 Road Algo 가 있습니다. 세이프 라인(평형) 과 가격이 수학적으로 반전될 가능성이 높은 확장 레벨 을 투영합니다. Simple Road: 일반적인 시장을 위
ARICoins
Temirlan Kdyrkhan
ARICoin is a powerful trading companion designed to generate high-probability entry signals with dynamic TP/SL/DP levels based on volatility. Built-in performance tracking shows win/loss stats, PP1/PP2 hits, and success rates all updated live. Key Features: Buy/Sell signals with adaptive volatility bands Real-time TP/SL/DP levels based on ATR Built-in MA Filter with optional ATR/StdDev volatility Performance stats panel (Success, Profit/Loss, PP1/PP2) Alerts via popup, sound, push, or email Cust
ARIPoint
Temirlan Kdyrkhan
ARIPoint is a powerful trading companion designed to generate high-probability entry signals with dynamic TP/SL/DP levels based on volatility. Built-in performance tracking shows win/loss stats, PP1/PP2 hits, and success rates all updated live. Key Features: Buy/Sell signals with adaptive volatility bands Real-time TP/SL/DP levels based on ATR Built-in MA Filter with optional ATR/StdDev volatility Performance stats panel (Success, Profit/Loss, PP1/PP2) Alerts via popup, sound, push, or email Cu
Blahtech Supply Demand MT5
Blahtech Limited
4.54 (13)
Was: $299  Now: $99  Supply Demand uses previous price action to identify potential imbalances between buyers and sellers. The key is to identify the better odds zones, not just the untouched ones. Blahtech Supply Demand indicator delivers functionality previously unavailable on any trading platform. This 4-in-1 indicator not only highlights the higher probability zones using a multi-criteria strength engine, but also combines it with multi-timeframe trend analysis, previously confirmed swings a
Volume flow Profile
Israr Hussain Shah
Master Edition은 거래량과 자금 흐름의 관점을 통해 시장 구조를 시각화하도록 설계된 전문가급 분석 도구입니다. 표준 거래량 지표와 달리, 이 도구는 차트에 일일 거래량 프로필을 직접 표시하여 가격 발견이 발생한 위치와 "스마트 머니"가 위치한 곳을 정확하게 볼 수 있게 합니다. 이 Master Edition은 명확성과 속도를 위해 설계되었으며, 로드 시 차트 레이아웃을 즉시 아름답게 만드는 독특한 자동 테마 동기화 시스템을 특징으로 합니다. 주요 기능: 진정한 자금 흐름 계산: 표준 틱 거래량을 넘어섭니다. "Use Money Flow"를 활성화하면 거래량이 가격에 따라 가중치가 부여되어 특정 가격 수준에서의 실제 자본 투입을 드러냅니다. 가치 영역(VA) 시각화: 가치 영역(기본값: 거래량의 70%)을 자동으로 계산합니다. VA Fill: 통제 구역을 즉시 식별하기 위해 가치 영역 배경을 음영 처리합니다. 주요 수준: 통제점(POC), 가치 영역 고점(VAH), 가치 영
우선적으로, 이 거래 도구는 전문적인 거래에 이상적인 비-다시 그리기 및 지연되지 않는 지표입니다.  온라인 강좌, 사용자 매뉴얼 및 데모. 스마트 가격 액션 컨셉트 인디케이터는 신규 및 경험 많은 트레이더 모두에게 매우 강력한 도구입니다. Inner Circle Trader Analysis 및 Smart Money Concepts Trading Strategies와 같은 고급 거래 아이디어를 결합하여 20가지 이상의 유용한 지표를 하나로 결합합니다. 이 인디케이터는 스마트 머니 컨셉트에 중점을 두어 대형 기관의 거래 방식을 제공하고 이동을 예측하는 데 도움을 줍니다.  특히 유동성 분석에 뛰어나 기관이 어떻게 거래하는지 이해하는 데 도움을 줍니다. 시장 트렌드를 예측하고 가격 변동을 신중하게 분석하는 데 탁월합니다. 귀하의 거래를 기관 전략에 맞추어 시장의 동향에 대해 더 정확한 예측을 할 수 있습니다. 이 인디케이터는 시장 구조를 분석하고 중요한 주문 블록을 식별하고 다양
Gartley Hunter Multi
Siarhei Vashchylka
5 (11)
Gartley Hunter Multi - An indicator for searching for harmonic patterns simultaneously on dozens of trading instruments and on all possible timeframes. Manual (Be sure to read before purchasing) | Version for MT4 Advantages 1. Patterns: Gartley, Butterfly, Shark, Crab. Bat, Alternate Bat, Deep Crab, Cypher 2. Simultaneous search for patterns on dozens of trading instruments and on all possible timeframes 3. Search for patterns of all possible sizes. From the smallest to the largest 4. All fou
Bill Williams Advanced
Siarhei Vashchylka
5 (11)
Bill Williams Advanced is designed for automatic chart analysis using Bill Williams' "Profitunity" system. The indicator analyzes four timeframes at once. Manual (Be sure to read before purchasing) Advantages 1. Analyzes the chart using Bill Williams' "Profitunity" system. Signals are displayed in a table in the corner of the screen and on the price chart. 2. Finds all known AO and AC signals, as well as zone signals. Equipped with a trend filter based on the Alligator. 3. Finds "Divergence Bar
TPA True Price Action indicator reveals the true price action of the market makers through 100% non-repainting signals strictly at the close of a candle! TPA shows entries and re-entries, every time the bulls are definitely stronger than the bears and vice versa. Not to confuse with red/green candles. The shift of power gets confirmed at the earliest stage and is ONE exit strategy of several. There are available now two free parts of the TPA User Guide for our customers. The first "The Basics"
Currency Strength Dashboard Pro
Anastasia Danilova
5 (1)
Currency Strength Dashboard Pro MetaTrader 5 를 위한 실시간 통화 강도 분석 전문 대시보드 입니다. 이 지표는 8개의 주요 통화 (EUR, USD, GBP, JPY, CHF, AUD, CAD, NZD)의 강도를 계산하고, 28개의 통화쌍 을 동시에 여러 시간 프레임에서 분석하여 표시합니다. 이 대시보드는 트레이더가 추가 계산이나 여러 차트 간 전환 없이 한눈에 시장 전체 상황을 파악 할 수 있도록 해줍니다. 계산 방법 이 지표는 고급 수학적 통화 강도 분석 방법 을 기반으로 합니다. 이는 유사한 지표에서 널리 사용되는 RSI 기반 방법 보다 더 정확하고 객관적인 결과를 제공합니다. 이 방법은 28개의 모든 통화쌍 간의 관계를 동시에 분석 하여 시장에서 실제로 형성되는 힘의 균형을 보다 명확하고 편향 없이 보여줍니다. 실시간 대시보드 메인 테이블에는 8개의 통화 에 대한 전체 데이터가 표시됩니다. Rank (순위) — 전체 강도 기준 통화 순위, 1
Aurum Apex MT5
Hugo Feruglio
대부분의 골드 지표는 가격이 어디에 있었는지 를 보여줍니다. Aurum Apex는 대다수가 진입하기 전에 가격이 어디로 가는지를 보여줍니다. 이것은 주장이 아닙니다. 이것이 바로 이 시스템의 설계입니다. Aurum Apex란 무엇인가요? Aurum Apex는 MetaTrader 5를 위한 리페인트 없는 XAUUSD 스캘핑 지표 로, 오직 하나의 종목인 골드만을 중심으로 구축되었습니다. 가격 확장이 완전한 속도에 도달하기 전, 브레이크아웃 모멘텀의 시작점을 포착하도록 설계되었습니다. 리페인트하지 않습니다. 지연되지 않습니다. 추측하지 않습니다. 모든 신호는 차트에 완전히 표시된 진입선, 스탑로스, 테이크프로핏과 함께 도착합니다. 버튼 하나를 클릭하기 전에 이미 트레이드 전체가 정의되어 있습니다. 암산 불필요. 모호함 없음. 망설임 없음. 골드 스캘핑에서 수익과 손실의 차이는 종종 초 단위로, 그리고 누가 먼저 진입했는지로 결정된다는 것을 이해하는 트레이더를 위한 정밀 도구입니다. 핵심
ICT PO3 (Power of 3) AMD Protocol Framework Indicator True Time & Structure Integration   |  Non-Repainting | Real-Time  | Multi-Asset  | MT4 Version Available Full Setup Guide & Strategy Playbook: https://www.mql5.com/en/blogs/post/768683 MT4 Version: https://www.mql5.com/en/market/product/171742 Indicator Overview The ICT PO3 AMD Protocol Framework is a complete structural overlay for MetaTrader 5 that maps the True Daily Cycle directly onto your lower-timeframe execution chart. It projects
Automated Trendlines MT5
Georgios Kalomoiropoulos
추세선은 외환 거래에서 기술적 분석의 가장 필수적인 도구입니다. 불행히도, 대부분의 거래자는 올바르게 그리지 않습니다. 자동 추세선 표시기는 시장의 추세 움직임을 시각화하는 데 도움이 되는 진지한 거래자를 위한 전문 도구입니다. 추세선 강세 추세선과 약세 추세선에는 두 가지 유형이 있습니다. 상승 추세에서 Forex 추세선은 가격 움직임의 가장 낮은 스윙 포인트를 통해 그려집니다. 최소 두 개의 "최저 저점"을 연결하면 추세선이 생성됩니다. 하락 추세에서 추세선은 가격 움직임의 가장 높은 스윙 포인트를 통해 그려집니다. 최소 두 개의 "최고 최고점"을 연결하면 추세선이 생성됩니다. 추세선이 깨질 때? 강세 추세선은 약세 양초가 강세 추세선 아래에서 닫히고 양초의 고점이 추세선 위에 있을 때 깨집니다. 약세 추세선은 강세 양초가 약세 추세선 위로 마감되고 양초 저점이 추세선 아래에 있을 때 깨집니다. 추세선이 삭제되면? 강세 추세선은 전체 양초가 강세 추세선 아래에
Basic Supply Demand Dashboard MT5
Mehran Sepah Mansoor
5 (1)
이 대시보드는 선택한 기호에 대한 거래 전략에 따라 스캘핑 모드와 장기 모드 모두에서 차트의 공급 및 수요 영역을 검색하고 표시합니다. 또한 대시보드의 스캐너 모드를 통해 원하는 모든 기호를 한눈에 확인하고 적합한 위치를 놓치지 않도록 도와줍니다 / MT4 버전 . 무료 보조지표:   Basic Supply Demand 특징 여러 통화쌍에 대한 거래 기회를 볼 수 있으며, 공급 및 수요 영역에 대한 근접성에 따라 순위가 매겨진 모든 쌍을 명확하고 간결하게 볼 수 있습니다. 색상부터 감지 매개변수까지 특정 요구에 맞게 사용자 지정 설정 가능 주요 입력 Indicator mode :   표시기 모드 또는 새로운 기능이 포함된 패널 모드 중에서 선택 가능 Symbols :   "28개 주요 통화쌍" 또는 "선택한 심볼" 중에서 선택 Selected Symbols :   쉼표로 구분하여 모니터링하려는 원하는 심볼("EURUSD, GBPUSD, XAUUSD")을 선택합니다. 브로
RFI levels PRO MT5
Roman Podpora
3.67 (3)
이 지표는 추세 반전 지점과 가격 반등 영역을 정확하게 보여줍니다.       주요 투자자들   . 새로운 트렌드가 형성되는 곳을 파악하고 최대한 정확하게 의사결정을 내리며 모든 거래를 완벽하게 통제합니다. TREND LINES PRO   지표와 함께 사용할 때 최대의 잠재력을 발휘합니다.  VERSION MT4 지표가 보여주는 내용: 새로운 추세의 시작 시 활성화되는 반전 구조 및 반전 수준. 최소한의 위험 대비 수익률을 갖는 이익 실현   (TAKE PROFIT)   및   손절매(STOP LOSS)   레벨 표시       RR 1:2   . 지능형 손실 감소 로직이 적용된 손절매 기능. 지정된 지표에서 두 가지 추세 유형에 대한 반전 패턴을 표시합니다. 지표: 트렌드를 따라   트렌드 라인 프로   (글로벌 트렌드 변화) 트렌드 프로   (빠른 트렌드 변화) 간단하고 효과적입니다       스캐너       실시간 추세 (신규). 다중 시간 프레임 도구 필터링. 표시하다  
AriX
Temirlan Kdyrkhan
1 (4)
AriX Indicator for MT5 A powerful trend-following and signal-evaluation tool AriX is a custom MT5 indicator that combines Moving Averages and ATR-based risk/reward logic to generate clear buy/sell signals. It visualizes dynamic SL/TP levels, evaluates past trade outcomes, and displays win/loss statistics in a clean on-chart panel. Key features include: Buy/Sell signals based on MA crossovers ATR-based SL/TP1/TP2/TP3 levels with visual lines and labels Signal outcome tracking with real-time stat
Advanced Supply Demand MT5
Bernhard Schweigert
4.53 (15)
현재 33% 할인! 초보자나 전문 트레이더를 위한 최고의 솔루션! 이 보조지표는 우리가 다수의 독창적 기능과 새로운 공식을 통합한 독특하고 고품질이며 저렴한 거래 도구입니다. 이 업데이트를 통해 이중 시간대를 표시할 수 있습니다. 더 높은 TF를 표시할 수 있을 뿐만 아니라 차트 TF와 더 높은 TF 모두를 표시할 수 있습니다: 중첩 영역 표시. 모든 Supply Demand 트레이더들이 좋아할 것입니다. :) 중요한 정보 공개 Advanced Supply Demand의 잠재력을 극대화하려면 다음을 방문하십시오. https://www.mql5.com/ko/blogs/post/720245   진입 또는 목표의 명확한 트리거 포인트를 정확히 찾아냄으로 해서 거래가 어떻게 개선될지 상상해 보십시오. 새로운 알고리즘을 기반으로 매수자와 매도자 간의 잠재적인 불균형을 훨씬 더 쉽게 분간할 수 있습니다. 왜냐하면 가장 강한 공급영역과 가장 강한 수요 영역과 과거에 어떻게 진행 되었는지를(이전
Smart Structure Concepts MT5
Cristhian Alexander Gaibor Cuasquer
Smart Structure Concepts MT5는 MetaTrader 5를 위한 가장 완전한 기관급 SMC 툴킷입니다 — 4개 언어의 교육용 툴팁과 가격이 존에 진입하는 순간 발생하는 실시간 푸시 알림을 갖추고 있습니다. 대부분의 SMC 인디케이터는 박스만 그리고 나머지는 추측에 맡깁니다. 이 인디케이터는 차트 위에서 모든 시그널을 직접 설명합니다. 모든 BOS, CHoCH, Order Block, FVG, 유동성 레벨 위에 마우스를 올리면 의미와 다음 조치를 즉시 확인할 수 있습니다 — 영어, 스페인어, 포르투갈어, 프랑스어로. 주요 기능 — Internal & Swing BOS / CHoCH 실시간 감지 (리페인트 없음) — Internal & Swing Order Blocks 자동 미티게이션 — 상승 및 하락 Fair Value Gaps — Equal Highs & Lows (EQH / EQL) 유동성 매핑 — Premium / Discount / Equilibrium
Meravith MT5
Ivan Stefanov
5 (1)
마켓 메이커를 위한 도구. Meravith는 다음과 같은 기능을 제공합니다: 모든 타임프레임을 분석하고 현재 유효한 추세를 표시합니다. 강세와 약세 거래량이 동일한 유동성 구간(거래량 균형 구간)을 강조 표시합니다. 서로 다른 타임프레임의 모든 유동성 레벨을 차트에 직접 표시합니다. 텍스트 기반 시장 분석을 생성하여 참고용으로 제공합니다. 현재 추세를 기반으로 목표가, 지지선 및 손절가를 계산합니다. 거래의 위험 대비 보상 비율(Risk/Reward)을 계산합니다. 계좌 잔고에 따라 포지션 크기를 산출하고 잠재 수익을 추정합니다. 시장에 중대한 변화가 발생할 경우 경고도 제공합니다. 지표의 주요 라인: 강세/약세 거래량 소진 라인 — 목표가로 사용됩니다. 시장 추세를 나타내는 라인. 시장이 강세인지 약세인지에 따라 색상이 변경되며 추세 지지선 역할을 합니다. 색상은 주로 시장 심리를 보여줍니다. 거래량 균형선(Eq). Eq(Volume Equilibrium) 라인은 시스템의 핵심입니
필터:
리뷰 없음
리뷰 답변