StochasticRSIMT4
- インディケータ
- バージョン: 1.0

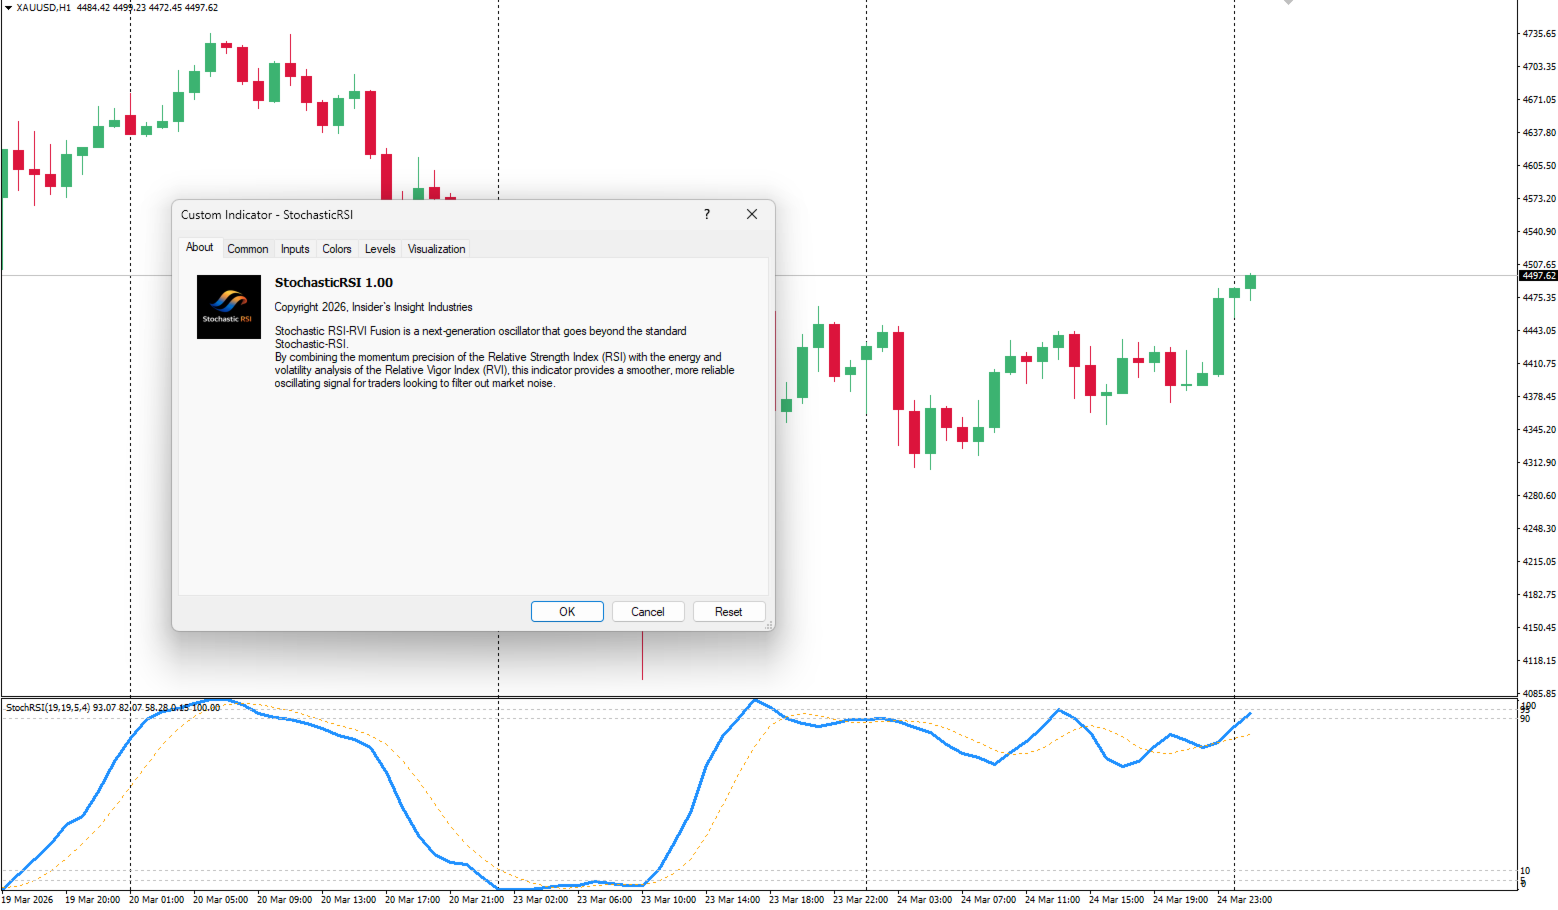
Stochastic RSI-RVI Fusion is a next-generation oscillator that goes beyond the standard Stochastic RSI. By combining the momentum precision of the Relative Strength Index (RSI) with the energy and volatility analysis of the Relative Vigor Index (RVI), this indicator provides a smoother, more reliable oscillating signal for traders looking to filter out market noise.
Standard oscillators often give false signals during choppy markets. This "Fusion" edition solves that by averaging market strength and market vigor before applying the stochastic normalization. The result is a highly responsive yet stable indicator perfect for scalping and swing trading.
Key Features
-
Hybrid Logic Engine: Unlike standard indicators that rely on a single data source, this tool calculates the consensus between RSI and RVI.
-
Advanced Smoothing: Includes inputs for %K slowing and %D smoothing to customize the sensitivity to your trading style.
-
Overbought/Oversold Detection: Identify extreme market conditions with clearer entry and exit zones.
-
Versatile Application: Works on all timeframes (M1 to Monthly) and acts as a powerful confirmation tool for trend-following strategies.
-
No Repainting: Once a candle closes, the signal values are fixed.
How to Trade
-
Overbought/Oversold:
-
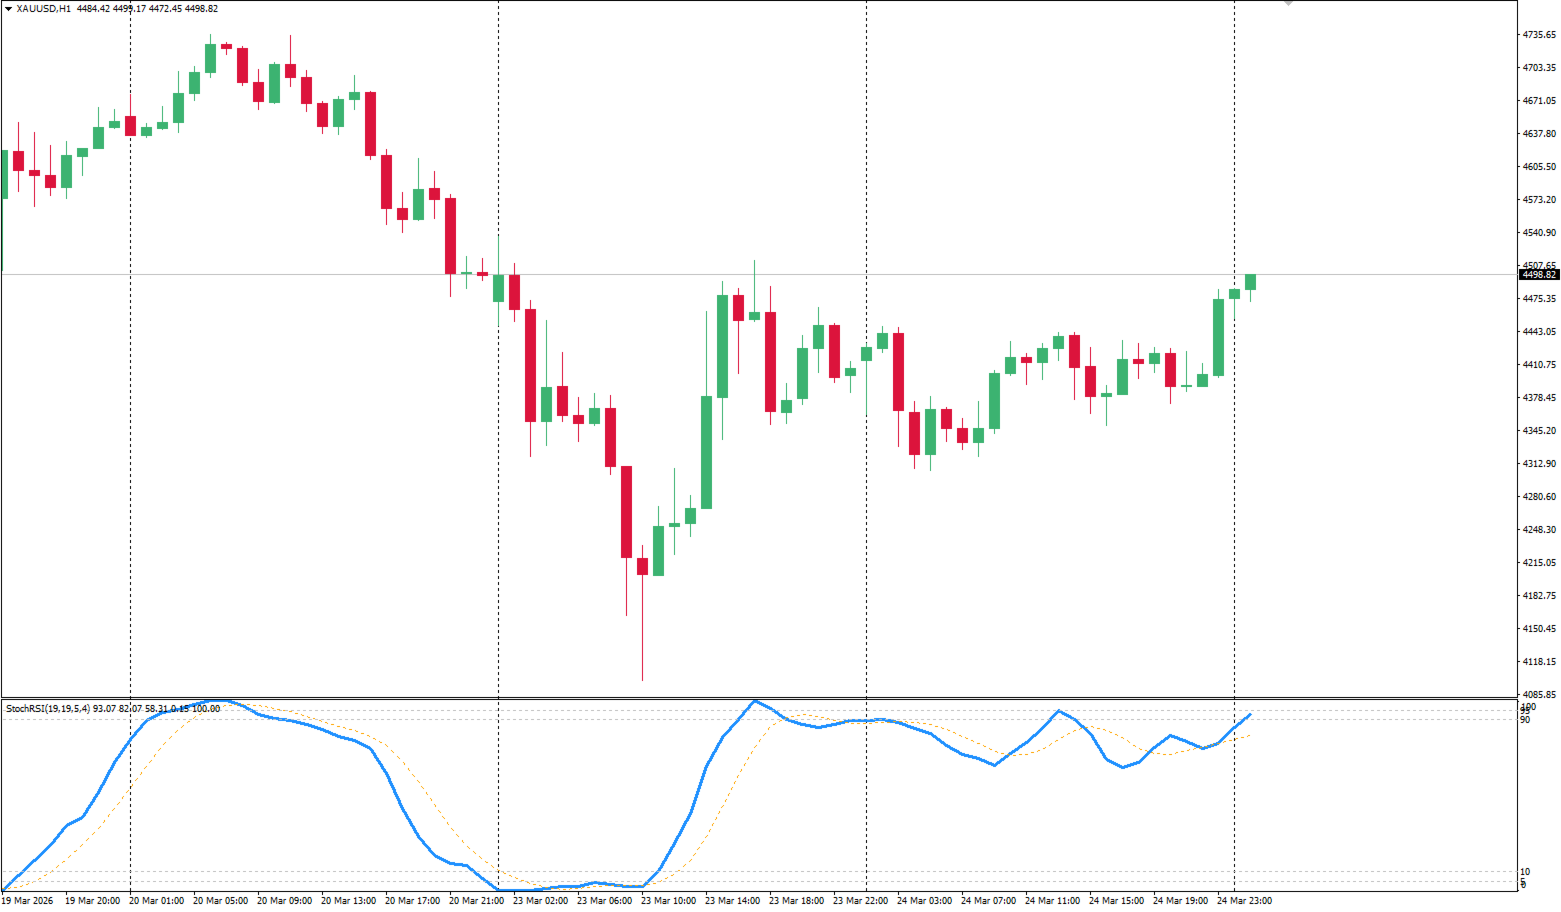
Buy Signal: When the indicator line crosses above the 10 level (Oversold zone).
-
Sell Signal: When the indicator line crosses below the 90 level (Overbought zone).
-
-
Signal Crossover:
-
Look for the %K line (Main) to cross the %D line (Signal). A cross upwards indicates bullish momentum, while a cross downwards indicates bearish momentum.
-
-
Divergence: Watch for price making lower lows while the indicator makes higher lows (Bullish Divergence).
Input Parameters
-
InpRSIPeriod (Default: 19): The lookback period for the base RSI and RVI calculation.
-
InpKPeriod (Default: 19): The period used for the Stochastic calculation (High/Low range).
-
InpDPeriod (Default: 5): The smoothing period for the Signal line (%D).
-
InpSmoothing (Default: 4): The slowing period for the Main line (%K) to reduce noise.
-
InpAppliedPrice (Default: Typical Price): The price type used for calculation (Close, Open, High, Low, Median, Typical, Weighted).
Why use RVI with RSI?
While RSI measures the velocity of price changes, RVI is based on the idea that in a bull market, the closing price is, in general, higher than the opening price. Combining these two concepts creates a "Weighted Stochastic" that validates if the momentum is backed by actual market vigor.
Enhance your trading precision with the Stochastic RSI-RVI Fusion today!