Dynamic Candle Countdown Timer
- インディケータ
-
Md Golam Murshed
 I am Md.Golam Murshed
Professional Forex Trader & MQL5 Developer
I specialize in price action, market structure (HH/HL/LH/LL), CAP Channel, RSI, Moving Average systems, and advanced drawdown logic. - バージョン: 1.2
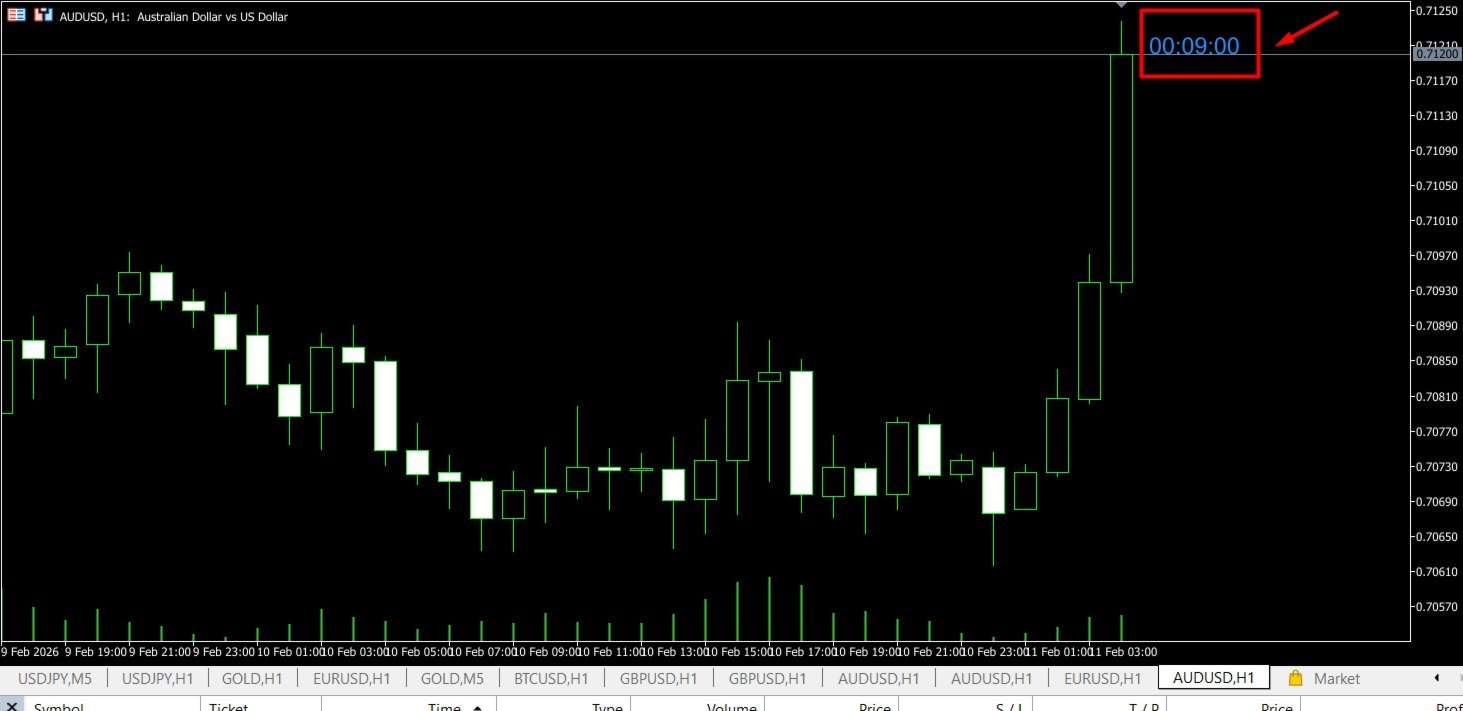
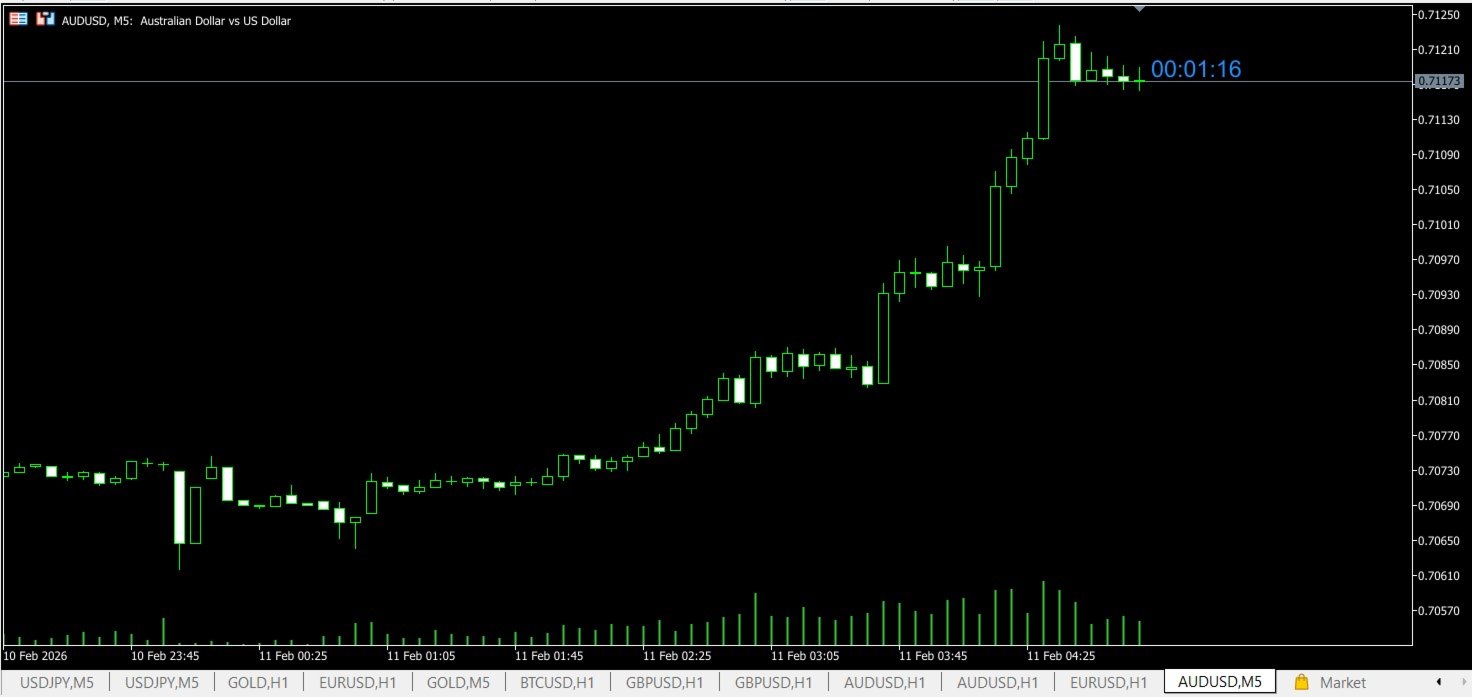
Dynamic Candle Countdown
This indicator provides a real-time countdown to the next candle. Unlike standard timers, it positions the label near the current price for better visibility during fast-moving markets.
-
Real-time updates: Uses a 1-second timer event.
-
Dynamic Positioning: Follows the price action automatically.
-
Fully Customizable: Adjust colors, font size, and offsets to suit your chart template.
-
Performance Optimized: Minimal CPU usage.


LO UTILIZO EN INDICES SINTETICOS Y LLEVO UN CONTROL MUY LUMINOSO DE LA VELA QUE VA CORRIENDO.... MUCHAS GRACIAS