RSI Breakout Dashboard

5

RSI Breakout Dashboard is a tool for multiple currency pairs analysis at the same time in terms of breakout (return) from Oversold or Overbought Zone to Neutral Zone.


All displayed and used by indicator symbols are free to choose and are specified using a space separated list in parameters, so you're able to analyze not only predetermined ones, but everything that your broker offers, also commodities, equities, indices, ones with prefixes, suffixes etc.


You can choose 3 types of alerts: alert notifications in the MT4 terminal, push notifications to mobile device and email alerts, e.g. sent from VPS.


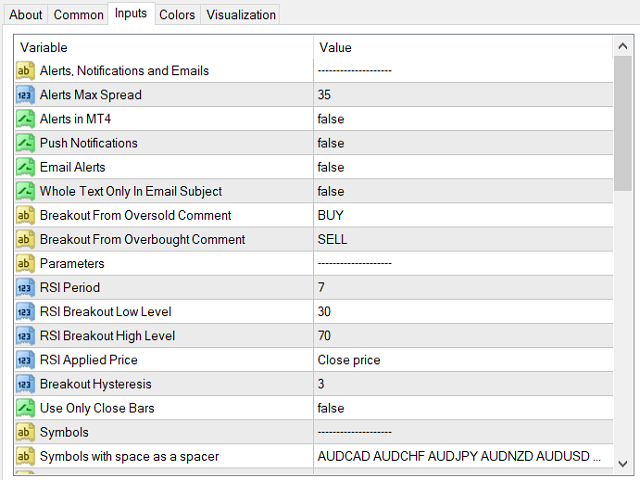
The most important parameters are period of RSI ("RSI Period"), 2 levels ("RSI Breakout Low Level", "RSI Breakout High Level") and hysteresis ("Breakout Hysteresis"). We get notifications above low and below high level if the value of RSI previously touched high or low level increased or decreased with value of hysteresis (specified in "Breakout Hysteresis" parameter). That gives us opportunity to filter bad/false signals from fluctuations of the RSI value.


The best explanation will be a simple example:

We set three parameters: RSI Breakout Low Level to 30, High Level to 70 and Breakout Hysteresis to 5,

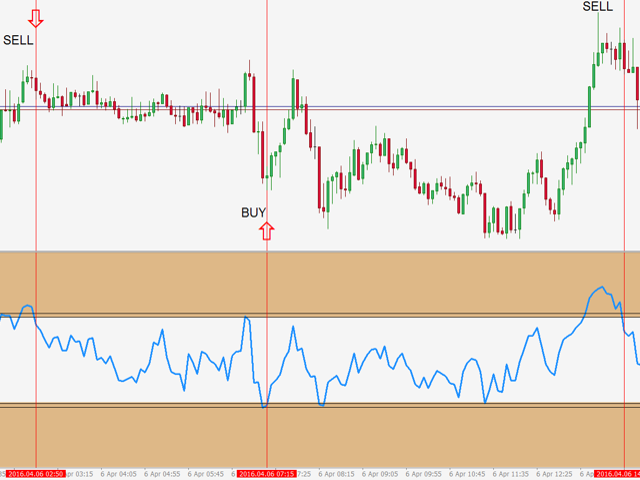
  • if the value of RSI touches area below 25 or is equal to (25 comes from "RSI Breakout Low Level" minus "Breakout Hysteresis") indicator saves a fact of oversold state in memory and waits until "RSI Breakout Low Level" (=30) is crossed,
  • if RSI goes above Low Level (>30) it triggers alert to BUY (immediately or after closing the bar on specified timeframe, depending on "Use Only Closed Bars" - if "False" it alerts immediately),
  • if the RSI goes up further and touches 50, the alert state is reset (>=50) and another alert may occur when the RSI touches overbought or oversold zone and returns to neutral zone again.

In case of overbought it's similar, but inverted - the price goes down and crosses the hysteresis zone back to the neutral zone and gives SELL.


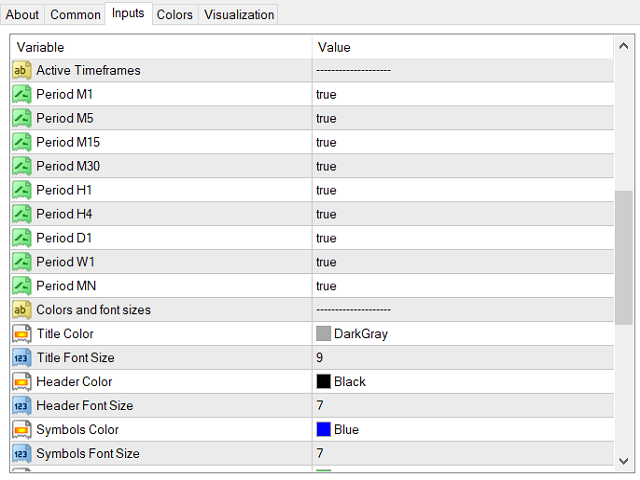
All available timeframes in MT4 are possible to choose in the parameters of indicator, from M1 (1 Minute) to MN (1 Month). On the screen you'll see (as columns) only selected TFs and they will be used for alerts, notifications, emails etc.


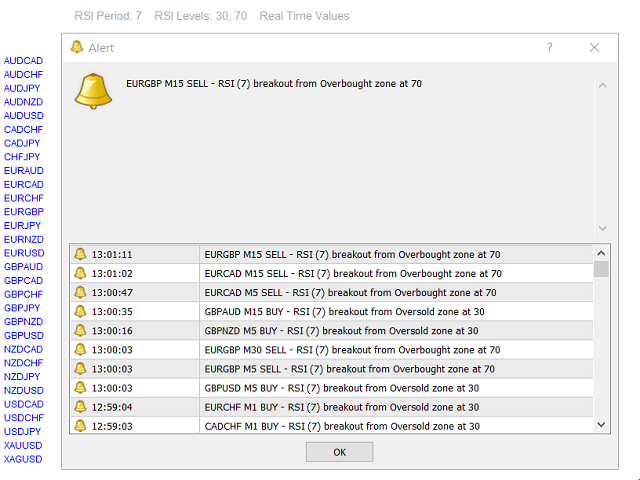
For every alert you can add comments: "Breakout From Oversold Comment" (default: "BUY") and "Breakout From Overbought Comment" (default: "SELL"), which are embedded between timeframe and RSI period. Information received in the alerts are: symbol, timeframe, comment, RSI (with given period) breakout from Oversold/Overbought zone at RSI level, eg.: EURUSD M15 BUY - RSI (14) breakout from Oversold zone at 30.

We can also choose whether the whole text of email alert is in the body or in the subject of email message ("Whole Text Only In Email Subject"). When set to False alerts look like:

Subject: GBPUSD

Body (comments on): M15 SELL - RSI (14) breakout from Overbought zone at 70

If we set "Whole Text Only In Email Subject" to True - whole text will be in subject.

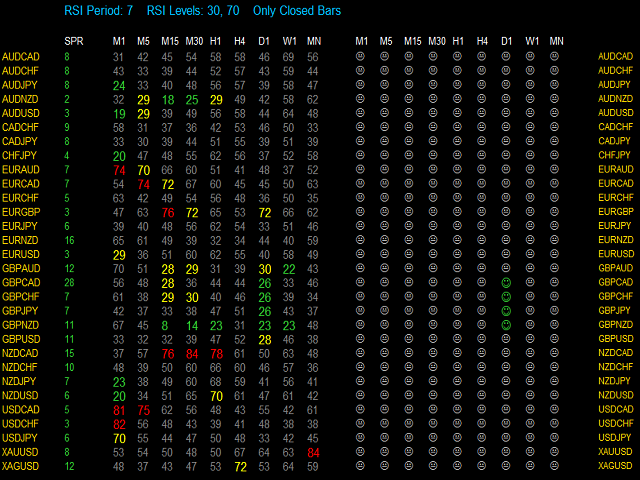
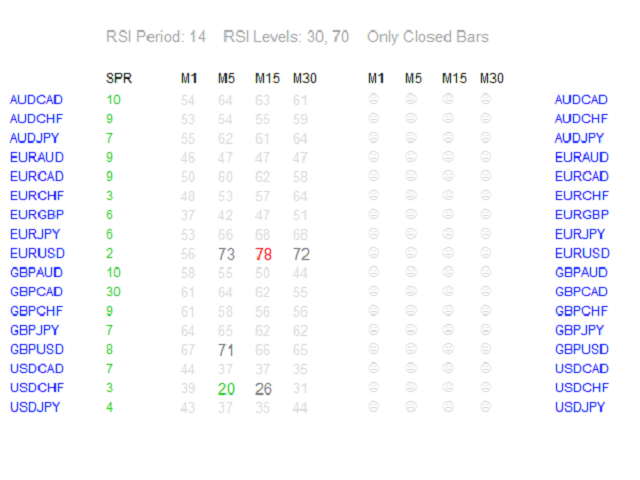
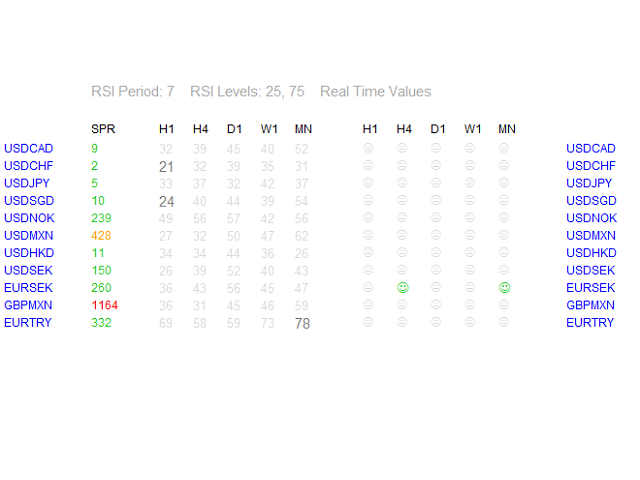
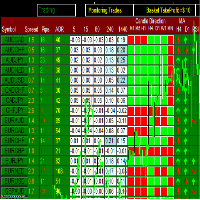
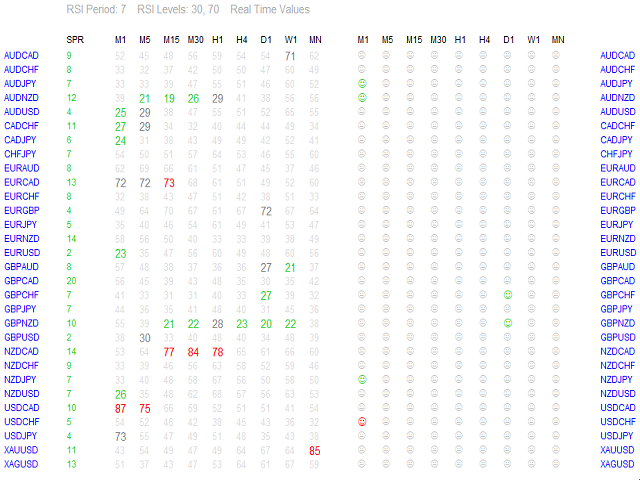
In the header of RSI Breakout Dashboard are displayed 4 actual parameters: RSI Period, 2 RSI Levels and "Real Time Values" or "Only Closed Bars" (depending on parameter "Use Only Closed Bars").


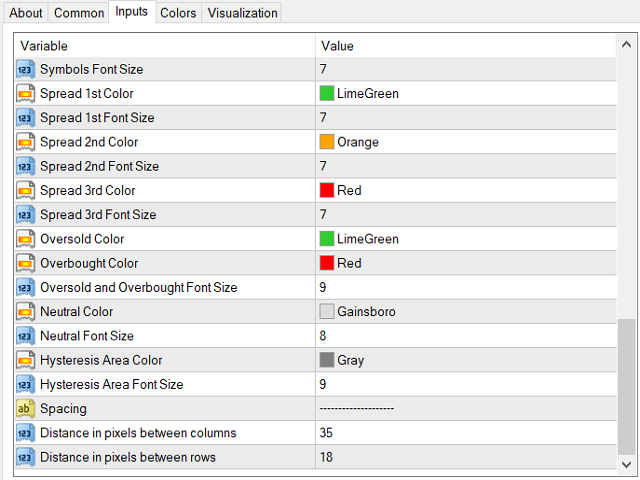
Every color and font size of an indicator is modifiable.

Default colors mean:

Green - RSI is below RSI Breakout Low Level decreased with Hysteresis (Oversold Zone), e.g. 30-5=25.

Red - RSI is above RSI Breakout High Level increased with Breakout_Hysteresis (Overbought Zone), e.g. 70+5=75.

Gray - RSI in Hysteresis area (e.g. between 25 and 30 or 70 and 75).

Gainsboro - RSI in Neutral Zone, e.g. between 30 and 70.


All the smileys show the last state that was triggered (green = BUY or red = SELL) so long as it is not reset to neutral (Gainsboro).


You can set maximum spread at which the alerts will come ("Alerts Max Spread").

Spread values also can have different colors:

a) when it's lower or equal to "Alerts Max Spread",

b) between 1 and 1.5 times higher than parameter,

c) above 1.5 times higher than parameter.

I suggest to make a new template with "RSI Breakout Dashboard" and scheme without colors ("None"), only Background and Foreground set to "White".


Remember, no one except yourself is responsible for any investment decision made by you.

You are responsible for your own investment research and investment decisions.

Good luck!
レビュー 5
Richard Jehl
1701
Richard Jehl 2017.02.21 01:15 
 

Dominik's projects and tools are among the most interesting and valuable over here, and the price is fair. First 5 trades using this dashboard were winners. But I still need to build a precise system as regard to SL and TP, and test on the long term. Thank you Dominik.

Johan Michel Struijk
247
Johan Michel Struijk 2017.02.16 16:57 
 

Awesome tool, great support and a great guy. I made 126% profit in a month because of his tools!

fabbry72
1389
fabbry72 2016.12.04 16:09 
 

Great dashboard very accurate,

together only two simple MA and PA in one months I made +40%

Profitable trading doesn't need complicated strategies: the right way is keep things extremely simple.

Good job Dominik !!

Fab.

おすすめのプロダクト
このインジケータは、スプレッドを3種類のフォーマットでCSVファイルに出力できるユーティリティです。 スプレッドがトレード結果に大きく影響を与えるようなスキャルピングの場合、あなたが利用するFX業者のスプレッドの仕様は、意識しなければならない重要な点です。スプレッドは時間帯によって大きく値が変化しますので、FX業者が公式に発表しているスプレッドの平均値は、あまり参考になりません。FX業者ごとのスプレッドの仕様を、ユーザー自ら調査することはとても大切なことです。このインジケーターは、そのようなユーザーのお役に立ちます。 CSVファイルの説明 CSVファイルは、( ./MQL4/Files/ )のフォルダに作成されます。ただし、テスターを使ったテストの場合には、( ./tester/files/ ) のフォルダに作成されます。CSVファイルのフォーマットの仕様は、スクリーンショットを参照してください。 CSV_file1 : スプレッドはtickごとに出力します。"YYYY/MM/DD", "HH:MI:SS", "Spread(pips)" CSV_file2 : Bar単位ごとのスプ
Displays a digital clock in the chart in realtime. Benefits: Current time always in sight for market open/close, economic data, etc. Displays accurate time (server/broker time) Clearly visible (set color, size, font, position) Always runs/refreshes even without new price tick Hint: To display the most accurate time, use the server (broker) clock setting combined with the time (hour) offset for your time zone.
FREE
Fastest way to change the period. Suitable for traders who use many charts and timeframes. Size, shape and color can be customized. Inputs Parameters Corner — Choose corner placement Standart is "Right lower chart corner" Color — Background color of the button ColorText — Text color of the button ColorOn — Background color of the button for the current period ColorOnText — Text color of the button for the current period Font — Arial, Verdana... FontSize — Size of the font in pixels DistanceX —
FREE
Free informative Indicator-helper. It'll be usefull for traders who trade many symbols or using grid systems (Averaging or Martingale). Indicator counts drawdown as percent and currency separate. It has a number of settings: Count deposite drawdown according equity value and send e-mail or notifications to user if DD more than set; Sending e-mail when max open orders reached; Shows price and remaining pips amount before MarginCall on current chart and Account generally; Display summary trade lot
FREE
Position Selective Close MT4
Francisco Manuel Vicente Berardo
The Position Selective Close is a multi-symbol multi-timeframe script used to close simultaneously various positions.  General Description   The Position Selective Close   possesses   three operation modes (Intersection,   Union   and All) that control the way   as   four position features (symbol, magic number,   type   and profit) are used. The modes, available through the Selection Mode input parameter, relate to the features, available through the “Select by Feature” and “Feature” input pa
FREE
Program Overview: This program is a trading tool designed to monitor and analyze the 7 major currency pairs. It is a variant of a similar program used for tracking stock indices, but this version focuses on the seven major currency pairs. The program helps in identifying and calculating significant price movements (gaps) between the high and low prices of these currency pairs over a specified time frame. It then provides insights through comments and alerts based on the calculated gaps. Major Cu
オプション市場からのリアルタイムガンマエクスポージャー(GEX)レベルをSP500チャートに表示。30分ごとに更新。 Full description: GammaOrderBook Free — オールインワンEA。GEXデータをダウンロードしチャートに直接表示。別途インジケーター不要。 表示内容 • GEX Bars — コール/プットのガンマレベルを水平バーで表示、ETF/Index別に色分け • Zero Gamma Line — ディーラーのヘッジ方向が変わる重要レベル • Panorama V4 — マルチタイムフレームのガンマポジショニング • サポート/レジスタンス — オプション建玉からの主要レベル • Bias Panel — BULL/BEAR/NEUTRALシグナル、OIポジショニング • Distance Display — Zero Gammaからのリアルタイム距離 対応銘柄 • ES / SP500 (US500) データ更新 • 30分ごと • メール・ライセンス・サブスクリプション不要 設定 1. SP500またはUS500チャート
FREE
Simple RSI Forex Trading Strategy
Victor Manuel Valderrama Zamora
2.5 (2)
Diversify the risk in your trading account by combining our Expert Advisors. Build your own custom trading system here:   Simple Forex Trading Strategies The expert advisor opens trades when RSI indicator enter in oversold or overbought areas. The Stop Loss, Take Profit, and Trailing Stop are calculated based on the ATR indicator. The recommended currency pair is EURGBP and the recommended timeframe to operate and to do backtests is H4. This Expert Advisor can be profitable in any TimeFrame an
FREE
The Night Scalper EA Lite is a fully automated Expert Advisor that trades at night and relies on price reversion. The EA trades using market orders and has the option to use time averaging to improve performance. This EA works best on EURUSD using the M5 timeframe, but will also work on AUDUSD, GBPUSD, NZDUSD, USDCAD, USDCHF and likely many more. A VPS is advisable when trading this system and a low spread and commission based broker is best. Check the comments for back test results and optimiz
FREE
This simple but useful script calculates the lot in % of the deposit. It is indispensable for risk management. There is only one customizable parameter: MaxRisk - risk in % for lot calculation. The product works as a standard script. Launch it once on an appropriate chart and start trading using the calculated lot value. Genious is simplicity! Happy trading!
FREE
Lucky Forex Stats Lucky Forex Stats Allow users to See all Account data on their Chart, you can choose any time period and it'll show you full account details with ratio, and each pair has individual details! Advantages You can choose any time period and it'll display all detail. You can see your whole accounts details, the profit and loss with exact $figure and ratio as well. Each pair shows the profit they've earned or lose, The winning and losing trades Winning VS losing % and many more P
FREE
Vanexio
Sayan Vandenhout
VANEXIO USES THE TREND WAVE INDICATOR AND IT CAN IDENTIFY THE BEGINNING AND THE END OF A NEW WAVE TREND MOVEMENT. AS AN OSCILLATOR, THE INDICATOR IDENTIFIES THE OVERBOUGHT AND OVERSOLD ZONES. IT WORKS GREAT TO CATCH THE SHORT TERM PRICE REVERSALS AND USES A MARTINGALE STRATEGY TO CLOSE ALL TRADES IN PROFIT. USE DEFAULT SETTINGS ON H1 OR HIGHER TIME FRAME ON ANY PAIR FOR MORE ACCURATE TRADES WHY THIS EA : Smart entries calculated by 5 great strategies The EA can be run on even a $20000 acco
FREE
Free automatic Fibonacci is an indicator that automatically plots a Fibonacci retracement based on the number of bars you select on the BarsToScan setting in the indicator. The Fibonacci is automatically updated in real time as new highest and lowest values appears amongst the selected bars. You can select which level values to be displayed in the indicator settings. You can also select the color of the levels thus enabling the trader to be able to attach the indicator several times with differe
FREE
First 20 Downloads FREE ## 1. Overview $2014 MA Perfect Order All-Currency Scanner Detects "Perfect Order" moving average alignment across all currency pairs simultaneously. A Perfect Order occurs when 3-5 moving averages of increasing periods are stacked in a single, uninterrupted order $2014 proof that price is trending cleanly with no conflicting timeframes.   BUY  signal : Shorter-period MAs are all above longer-period MAs (fast-to-slow stack) -> strong uptrend   SELL signal : Shorte
FREE
Show Pips
Roman Podpora
4.27 (59)
この情報インジケーターは、アカウントの現在の状況を常に把握したい人にとって役立ちます。このインジケーターには、ポイント、パーセンテージ、通貨での利益、現在のペアのスプレッド、現在の時間枠でバーが閉じるまでの時間などのデータが表示されます。 バージョンMT5 -   より便利なインジケーター チャート上に情報線を配置するには、いくつかのオプションがあります。 価格の右側 (価格の後ろにあります); コメントとして (グラフの左上隅に); 画面の選択した隅。 情報区切り記号を選択することもできます。 | / 。 \ # インジケーターにはホットキーが組み込まれています。 キー 1 - 情報表示の種類に戻ります (価格、コメント、コーナーの右側) キー 2 - 情報表示の種類を 1 つ進みます。 キー 3 - 情報ライン表示の位置を変更します。 ホットキーは設定で再割り当てできます。 このインジケーターは使いやすく、非常に有益です。設定で不要な情報項目を無効にすることも可能です。 設定 表示された情報を置き換えるホット キー (戻る)   - 情報表示の種類に戻ります。 表示情報を切り替
FREE
Smart Equity Protector (PropFirm Edition) Smart Equity Protector (PropFirm Edition) is a professional account equity protection and risk-management utility for MetaTrader 4. This Expert Advisor is designed to protect trading accounts from excessive losses by monitoring account equity in real time and automatically closing trades when predefined risk limits are reached. ️ This product does NOT open trades and does NOT generate trading signals . It works as a safety and protection system for manu
FREE
The "InfoBox" utility is designed to display the presence of open orders, the number of lots, current profit and much more in one window. The version for the MT5 platform   is here . You've probably encountered a situation where you have an advisor that works on a currency pair, but information about its operation: - orders and their number, the size of the spread for the instrument, the volume of lots on the market, drawdown and much more - are scattered in different places of the terminal and
FREE
Quantum Falcon Signal Free is a smart visual trading indicator for MetaTrader 4 designed for Forex and Gold traders. The indicator combines: • Trend analysis • RSI momentum confirmation • MACD momentum filtering • ATR volatility filtering • Higher timeframe confirmation • Smart exit signal detection Main Features: • Smart Buy and Sell signals • Exit Buy / Exit Sell alerts • Real-time dashboard on chart • Professional candle arrows • Multi-timeframe trend confirmation • ATR market volatility filt
FREE
This indicator help to mark the high and low of the session Asian,London,Newyork , with custom hour setting This indicator is set to count from minute candle so it will move with the current market and stop at the designated hour and create a accurate line for the day. below is the customization that you can adjust : Input Descriptions EnableAsian Enables or disables the display of Asian session high and low levels. EnableLondon Enables or disables the display of London session high and
FREE
DF Fib Trader Pro DF Fib Trader Proは、MetaTrader 4向けに設計された自動取引システムです。 フィボナッチベースの価格水準とトレンドおよびストラクチャー分析を組み合わせ、エントリーポイントとエグジットポイントを決定します。このEAはロングポジションとショートポジションの両方をサポートし、リスク管理パラメータも組み込まれています。 主な機能: • フィボナッチ・リトレースメントとエクステンション・ロジックを用いて、エントリーポイント、SLポイント、TPポイントをプロットします。 • ロットサイズと損切り/利益確定レベルを設定可能 • エントリーポイントは1つまたは2つから選択可能 • 市場状況に応じて、固定または動的な損切り/利益確定をサポート • 複数の時間枠と通貨ペアに対応 • 最大スプレッド、スリッページ、取引頻度の制御オプションを搭載 • 自動取引管理:損益分岐点、トレーリングストップ、部分決済オプション • 希望に応じて成行注文もサポート入力項目の概要: • リスク管理:ロットサイズ、取引ごとのリスク、最大取引回数 • エントリー
FREE
Inspector - リアルタイム パフォーマンス&ドローダウン モニタリング 追加資料と説明書 完全マニュアル   -   MT4 バージョン   -   MT5 バージョン リアルタイムで自分のトレードを正確に把握しましょう。 Inspector は、Meta Extender スイートから取り出した MetaTrader 向けのリアルタイム パフォーマンス&ドローダウン モニターです。各時間帯の成績をリアルタイムで追跡します。 機能概要: 複数の時間帯にわたるトレードパフォーマンス、ドローダウン、主要統計を継続的にリアルタイムで計算・監視します。Inspector は日次・週次・月次・年次のパフォーマンス指標を包括的に表示し、トレード結果をリアルタイムで確認できます。 主なメリット: 現在のトレードパフォーマンスとドローダウン水準を即座に把握 さまざまな時間帯の絶対・相対成績を追跡 期間の自動リセット(毎日深夜、毎週日曜など) オプションのトレード保護機能 - パフォーマンスまたはドローダウンの上限に達した際、新規トレードを自動的にブロック セッション中に多数のポジションを
FREE
Smart FVG インジケーター MT4 – MetaTrader 4 向け高度なフェアバリューギャップ検出 Smart FVG インジケーター MT4 は、MetaTrader 4 上で Fair Value Gap(FVG)をプロフェッショナルレベルで検出・監視し、アラートまで行うツールです。ATR ベースのフィルタリングと相場構造を考慮したロジックを組み合わせることで、ノイズを取り除き、流動性に応じて適応し、本当に重要な不均衡だけを残して精度の高い判断をサポートします。 主な特長 正確な FVG 検出:単なるローソク足のギャップではなく、市場の本質的な非効率を捉えます。 ATR ベースの精度:市場や時間軸が変わっても、低品質なシグナルを自動的にフィルタリング。 有効性のリアルタイム追跡:価格がゾーンを埋める/ブレイクすると、ゾーンが自動で延長・調整・削除されます。 カスタマイズ可能な表示:色・ラインスタイル・塗りつぶしを自由に設定し、どんなテンプレートにも合わせられます。 実用的なアラート:新規 FVG や、埋められた/無効化されたゾーンをリアルタイム通知。 パフォーマンス
FREE
Free version. Only works on EURUSD. Would you like to have statistics about your trades displayed while you operate? Have you a solid understanding of the symbol you are trading? Do you really know everything you need to about your trading account? Do you need to keep an eye on the local times around the world? Advanced Info Displayer answers to all that. It is the ultimate tool to know all sort of useful information and hidden or hard to find data. It is important if you are serious about tradi
FREE
Hello friends. I wrote this utility specifically for use in my profile with a large number of Expert Advisors and sets ("Joint_profiles_from_grid_sets" https://www.mql5.com/en/blogs/post/747929 ). Now, in order to limit losses on the account, there is no need to change the "Close_positions_at_percentage_of_loss" parameter on each chart. Just open one additional chart, attach this utility and set the desired percentage for closing all trades on the account. The utility has the following function
「Auto FIBO Pro」Crypto_Forex インジケーターは、取引の補助ツールとして最適です。 - インジケーターは、フィボナッチ レベルとローカル トレンド ライン (赤色) を自動的に計算してチャート上に配置します。 - フィボナッチ レベルは、価格が反転する可能性のある重要な領域を示します。 - 最も重要なレベルは、23.6%、38.2%、50%、61.8% です。 - リバーサル スキャルピングやゾーン グリッド取引に使用できます。 - Auto FIBO Pro インジケーターを使用して、現在のシステムを改善する機会も多数あります。 - Info Spread Swap Display があり、接続されている外国為替ペアの現在のスプレッドとスワップを表示します。 - ディスプレイには、アカウントの残高、エクイティ、マージンも表示されます。 - Info Spread Swap Display は、チャートのどのコーナーにも配置できます。 高品質のトレーディングロボットとインジケーターをご覧になるにはここをクリックしてください! これは、この MQL5 ウェブサイ
Mirror chart
Salavat Yulamanov
4.5 (2)
このインジケーターは 1 つのチャートに 2 つの異なるペアを表示し、表示される情報を簡素化するように設計されています。   ターミナルで利用可能なほぼすべての商品(通貨ペアだけでなく、金属や原材料も)を扱うことができます。 あらゆる通貨ペアに対して視覚的な相関手法を使用する機能 サブシンボル。 通貨ペアは色付きのキャンドルで画面に表示されます。 これは同じ相関ペアです。 ミラーリング。 補助通貨。 このインジケーターは 2 種類の相関関係を反映します。 設定 サブシンボル = "USDCHF";   BullBarColor = オレンジレッド;   BearBarColor = 黄色;   color GridColor = 白;   ミラーリング = false;  The indicator displays two different pairs on one chart, designed to simplify the displayed information,   Capable of working with almost all instruments
FREE
The indicator displays signals according to the strategy of Bill Williams on the chart. Demo version of the indicator has the same features as the paid, except that it can work only on a demo account . Signal "First Wise Man" is formed when there is a divergent bar with angulation.  Bullish divergent bar - with lower minimum and closing price in the upper half. Bearish divergent bar - higher maximum and the closing price at the bottom half. Angulation is formed when all three lines of Alligator
FREE
Vanda FX
Sayan Vandenhout
5 (2)
Vanda FX USES THE TREND WAVE INDICATOR AND IT CAN IDENTIFY THE BEGINNING AND THE END OF A NEW WAVE TREND MOVEMENT. AS AN OSCILLATOR, THE INDICATOR IDENTIFIES THE OVERBOUGHT AND OVERSOLD ZONES. IT WORKS GREAT TO CATCH THE SHORT TERM PRICE REVERSALS AND USES A MARTINGALE STRATEGY TO CLOSE ALL TRADES IN PROFIT. USE DEFAULT SETTINGS ON H1 OR HIGHER TIME FRAME ON ANY PAIR FOR MORE ACCURATE TRADES WHY THIS EA : Smart entries calculated by 4 great strategies The EA can be run on even a $20000 acc
FREE
Account Info EA It is a tool that presents on the graph all the positions of the account, and specific information concerning the positions, but also the account. It enables the user to have an image of his account at a glance. Use like any expert advisor. You can't attach it in the same chart with other expert advisor. It does not have the ability to open or manage positions. You can attach it on any chart and any timeframe.
FREE
Indicator measures strength of each currency in your list. Main idea: It simply iterates through all combinations of pairs and adds difference between open and close in percent. Parameters: List of currencies - what currencies will be calculated (maximum is 8) Calculation type - from which data will be strength calculated Calculation data input - used as input related to calculation type Symbol suffix - used in case of suffix on symbols, e.g: when your symbols look like EURUSDm, EURUSDmicro etc
FREE
このプロダクトを購入した人は以下も購入しています
Local Trade Copier EA MT4
Juvenille Emperor Limited
4.96 (110)
Local Trade Copier EA MT4 による、驚くほど高速な取引コピーを体験してください。1分で簡単にセットアップできるこの取引コピー機は、同じWindowsコンピュータまたはWindows VPS上の複数のMetaTrader端末間で取引をコピーすることができ、0.5秒未満の高速コピースピードを実現します。 初心者であろうとプロのトレーダーであろうと、 Local Trade Copier EA MT4 には、あなたの特定のニーズに合わせてカスタマイズするための幅広いオプションが用意されています。これは、利益の可能性を高めたい人にとって究極のソリューションです。 今すぐ試してみて、これが市場で最も速くて簡単なトレードコピー機である理由を理解してください。 ヒント: デモアカウントで Local Trade Copier EA MT4 デモバージョンをダウンロードして試すことができます: ここ ダウンロードした無料のデモ ファイルを MT4 >> ファイル >> データ フォルダを開く >> MQL4 >> Experts フォルダに貼り付けて、ターミナルを再起動しま
Exp COPYLOT CLIENT for MT4
Vladislav Andruschenko
4.69 (65)
MetaTrader 4向け 高機能トレードコピーソフト MetaTrader 4 用の、高速・安定・高機能なトレードコピーソフトです。 COPYLOT は、 MetaTrader 4 と MetaTrader 5 間でFX取引をコピーでき、さまざまな口座タイプや運用スタイルに合わせて柔軟に同期できます。 COPYLOT MT4版の対応コピー方式: MetaTrader 4 → MetaTrader 4 MetaTrader 5 Hedge → MetaTrader 4 MetaTrader 5 Netting → MetaTrader 4   MT5版 詳細説明 + DEMO + PDF 購入方法 インストール方法 ログファイルの取得方法 テストと最適化の方法 Expforexの全製品 MetaTrader 5版 を使えば、 MetaTrader 5 → MetaTrader 5 および MetaTrader 4 → MetaTrader 5 のコピーにも対応します: COPYLOT CLIENT for MT5 COPYLOT は、2台、3台、さらには10台規模のターミナル環境でも
Trade Manager EAへようこそ。これは、取引をより直感的、正確、そして効率的にするために設計された究極の リスク管理ツール です。これは単なるオーダー実行ツールではなく、包括的な取引計画、ポジション管理、リスク管理のためのソリューションです。初心者から上級者、迅速な実行を必要とするスキャルパーまで、Trade Manager EAはあらゆるニーズに対応し、為替、指数、商品、暗号通貨などさまざまな市場で柔軟に対応します。 Trade Manager EAを使用すると、複雑な計算が過去のものになります。市場を分析し、エントリーポイント、ストップロス、テイクプロフィットのレベルをチャート上のラインでマークし、リスクを設定するだけで、Trade Managerが最適なポジションサイズを即座に計算し、SLとTPをピップ、ポイント、口座通貨でリアルタイムに表示します。すべての取引が簡単かつ効果的に管理されます。 主な機能: ポジションサイズ計算機 :定義されたリスクに基づいて取引サイズを瞬時に決定します。 簡単な取引計画 :エントリー、ストップロス、テイクプロフィットを設定するためのド
Trade Assistant MT4
Evgeniy Kravchenko
4.43 (197)
取引 ごとのリスクの 計算、新規注文 の 簡単 な 設置、部分的 な 決済機能 を 持 つ 注文管理、 7 種類 のトレーリングストップなど 、便利 な 機能 を 備 えています 。 追加の資料と説明書 インストール手順 - アプリケーションの手順 - デモアカウント用アプリケーションの試用版 ライン機能 チャート上にオープニングライン、ストップロス、テイクプロフィットを表示します。この機能により、新規注文を簡単に設定することができ、注文を出す前にその特徴を確認することができます。   リスク計算 リスク計算機能は、設定されたリスクとストップロス注文のサイズを考慮して、新規注文のボリュームを計算します。ストップロスの大きさを自由に設定できると同時に、設定したリスクを守ることができます。 Lot calc ボタン - リスク 計算 を 有効 / 無効 にします 。 Risk フィールドでは 、必要 なリスクの 値 を 0 から 100 までのパーセンテージまたは 預金通貨 で 設定 します 。 設定」 タブで 、 リスク 計算 の 種類 を 選択 します :「 $ 通貨」、「 % 残
取引したい主要エリアを特定したら、サポートとレジスタンス、または供給と需要のゾーンを自動的に取引します。この EA を使用すると、1 回のクリックで買いゾーンと売りゾーンを描画し、価格が反転すると予想される場所に正確に配置できます。EA はそれらのゾーンを監視し、ゾーンに指定した価格アクションに基づいて自動的に取引を行います。最初の取引が行われると、EA は、ターゲット エリアとなる、配置した反対のゾーンで利益を出して終了します。その後、2 つの選択肢があります。取引を終了して新しいゾーンを描画してエントリーするか、利益を出して終了し、すぐに反対方向に取引を反転して、「常に市場に参加する」スタイルの戦略を作成します。 入力と戦略を含む完全なマニュアルはこちら: https://www.mql5.com/en/blogs/post/760256 この EA は、市場で固定またはハード ストップ ロスを使用しないポジション トレーダーまたはドル コスト平均法の取引戦略向けに設計されています。代わりに、次の利用可能なサポートまたはレジスタンス ゾーンで同じ方向に新しい取引を行うことで、
News Filter EA: Advanced Algo Trading Assistant News Filter EA is an advanced algo trading assistant designed to enhance your trading experience. By using the   News Filter EA , you can integrate a Forex economic news filter into your existing expert advisor, even if you do not have access to its source code. In addition to the news filter, you can also specify   trading days   and   hours   for your expert. The News Filter EA also includes   risk management   and   equity protection   features
DrawDown Limiter MT4
Haidar Lionel Haj Ali
5 (8)
Drawdown Limiter EA You are in the right place if you were searching for Drawdown control, Drawdown limiter, Balance protection, Equity Protection or Daily Drawdown Limit related to Prop Firm, FTMO, or Funded account trading, or if you want to protect your trading account. Have you suffered from controlling your drawdown when trading funded accounts? This EA is meant for you. Prop firms usually set a rule called “Trader Daily Drawdown”, and if it is not respected, you are disqualified.  I am an
Support and Resistance Dashboard for MT4 is a multi-timeframe and multi-symbol scanner and alert system that finds S/R zones and pivot points for all timeframes and symbols and alerts when price has interaction with them. If you are using support and resistance (or supply and demand) zones in your trading strategy, this dashboard and its alert and filtering system is a big time saver for you. Download demo version   (works on M 1,M5,M30,W1   timeframes) Full description of scanner parameters ->
無料トライアル版ダウンロード Copy Cat More (コピーキャット・モア) MT4 トレードコピー (Trade Copier) は単なるローカルのトレードコピーではありません。今日のトレード課題のために設計された 完全なリスク管理・執行フレームワーク (risk management and execution framework) です。プロップファーム (prop firm) のチャレンジから個人のポートフォリオ管理まで、堅牢な執行、資金保護、柔軟な設定、高度なトレード処理の組み合わせによって、あらゆる状況に適応します。 このコピーは   マスター (Master、送信側) と スレーブ (Slave、受信側)   の両モードで動作し、成行注文・指値注文、トレードの変更、部分決済、そして両建て決済 (Close By) 操作をリアルタイムで同期します。デモ口座と実口座、トレード用ログインと投資家ログインの両方に対応し、永続的トレードメモリ (Persistent Trade Memory) システムにより、EA・端末・VPS が再起動しても復旧を保証します。一意の
Telegram to MT4 Multi-Channel Copier は、Telegram チャンネルのトレードシグナルを MetaTrader 4 に自動的に直接コピーします。ボットも、ブラウザ拡張機能も、手動コピーも不要。Telegram でシグナルを受信すると、EA が数秒でターミナル上でトレードをオープンします。 本製品は 2 つのコンポーネントで構成されています:Telegram チャンネルを監視する Windows アプリケーションと、MT4 ターミナルでシグナルを実行するこの Expert Advisor です。MT5 版も利用可能です。 セットアップガイドとアプリケーションのダウンロード: https://www.mql5.com/en/blogs/post/768988 動作原理 Windows アプリケーションは、ボットではなくあなた自身の API 認証情報を使用して Telegram に接続します。つまり、プライベートおよび VIP チャンネルを含む、購読しているあらゆるチャンネル、グループ、トピックを読み取ることができます。シグナルを検出すると、それを解析し
Master Close via Telegram can help you perform some management tasks on MT4/MT5 remotely via your Telegram by one click, easy to set up & use. Demo here (see more Master Notify   Master Control  ) ************************************************************************************ LIST OF COMMANDS: info_acc -  Get account info info_pen -   Get pending orders details info_pos -   Get positions details info_pos_sum -   Get positions summary close_pen -   Delete all pending orders close_pos_all -
Strategy Builder offers an incredible amount of functionality. It combines a trade panel with configurable automation (covert indicators into an EA), real-time statistics (profit & draw down) plus automatic optimization of SL, TP/exit, trading hours, indicator inputs. Multiple indicators can be combined into an single alert/trade signal and can include custom indicators, even if just have ex4 file or purchased from Market. The system is easily configured via a CONFIG button and associated pop-up
これは視覚的な取引パネルであり、取引を簡単に配置および管理し、人為的エラーを回避し、取引活動を強化するのに役立ちます。使いやすい視覚的なインターフェースと、健全なリスクおよび位置管理アプローチを組み合わせています。 [ インストールガイド | 更新ガイド | トラブルシューティング | よくある質問 | すべての製品 ] 驚くほど使いやすい チャートから簡単に取引 正確なリスク管理との取引、手間のかからない 資本の保存が最優先事項です 気をつけずに利益を上げましょう できるだけ早くリスクのない取引をお楽しみください 開かれているすべての取引の自動トレーリングストップ 最初のストップロスは、取引が行われるとすぐに配置されます EAは、取引を行った後に次のタスクを実行します。 最初のストップロス/テイクプロフィットは自動的に配置されます できるだけ早くフリーライドにロックします(オプション) ストップロスを初めて損益分岐点に移動します(オプション) 停止するまで、希望の方法を使用してストップロスを追跡します その他のクールな機能は次のとおりです。 優れたターミナルアクティビティレポート
The product will copy all telegram signal to MT4   ( which you are member  ) , also it can work as remote copier.  Easy to set up, copy order instant, can work with almost signal formats, image signal, s upport to translate other language to English Work with all type of channel or group, even channel have "Restrict Saving Content", work with  multi channel, multi MT5 Work as remote copier: with signal have ticket number, it will copy exactly via ticket number. Support to backtest signal. How to
MT4 to Telegram Signal Provider は使いやすく、完全にカスタマイズ可能なツールで、Telegramに信号を送信し、あなたのアカウントを信号提供者に変えることができます。 メッセージのフォーマットは 完全にカスタマイズ可能です! しかし、簡単な使用のために、あらかじめ定義されたテンプレートを選択し、メッセージの特定の部分を有効または無効にすることもできます。 [ デモ ]   [ マニュアル ] [ MT5バージョン ] [ Discordバージョン ] [ Telegramチャンネル ]  New: [ Telegram To MT5 ] セットアップ ステップバイステップの ユーザーガイド が利用可能です。 Telegram APIの知識は必要ありません。開発者が必要なものをすべて提供します。 主要機能 購読者に送信される注文の詳細をカスタマイズする機能 例えばブロンズ、シルバー、ゴールドなど、階層型のサブスクリプションモデルを作成できます。ゴールドサブスクリプションでは、すべての信号が得られますなど。 ID、シンボル、またはコメントによる注文のフ
手動トレードのための、本格的なトレードパネル。正確なエントリーから口座の保護まで、トレードの全工程をチャート上のひとつのウィンドウで完結させます。設定したリスクに正確に合わせてロット数を計算し、RR Tool でチャートに線を引きながらトレードを組み立て、成行注文・待機注文・Grid・OCO を発注できます。ポジションの管理はパネルが引き受けます。最大5段階の分割決済、6種類のトレーリングストップ、建値、Virtual SL/TP を搭載。日次・週次・月次の上限が資金を守り、上限を超えると自動で作動します。 ガイドと無料の Live デモ 無料の Live デモ版はこちらでご利用いただけます ( Free Live Demo )。 製品の操作ガイドはこちらです ( User Manual )。 NT Trade Manager は、トレーダーの作業の流れ全体を、チャート上のコンパクトなパネルひとつにまとめます。ターミナルのウィンドウを行き来する必要も、エントリーのたびに手計算する必要もありません。自分の意思で手動トレードする人のためのツールです。裁量トレーダーからスキャルパー、スイ
TradePanel MT4
Alfiya Fazylova
4.84 (95)
Trade Panelは多機能なトレーディングアシスタントです。アプリには手動取引用の50以上のトレーディング機能が搭載されており、ほとんどの取引作業を自動化することができます。 購入前に、デモアカウントでアプリのデモ版をテストすることができます。デモアカウント用のアプリの試用版をダウンロードするには、次のリンクをご利用ください: https://www.mql5.com/en/blogs/post/750865 。 完全な手順 こちら 。 取引。 ワンクリックで取引操作を行うことができます: リスクを自動計算して指値注文やポジションを開く。 複数の注文やポジションをワンクリックで開く。 注文のグリッドを開く。 保留中の注文やポジションをグループごとに閉じる。 ポジションの方向を反転(Buyを閉じてSellを開く、またはSellを閉じてBuyを開く)。 ポジションをブロックする(不足している量のポジションを開くことでBuyとSellのポジション量を等しくする)。 すべてのポジションを部分的にワンクリックで閉じる。 すべてのポジションの利食い(Take Profit)および損切り(Sto
Trade Manager Ultimate (MT4/MT5) - プロフェッショナル リスク&トレーリング管理システム Trade Manager Ultimate   へようこそ。 これは、手動トレードをより直感的で正確かつ高度に管理可能にするために設計された、究極のリスク管理およびトレーリングソリューションです。単なるダッシュボードではなく、ポジション管理と高度な資金保護を実現する包括的なエンジンです。プロのスキャルパーから長期トレンドトレーダーまで、Trade Manager Ultimate はあなたの戦略に適応し、機関投資家レベルのトレード管理を提供します。 Trade Manager Ultimate を選ぶ理由 高速で変動する市場では、計算ミスや実行の遅れが大きな損失につながる可能性があります。Trade Manager Ultimate はそのような不確実性を排除します。口座情報をリアルタイムで監視し、トレーリングや保護機能をミリ秒単位の精度で実行します。 主な機能 ️ 高度なトレーリングエンジン 個別トレーリング:   各ポジションを独立したトレー
Trade copier MT4
Alfiya Fazylova
4.56 (32)
Trade Copierは、取引口座間の取引をコピーして同期するように設計された専門的なユーティリティです。 コピーは、同じコンピューターまたはvps にインストールされている、サプライヤーのアカウント/端末から受信者のアカウント/端末に行われます。 キャンペーン - すでに「Trade copier MT5」をご購入の方は、「Trade copier MT4」を無料で入手できます(MT4 → MT5 および MT4 ← MT5 のコピー用)。詳細な条件については、どうぞ個別メッセージでお問い合わせください。 購入する前に、デモ アカウントでデモ バージョンをテストできます。 デモ版 こちら 。 詳細な説明は こちら 。 主な機能と利点: MT5ネッティングアカウントを含む、MT4> MT4、MT4> MT5、MT5> MT4のコピーをサポートします。 高いコピー速度(0.5秒未満)。 ベンダーモードと受信者モードは同じ製品内に実装されています。 チャートから直接リアルタイムでコピーを制御できる、簡単で直感的なインターフェイス。 接続が切断されたり、端末が再起動されたりしても、設定と位
Trade Copier Global: The name speaks for itself. This copier allows you to copy orders between MT4 terminals even if they are not installed on the same computer. Features Copying trades between MT4 terminals around the world with a short delay. Automatically recognizes symbol prefixes. Can connect many Slaves to the same Master. Supports pending and market orders. Supports partial order close (with limitations, see below) Can send messages and notifications to the Slaves from the Master Several
目標利益に達した際の自動利益確定 EquityTargetCloser   — は、MetaTrader 5用のユーティリティ型エキスパートアドバイザーです。   エクイティが現在の残高を指定された利益額だけ上回った時点で 、すべての市場ポジションをクローズし、保留注文を削除します。全ポジションをクローズした後、目標は自動的に引き上げられます。新しい閾値 = 新しい残高 + 指定利益。このEAは取引を開始せず、既存のポジションのみを管理し、利益を確実に確定し、蓄積された資金を保護します。 MT5-version:  https://www.mql5.com/en/market/product/169839 仕組み エキスパートアドバイザーは、   エクイティ   を動的な目標値と継続的に比較します。 目標値 =   現在の残高(Balance) + plusMoney   (米ドル)。 エクイティがこの金額以上になると、保護が作動します。   すべての市場ポジション   (全銘柄)をクローズします。 パラメータ   Delete pending orders = true の場合、
コピー機->便利で高速なインターフェースインタラクション、ユーザーはすぐに使用できます     ->>>> WindowsコンピュータまたはVPS Windowsでの使用を推奨 特徴: 多様でパーソナライズされたコピー取引設定:1. 異なるシグナルソースに異なるロットモードを設定できます。2. フォワードコピー取引とリバースコピー取引に異なるシグナルソースを設定できます。3. シグナルはコメントで設定できます。4. 契約ロットに応じてロットを調整するかどうか 多様でパーソナライズされたコピー注文設定2:1.品種ごとに異なるロットモードを設定できます2.順方向コピー注文と逆方向コピー注文に異なる品種を設定できます3.コメントでシグナルを設定できます4.契約ロットに応じてロットを調整するかどうか コメントフィルタリング、MAGICフィルタリング、シグナルロットフィルタリング、ローカル製品フィルタリング 勤務時間設定 逆同期SLAVE終了 注文バインド機能: 任意の注文を設定されたシグナルソース注文にバインドできます (テーブルをダブルクリックして編集します) アカウントリスク管理 基本
Close If Profit or Loss with Trailing for MetaTrader 4 — 総利益または総損失で自動決済 MetaTrader 4 用の実用的な取引管理ツールです。設定した総利益または総損失に到達すると、選択されたポジションを自動的に決済できます。 Expert Advisor は保有中の取引を監視し、含み損益を計算し、Trailing Profit を使用して、手動操作より素早くポジション管理を行うことができます。 MetaTrader 4 は現在でも、裁量トレーダー、スキャルピング、グリッド取引、EA 運用で広く使用されています。しかし、MT4 には複数ポジションを「合計結果」で簡単に自動決済する標準機能がありません。このユーティリティは、その不足している管理機能を追加します。 Close If Profit or Loss with Trailing は、裁量取引、他の Expert Advisors、グリッドシステム、ナンピン、リカバリー戦略、複数シンボルの取引と組み合わせて使用できます。ルールを設定すれば、EA が結果を監視し、条件に到
Auto Trade Copier is designed to copy trades to multiple MT4, MT5 and cTrader accounts/terminals with 100% accuracy. The provider and receiver accounts must be on the same PC/VPS. With this tool, you can copy trades to receiver accounts on the same PC/VPS. All trading actions will be copied from provider to receiver perfectly. This version can be used on MT4 accounts only. For MT5 accounts, you must use Auto Trade Copier for MT5 . Reference: - For MT4 receiver, please download Trade Receiver Fre
Trading History - A program for trading and money management on the history of quotes in stratagy tester. It can work with pending and immediate orders, and is equipped with trailing stop, breakeven and take profit functions. Very good for training and testing different strategies. Manual (Be sure to read before purchasing) Advantages 1. Allows you to test any trading strategy in the shortest possible time 2. An excellent simulator for trading training. You can gain months of trading experience
TelegramからMT4へ: 究極のシグナルコピーソリューション Telegram to MT4 は、DLLを必要とせず、TelegramのチャンネルやチャットからMetaTrader 4プラットフォームに取引シグナルを直接コピーできる最先端のユーティリティです。この堅牢なソリューションは、比類のない精度とカスタマイズオプションにより、シグナルのシームレスな実行を保証し、時間を節約し、効率性を向上させます。 [ Instructions and DEMO ] 主な特徴 直接的なTelegram API統合 電話番号とセキュアコードで認証します。 ユーザーフレンドリーな EXE ブリッジを使用して、チャット ID を簡単に取得および管理します。 複数のチャネル/チャットを追加、削除、更新して、同時に信号をコピーします。 高度なフィルターによる信号解析 カスタム例外語 (例: 「レポート」、「概要」) を含む不要な信号をスキップします。 柔軟な SL および TP 形式 (価格、ピップ、ポイント) をサポートします。 シグナルが価格ではなくポイントを指定する場合、エントリ ポイントを自動
Custom Alerts AIO:マルチマーケット監視を一括で実現 — 設定不要ですぐに使えるインテリジェントツール 概要 Custom Alerts AIO は、追加のインジケーター設定が不要で、インストール後すぐに利用できる高機能マーケットスキャナーです。FX Power、FX Volume、FX Dynamic、FX Levels、IX Power を内部にすべて統合し、主要なすべての資産クラス(為替、金属、指数、暗号資産)を一括監視できます。MetaTrader の仕様により、株式は個別のシンボルとして追加可能ですが、一般的には利用頻度は低めです。 1. なぜ Custom Alerts AIO を選ぶべきか 追加ライセンス不要 • 必要なすべての Stein Investments インジケーターが内蔵されており、すぐに使用可能です。 • チャートに表示されるグラフィックは省略されており、アラート生成に特化した構成です。 市場を広範囲にカバー • 為替、金属、暗号資産、株価指数に対応(株式は手動追加可能)。 • シンボル名を入力する必要はなく、プロパティで資産クラス
MACD Divergence Scanner is a multi-timeframe and multi-symbol dashboard and alert that checks all timeframes and symbols to find regular and hidden divergences between price chart and MACD indicator. This divergence scanner is integrated with support and resistance zones so you can check the MACD divergences in the most important areas of the chart to find trend reversals in the price chart. Download demo version   (works on M 1,M5,M30,W1   timeframes) Full description of scanner parameters ->  
TPSpro リスクマネージャー   は、あらゆるトレーニングとあらゆる資本のトレーダーを対象とした、専門的なリスク管理のユニークなシステムです。取引における損失や取引における重大なミスを回避できます。 TPSpro Risk Manager は、主にスキャルパーやデイトレーダーのリスク管理に必要ですが、あらゆる取引スタイルのトレーダーによって問題なく使用されています。 パネルには 3 つの列があり、それぞれに役立つ情報が含まれています。 最初の列には、当月初めの時点でのアカウントに関する情報が表示されます。つまり、全体的な結果がパーセンテージと入金通貨で表示されます。 2 番目の列には、設定で指定されたその日のリスクが表示されます。 3 番目の列には、現在のアカウントの状況が表示されます。 指定されたリスクを 1 日超えた場合、または注文数を超えた場合、アドバイザーはすべての注文を閉じ、新しい注文のオープンを許可しないため、トレーダーを「感情的な取引」から保護します。 「リスクマネージャー」を使用すると、次のパラメータに従って取引を制御できます。 1日あたりの損失限度額 残高損失
King Trade Copier MT4
Mohammed Maher Al-sayed Mohammed Ahmed Saleh
King Trade Copier MT4 – Lightning-Fast Local Trade Copier (Master + Slave in ONE file) King Trade Copier is a professional local trade copier that mirrors every trading action from one Master account to unlimited Slave accounts on the same PC or VPS — with an internal copy latency of just a few milliseconds. It was built by a real trader for daily real-money use, with one goal: whatever happens on the Master must happen on the Slave, instantly and without exceptions. Watch the demo video to s
作者のその他のプロダクト
RSI Dashboard is a great tool for quickest possible analysis of multiple currency pairs  at the same time in terms of Oversold or Overbought . All displayed and used by indicator symbols are freely to choose and are specified using a space separated list in parameters you're able to analyze not only predetermined ones, but everything that your broker offers, also commodities, equities, indices, ones with prefixes, suffixes etc. There are 3 types of alerts: alert notifications in the MT4 termin
It's a simple but useful tool for creating a grid based on Envelopes. Only 2 parameters can be set: 1) "Period" - the period of all visible Envelopes (i.e. 4) and 1 Moving Average (Envelopes axis), 2) "Deviations Distance" - the distance between Envelopes. Naturally, the colors of all 9 lines can be changed as desired. It works with everything that is available in your Market Watch. Good luck!
FREE
It's a simple but useful tool for creating a grid based on Bollinger Bands . Only 2 parameters can be set: 1) "Period" - the period of all visible Bollinger Bands (i.e. 4) and 1 Moving Average (axis of all Bollinger Bands), 2) "Deviations Distance" - the distance between Bollinger Bands. Naturally, the colors of all 9 lines can be changed as desired. It works with everything that is available in your Market Watch. Good luck!
FREE
Interceptor - professional volume and price extremes indicator. Interceptor is a powerful indicator, which thanks to a combination of four different types of normalized indicators in one algorithm can correctly identify extremes of the price leading to retracements and reversals in the trend. Algorithm is based mainly on combination of Accumulation/Distribution , On Balance Volume , Money Flow Index and Relative Strength Index . The first parameter of Interceptor is Interceptor_Depth which defin
Volume Volatility Dashboard is a great tool for quickest possible analysis of multiple currency pairs in terms of extremely high and extremely low accumulation to distribution ratio in comparison to values from past. The number of displayed symbols is 30 and the name of each symbol can be edited in the parameters, so we are able to analyze not only predetermined currency pairs, but also other ones, commodities, equities, indices, currency pairs with prefixes and suffixes etc... This analyzer is
RSI Pointer is an indicator which simply draws arrows on a chart window when the value of RSI (from parameter RSI_Period) is below RSI_Level (green upward pointing arrow) or above 100-RSI_Level (red downward pointing arrow). RSI Pointer works on all timeframes and all currency pairs, commodities, indices, stocks etc. RSI Pointer has only two parameters, RSI_Period and RSI_Level . For example, if you set RSI_Period=7 and RSI_Level=20, the indicator will draw arrows for values below 20 (oversold)
CCI Pointer is an indicator which simply draws arrows on chart window when value of CCI (from parameter CCI_Period) is above CCI_Level (red downward pointing arrow) or below negative CCI_Level (green upward pointing arrow). CCI Pointer works on all timeframes and all currency pairs, commodities, indices, stocks etc. CCI Pointer has only two parameters, CCI_Period and CCI_Level . For example, if you set CCI_Period=25 and CCI_Level=200 indicator will draw arrows for values below -200 (oversold) an
ADX Pointer is an indicator which is based on "Average Directional Index" and draws three numbers in chart window depending on the value of ADX. In ADX Pointer you can set "ADX_Period" which is of course period of Average Directional Index and you can also set 3 levels. When ADX value exceed first level ("ADX_Level1") in chart window appears number "1", when ADX exceed second level ("ADX_Level2") appears "2" and when ADX exceed third level ("ADX_Level3") appears "3". Simple. ADX Pointer works on
MFI Pointer is an indicator based on Money Flow Index indicator that uses both price and volume to measure buying and selling pressure. Money Flow Index is also known as volume-weighted RSI . MFI Pointer simply draws arrows on chart window when value of Money Flow Index (from parameter MFI_Period) is below MFI_Level (green upward pointing arrow) or above 100-MFI_Level (red downward pointing arrow). Indicator works on all timeframes and all currency pairs, commodities, indices, stocks etc. MFI Po
Spread Display is a simple but very helpful indicator allowing live monitoring of spread in chart window. Using this indicator, there's no need to distract attention never again, seeking current spread value somewhere else. From now on, everything is clear and at the height of your eyes, in chart window of selected currency pair. Indicator has many settings. We can choose any font we want and we can set 3 spread levels ( Spread_Level_1 , Spread_Level_2 and Spread_Level_3 ) between which will cha
Volume Volatility is an indicator which analyzes currency pairs, indices, commodities etc. in terms of extremely high and extremely low accumulation to distribution ratio in comparison to values from past. The most important parameter is "Volume Volatility Factor" - this parameter, in big simplification, determines how far distance in the past is analyzed. The lower value of the parameter, the indicator analyzes less data from the past. I recommend you to set and test e.g. 3, 5, 15, 35, and 48 w
MFI Breakout Dashboard is a tool for multiple currency pairs analysis at the same time in terms of breakout from Oversold or Overbought Zone . Money Flow Index (MFI) uses both price and volume to measure buying and selling pressure. MFI is also known as volume-weighted RSI (Relative Strength Index). The number of displayed symbols is 30 and the name of each symbol can be edited in the parameters. The analyzer is perfect for alert notifications, push notifications and email alerts. We can also se
MFI Extremes Dashboard is a great tool for quickest possible analysis of multiple currency pairs in terms of Oversold or Overbought at the same time. Money Flow Index (MFI) uses both price and volume to measure buying and selling pressure. MFI is also known as volume-weighted RSI (Relative Strength Index). The number of displayed symbols is 30 and the name of each symbol can be edited in the parameters, so we are able to analyze not only predetermined currency pairs, but also other ones, commodi
Technical Dashboard is a great tool for quickest possible analysis of multiple currency pairs in terms of coherent conditions of 4 different indicators at the same time. The number of displayed symbols is 30 and the name of each symbol can be edited in the parameters, so we are able to analyze not only predetermined currency pairs, but also other ones, commodities, equities, indices, currency pairs with prefixes and suffixes etc. This analyzer is perfect for alert notifications through the MetaT
Closing Orders At Specified Time is a utility which helps you to close opened orders and delete pending orders at a specified time - especially when you cannot be online and do it by yourself at that time. You can schedule a specific time for closing orders, and additionally you can choose what type of orders should be closed (all, only opened or only pending), what symbols (all or you can enter names of three symbols) and with what Magic Number. You can also select to close only profitable or o
フィルタ:
Richard Jehl
1701
Richard Jehl 2017.02.21 01:15 
 

Dominik's projects and tools are among the most interesting and valuable over here, and the price is fair. First 5 trades using this dashboard were winners. But I still need to build a precise system as regard to SL and TP, and test on the long term. Thank you Dominik.

Johan Michel Struijk
247
Johan Michel Struijk 2017.02.16 16:57 
 

Awesome tool, great support and a great guy. I made 126% profit in a month because of his tools!

fabbry72
1389
fabbry72 2016.12.04 16:09 
 

Great dashboard very accurate,

together only two simple MA and PA in one months I made +40%

Profitable trading doesn't need complicated strategies: the right way is keep things extremely simple.

Good job Dominik !!

Fab.

schweizer
47
schweizer 2016.08.03 11:51 
 

ユーザーは評価に対して何もコメントを残しませんでした

khoopla
22
khoopla 2016.07.29 17:59 
 

ユーザーは評価に対して何もコメントを残しませんでした

レビューに返信