Inverse FairValue Gaps

Inverse Fair Value Gaps (FVG) Indicator

Overview

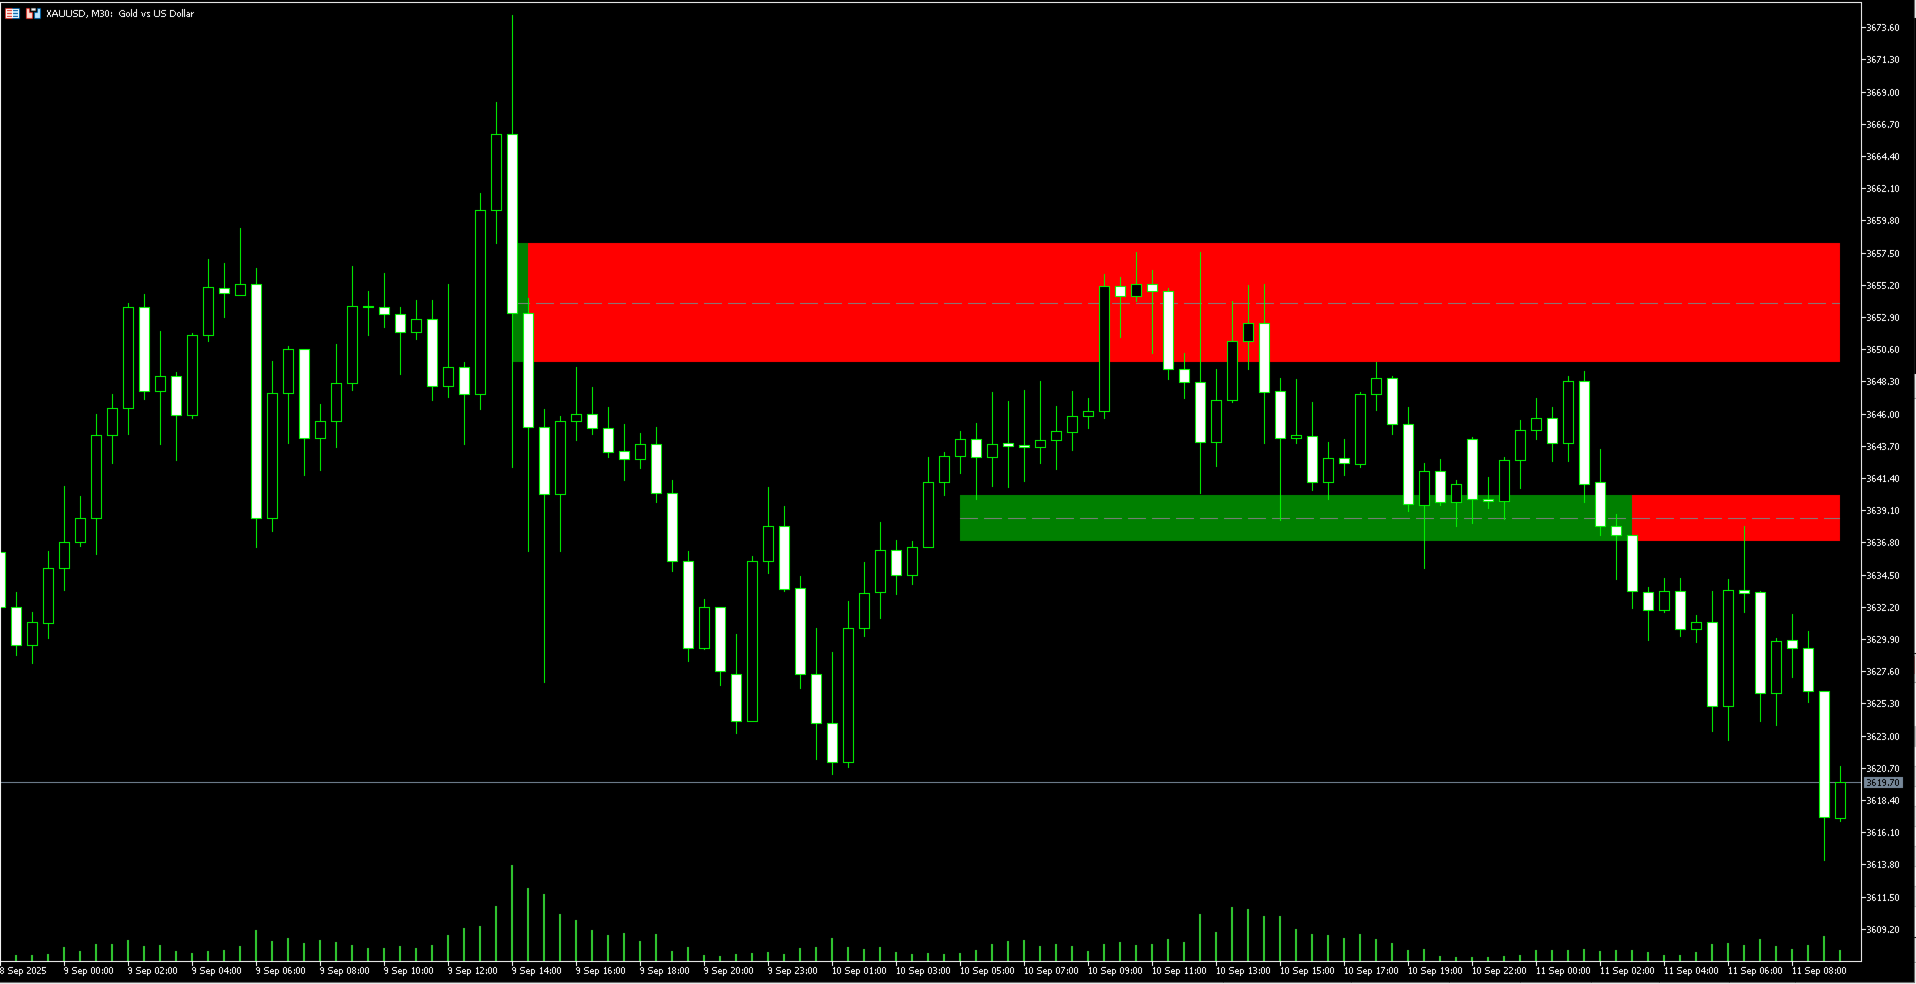
The Inverse Fair Value Gaps (FVG) indicator is an advanced technical analysis tool that identifies and tracks Fair Value Gaps and their subsequent inversions on your trading charts. This powerful indicator helps traders spot potential reversal opportunities by monitoring when price action invalidates existing Fair Value Gaps and creates inverse trading signals.

What are Fair Value Gaps?

Fair Value Gaps (FVGs) are price inefficiencies that occur when there's a gap between consecutive candles, typically during strong momentum moves. These gaps often get filled as the market seeks to return to fair value. The Inverse FVG concept takes this one step further by identifying when these gaps are violated and potentially signal trend reversals.

Key Features

🎯 Intelligent FVG Detection

  • Automatically identifies bullish and bearish Fair Value Gaps in real-time
  • Uses ATR (Average True Range) filtering to eliminate noise and focus on significant gaps
  • Customizable ATR multiplier for fine-tuning sensitivity

🔄 Inversion Tracking

  • Monitors when price violates existing FVGs and creates inverse conditions
  • Tracks the evolution of FVGs from creation to inversion
  • Visual distinction between original FVGs and their inversions

🚨 Smart Signal Generation

  • Generates buy/sell signals when price interacts with inverted FVGs
  • Configurable signal preference: Close price or Wick-based signals
  • Real-time alerts notify you of potential trading opportunities

🎨 Advanced Visualization

  • Color-coded boxes showing original FVGs and their inversions
  • Dashed midline for precise entry/exit reference points
  • Signal arrows marking exact entry points
  • Customizable colors for bullish, bearish, and midline elements

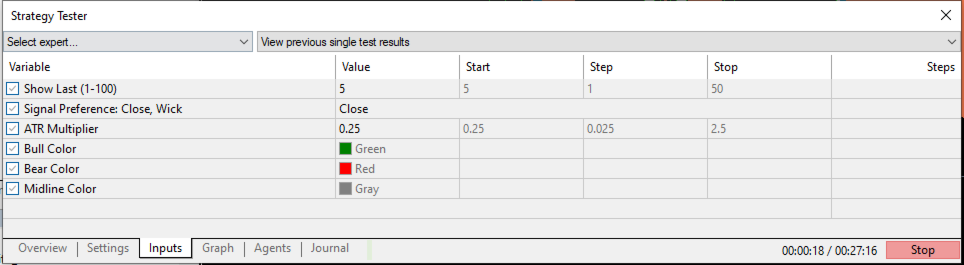
⚙️ Flexible Configuration

  • Display Control: Show last 1-100 FVG inversions (default: 5)
  • Signal Type: Choose between "Close" or "Wick" based signals
  • ATR Multiplier: Adjust sensitivity (default: 0.25)
  • Color Customization: Bull, Bear, and Midline colors
  • Buffer Management: Efficient memory usage with configurable buffer sizes

How It Works

  1. FVG Detection: The indicator scans price action to identify qualifying Fair Value Gaps using ATR-based filtering
  2. Gap Tracking: Monitors each FVG until price violates the gap boundaries
  3. Inversion Creation: When a gap is violated, it's moved to the inversion array and changes character
  4. Signal Generation: Provides trading signals when price re-enters the inverted gap zone
  5. Visual Display: Shows the complete evolution from original gap to inversion with clear visual cues

Input Parameters

Parameter Description Default Range
Show Last Number of recent inversions to display 5 1-100
Signal Preference Signal generation method "Close" "Close" or "Wick"
ATR Multiplier Sensitivity filter for gap detection 0.25 0.1-2.0
Bull Color Color for bullish elements Green Any color
Bear Color Color for bearish elements Red Any color
Mid Color Color for midline reference Gray Any color

Trading Applications

🔹 Reversal Trading

Identify potential trend reversal points when price invalidates major Fair Value Gaps

🔹 Support/Resistance Levels

Use inverted FVG zones as dynamic support and resistance areas

🔹 Confluence Analysis

Combine with other technical indicators for higher probability setups

🔹 Risk Management

Use midline levels for precise stop-loss and take-profit placement

Alert System

The indicator features a comprehensive alert system that notifies you when:

  • New bullish signals are generated
  • New bearish signals are generated
  • Includes timestamp and price level information

Performance Features

  • Efficient Memory Management: Smart buffer system prevents memory overflow
  • Optimized Calculations: Processes only new bars for better performance
  • Clean Object Management: Automatic cleanup prevents chart clutter
  • Real-time Updates: Responds immediately to new price data

Installation & Setup

  1. Download and install the indicator in MetaTrader 5
  2. Apply to any timeframe and currency pair
  3. Adjust input parameters according to your trading style
  4. Enable alerts for real-time notifications
  5. Start identifying high-probability reversal opportunities!

Compatibility

  • Platform: MetaTrader 5 only
  • Timeframes: All timeframes (M1 to MN1)
  • Instruments: Forex, Stocks, Commodities, Indices, Cryptocurrencies
  • Minimum History: 200 bars for ATR calculations

Why Choose This Indicator?

✅ Professional Grade: Developed with institutional-quality algorithms ✅ User-Friendly: Easy to understand visual signals ✅ Highly Customizable: Adapt to any trading strategy ✅ Proven Concept: Based on well-established market structure principles ✅ Active Development: Regular updates and improvements ✅ Comprehensive Documentation: Full user guide included

Author Information

Developer: Sandeep Kumar Tiwary Version: 1.00 Copyright: 2025 Website: https://www.mql5.com

Transform your trading with the power of Fair Value Gap analysis and inversion detection. Download the Inverse FVG Indicator today and start identifying high-probability reversal opportunities with precision and confidence!

Try Our Other Expert Advisors (EAs)

🤖 SCALERPRO EA - Advanced scalping robot for high-frequency trading

🤖 ShakaLaka EA - Powerful trend-following automated trading system

🤖 Force Momentum Robot - Momentum-based trading automation

🤖 Gold Order Block Robot - Specialized Gold trading EA using Order Block concepts

Our Other Custom ICT Indicators

📊 Mario Order Blocks - Advanced Order Block detection and analysis

📊 Magic Trend Indicator - Sophisticated trend identification system

Developer Support

💬 Contact the developer directly for personalized support and parameter configuration assistance

Get professional guidance on optimizing the indicator settings for your specific trading style and market conditions.

Disclaimer

Trading involves substantial risk of loss and is not suitable for all investors. Past performance is not indicative of future results. This indicator is a tool for technical analysis and should be used in conjunction with proper risk management and trading strategies.


おすすめのプロダクト
MetaTraderでは、複数の   水平線   を描画し、それぞれの価格レベルを追跡するのは面倒な作業になることがあります。このインジケーターは、価格アラートの設定、サポートとレジスタンスの表示、その他の手動用途のために、等間隔で複数の水平線を自動で描画します。 このインジケーターは、短期間で売買による利益を狙いたい初心者のFXトレーダーに最適です。水平線は、相場がトレンド中またはレンジ相場である場合に、エントリーの可能性があるゾーンを見つける手助けをしてくれます。 機能 入力設定に基づいて、瞬時に複数の水平線を描画可能。 各水平線を区別しやすいように、カラフルなカラーテーマを採用。 複数の取引セッションのレンジを追跡するのに必須のツール。 価格が水平線にタッチした際にアラートを送信。 アラート間に間隔を設定でき、過度な通知を防止。 完全にカスタマイズ可能。 解説 このインジケーターは、入力設定で指定されたデータと指示に従って水平線を描画します。価格がこれらの水平線でどのように反応するかを観察することで、重要なサポート・レジスタンス付近でのトレード機会を見極めることができます。
Mine Farm is one of the most classic and time-tested scalping strategies based on the breakdown of strong price levels. Mine Farm is the author's modification of the system for determining entry and exit points into the market... Mine Farm - is the combination of great potential with reliability and safety. Why Mine Farm?! - each order has a short dynamic Stop Loss - the advisor does not use any risky methods (averaging, martingale, grid, locking, etc.) - the advisor tries to get the most
Trader Propfirm Pro - プロフェッショナルトレーダー3向けのエキスパートアドバイザー ニューラルネットワークベースのシステムを使用して、EAは月間の大きなトレンドを追跡し、その後、小さなタイムフレームでチャート分析を行い、最適なエントリーポイントを見つけます。また、サポートとレジスタンスレベルを通じてエントリーを最適化し、価格の修正に適応し、高精度のグリッドで失われた注文を回復し、利益を最大化します。 Trader Propfirm Proには、高いボラティリティ時に取引を防ぐ内部保護システム、スプレッドフィルター、およびパフォーマンスを最適化するための時間フィルターが含まれています。さらに、毎日の目標設定機能と、引き出しを最小限に抑えるための厳格なリスク管理システムを提供します。 リスクと日次ドローダウンの完全な制御:EAは、日次ドローダウンに基づいた追加のストップフィルターを含んでおり、リスク制限を超えないようにし、トレーダーにアカウントを回復する機会を提供します。 外部インディケーターは、ニューラルシステムによって自動的に調整され、Trader Propfir
FlatBreakout MT5 (Free Version) Flat Range Detector and Breakout Panel for MT5 — GBPUSD Only FlatBreakout MT5   is the free version of the professional FlatBreakoutPro MT5 indicator, specially designed for flat (range) detection and breakout signals on the   GBPUSD   pair only. Perfect for traders who want to experience the unique fractal logic of FlatBreakout MT5 and test breakout signals on a live market without limitations. Who Is This Product For? For traders who prefer to trade breakout of
FREE
ピボットポイントフィボRSJは、フィボナッチレートを使用してその日のサポートラインとレジスタンスラインを追跡するインジケーターです。 この壮大な指標は、フィボナッチレートを使用してピボットポイントを通じて最大7レベルのサポートとレジスタンスを作成します。 価格がこのサポートとレジスタンスの各レベルを尊重する方法は素晴らしいです。そこでは、オペレーションの可能な入口/出口ポイントを認識することができます。 特徴 最大7レベルのサポートと7レベルの抵抗 レベルの色を個別に設定します 入力 ピボットタイプ ピボットフィボRSJ1 =フィボ比1の計算 ピボットフィボRSJ2 =フィボ比2の計算 ピボットフィボRSJ3 =フィボ比3の計算 ピボットフィボクラシック=クラシックピボット計算 最小ピボットレベル ピボット3レベル ピボット4レベル ピボット5レベル ピボット6レベル ピボット7レベル それでも質問がある場合は、ダイレクトメッセージで私に連絡してください: https://www.mql5.com/ja/users/robsjunqueira/
FREE
概要 このインジケーターは、クラシックな ドンチャンチャネル を強化したバージョンで、実践的なトレード機能を追加しています。 標準の3本線(上限、下限、中央線)に加え、 ブレイクアウト を検出し、チャート上に矢印で視覚的に表示します。また、チャートを見やすくするために、 現在のトレンド方向と逆側のラインのみを表示 します。 インジケーターの機能: 視覚的シグナル :ブレイクアウト時にカラフルな矢印を表示 自動通知 :ポップアップ、プッシュ通知、Eメール RSIフィルター :市場の相対的な強弱に基づいてシグナルを検証 カスタマイズ可能 :色、ラインの太さ、矢印コード、RSI閾値など 動作原理 ドンチャンチャネルは次のように計算します: 上限線 :直近N本のクローズ済みローソク足の最高値 下限線 :直近N本のクローズ済みローソク足の最安値 中央線 :最高値と最安値の平均値 上方ブレイクアウト は終値が上限線を超えたときに発生し、 下方ブレイクアウト は終値が下限線を下回ったときに発生します。 インジケーターは以下を行います: 3本のドンチャンラインを描画 方向転換後の最初のブレイクアウト
FREE
https://www.mql5.com/en/users/gedeegi/seller    The GEN indicator is a multifunctional technical analysis tool for the MetaTrader 5 (MT5) platform. It is designed to automatically identify and display key Support and Resistance (S&R) levels and detect False Breakout signals, providing clear and visual trading cues directly on your chart. Its primary goal is to help traders identify potential price reversal points and avoid market traps when the price fails to decisively break through key levels
FREE
Little useful tool - you manually select range on chart by dragging vertical blue lines and indicator shows support and resistance zones for this range and extends them outside of selected range.  Useful for: * Range trading * Range breakout * Range breakout & retest * Good entry during pullback in trend phase when previous high is retested * Good for scalping on short timeframes * Good for trades on longer timeframes around selected important zones like daily high or low
FREE
Statistical Arbitrage Spread Generator for Cointegration [MT5] What is Pair Trading? Pair trading is a market-neutral strategy that looks to exploit the relative price movement between two correlated assets — instead of betting on the direction of the market. The idea? When two assets that usually move together diverge beyond a statistically significant threshold, one is likely mispriced. You sell the expensive one, buy the cheap one , and profit when they converge again. It’s a statistica
FREE
My Pivot is an Indicator based on Pivot Lines and Support-Resistance zones. This Indicator will Plot 11 SR zones including Pivot Line which will definitely help you to understand the exact SR zones of the Market. Steps to Setup the Indicator: Install the Custom Indicator; Set all the Lines Color, Width and Styles; Set visualization to All Timeframe; and DONE It can be used for: All Pairs: Forex, Cryptocurrencies, Metals, Stocks, Indices.  All Timeframe All Brokers All type of Trading S
Auto Fractal Support And Resistance is a powerful multi-timeframe indicator designed for traders who want to trade lower timeframes with higher timeframe accuracy. When your mouse cursor is on a line you can easily see fractal describtion and index of fractal candle  and timeframe of that fractal candle.  This indicator automatically detects H1 and D1 fractal levels and draws clean horizontal support and resistance lines on any lower timeframe chart (M1, M5, M15, M30). Now you can see where the
Support & Resistance indicator is a modification of the standard Bill Williams' Fractals indicator. The indicator works on any timeframes. It displays support and resistance levels on the chart and allows setting stop loss and take profit levels (you can check the exact value by putting the mouse cursor over the level). Blue dashed lines are support level. Red dashed lines are resistance levels. If you want, you can change the style and color of these lines. If the price approaches a support lev
SMC Venom Model BPR インジケーターは、スマート マネー (SMC) コンセプトで取引するトレーダー向けのプロフェッショナル ツールです。価格チャート上の 2 つの主要なパターンを自動的に識別します。 FVG   (フェアバリューギャップ) は、3 本のローソク足の組み合わせで、最初のローソク足と 3 番目のローソク足の間にギャップがあります。ボリュームサポートのないレベル間のゾーンを形成し、価格修正につながることがよくあります。 BPR   (バランス価格範囲) は、2 つの FVG パターンの組み合わせで、「ブリッジ」を形成します。これは、価格がボリュームアクティビティの少ない動きで動くときに、ブレイクアウトしてレベルに戻るゾーンで、ローソク足の間にギャップを作成します。 これらのパターンは、大規模な市場プレーヤーと一般参加者の相互作用が発生するチャート上のボリュームと価格動向の分析に基づいて、トレーダーが主要なサポート/レジスタンス レベル、ブレイクアウト ゾーン、エントリ ポイントを識別するのに役立ちます。 インジケーターは、長方形と矢印の形でパターンを視覚
Girassol Sunflower MT5 Indicator
Saullo De Oliveira Pacheco
4.33 (6)
This is the famous Sunflower indicator for Metatrader5. This indicator marks possible tops and bottoms on price charts. The indicator identifies tops and bottoms in the asset's price history, keep in mind that the current sunflower of the last candle repaints, as it is not possible to identify a top until the market reverses and it is also not possible to identify a bottom without the market stop falling and start rising. If you are looking for a professional programmer for Metatrader5, please
FREE
Overview The Breakout and Retest indicator is designed to identify potential trading opportunities by detecting price breakouts from significant support and resistance levels followed by a retest of the broken level. How it Works The indicator analyzes price data to determine key support and resistance areas. When the price decisively breaks through one of these levels and then retest it, then  a potential breakout is signaled when it breakout again. To increase the probability of a successful t
数列の一つに「森林火災数列」があります。これは、最も美しい新しいシーケンスの 1 つとして認識されています。その主な特徴は、このシーケンスが線形トレンドを回避することです。最短のものであってもです。この指標の基礎を形成したのはこのプロパティです。 財務時系列を分析する場合、この指標は可能なすべての傾向オプションを拒否しようとします。そして失敗した場合にのみ、トレンドの存在を認識し、適切なシグナルを発します。このアプローチにより、新しいトレンドの始まりの瞬間を正しく判断できます。ただし、偽陽性の可能性もあります。それらの数を減らすために、このインジケーターに追加のフィルターが追加されました。新しいバーが開くとシグナルが生成されます。いずれの場合も再描画は発生しません。 指標パラメータ: Applied Price   - 適用価格定数; Period Main   - インディケータのメイン期間、その有効な値は 5 ~ 60 です。 Period Additional   - 追加の期間。このパラメーターの有効な値は 5 ~ 40 です。 Signal Filter   - 追加の信号
RENKO PRICE ACTION ATRは、レンコチャートの作成を通じて開発された「エキスパートアドバイザー」であり、各BRICKは、ユーザーが選択した期間のATRによって計算されたサイズを持ちます。 レンコチャートは、マイナーな価格変動を除外するように設計されているため、トレーダーは重要なトレンドに集中しやすくなります。 価格動向の検出効率が高いため、支持と抵抗、および上下の相違を明確に識別して、取引機会をより有効に活用することもできます。 手術 RENKO PRICE ACTION ATRは、どの通貨ペアでも機能します。 RENKO PRICE ACTION ATRは、優れたリアルタイム更新パフォーマンスを備えています。 設定 ATR計算時間枠:ATRの平均を適用し、各BRICKのサイズを計算/再計算するためのRENKO PRICE ACTIONATRのユーザー選択期間。 ATR計算平均化期間:各BRICKのサイズ計算を実行するためのRENKO PRICE ACTIONATRのATR平均化のユーザー選択期間。 ATRサイズのパーセンテージ:各BRICKの形成に使用される計
Best SAR MT5
Ashkan Hazegh Nikrou
4.33 (3)
説明 :  外国為替市場(PSAR)で専門的で人気のあるインジケーターの1つに基づいた新しい無料インジケーターをご紹介します。このインジケーターは元のパラボリックSARインジケーターの新しい変更です。プロSARインジケーターでは、ドットと価格チャートのクロスオーバーを見ることができます。クロスオーバーはシグナルではありませんが、動きの終わりの可能性について話します。新しい青いドットで購入を開始し、最初の青いドットの1 atr前にストップロスを配置し、最後にドットが価格チャートを横切るとすぐに終了できます。 売買シグナルを開く方法は? 最初の青い点によるオープンバイトレードと最初の赤いドットによるオープンセルトレード 正しいストップロスはどこにありますか? 安全なストップロスは最初のドットにある可能性があります(最初の青いドットの買いの場合と最初の赤い点の売りの場合) 正しいテイクプロフィットはどこにありますか? テイクプロフィットはストップロス距離とRRに基づいて調整できるので、私の提案は2 RRで、ストップロスの2倍です。 利益を上げているのにtpを達成できなかった場合
FREE
**Bneu Prop Firm Challenge Manager** is a trading utility for MetaTrader 5 designed to assist traders participating in proprietary trading firm evaluation challenges. This free version monitors account metrics, tracks challenge progress, and displays rule compliance status with pre-configured prop firm presets. **Free Version Features** **Prop Firm Presets** - Pre-configured rule sets for common proprietary trading firms - FTMO preset with corresponding rule parameters - MyForexFunds (MFF) pr
FREE
Supply and Demand Indicator + FREE Currency Strength Meter ADD-ON Looking for a powerful tool that can help you identify the most reactive zones in the forex market? Our supply and demand indicator for MetaTrader 4 and 5 is exactly what you need. With its advanced algorithms and real-time analysis, this indicator helps traders of all experience levels make informed trading decisions. The supply and demand indicator is a cutting-edge tool that helps traders identify areas where buyers and sellers
Indicator Name: Fibaction – price action candle Detector Description: Fibo Signal Boxes is a powerful Smart Money Concept (SMC)-inspired indicator that auto-detects price action candles. bullish hammers and shooting stars, then draws precise Fibonacci entry zones and multiple take-profit levels directly on the chart. as for the SL personally i use 40 pips rules  Key Features: Detects bullish hammer and shooting star reversal candles. Automatically draws Fibonacci entry and TP boxes. as
回帰取引を意味する専門的かつ定量的なアプローチを実装する独自の指標。これは、価格が予測可能かつ測定可能な方法で迂回して平均に戻るという事実を利用しており、非定量的な取引戦略を大幅に上回る明確な出入りルールを可能にします。 [ Installation Guide | Update Guide | Troubleshooting | FAQ | All Products ] 明確な取引シグナル 驚くほど簡単に取引できます カスタマイズ可能な色とサイズ パフォーマンス統計を実装します ほとんどの取引戦略を上回ります 適切なSLおよびTPレベルを表示します 電子メール/音声/視覚アラートを実装します 使い方 インディケータは、より高い時間枠からの完全にカスタマイズ可能な移動平均の周りの標準偏差を測定し、トレンドフォローアプローチを使用して正確に取引を見つけます。取引は、現在のチャートの価格アクションに飛び込むことによって見つけられ、価格が選択したより高い時間枠から計算された平均価格帯に戻ったときに閉じられます。それがコード化される方法のために、指標は高ボラティリティと強いトレンドの市場か
Taylor Pivot
Pablo Filipe Soares De Almeida
注意事項: 本インジケーターは Taylor Pivot のみを表示 します。 ROC インジケーターは含まれておらず 、個別には表示されません。 Taylor Pivot  は、もともと Taylor によって開発され、その後プロのトレーダーである Linda Raschke が著書の中で広めた、古典的な短期トレード手法に基づいたインジケーターです。Raschke はこのアプローチを、短期的な市場の方向性をシンプルに特定する方法として強調しており、1 日あたり 1 回のポジション判断(買いまたは売り)に集中することで、頻繁なデイトレードと比べて心理的ストレスを軽減できるとしています。中心となる考え方は、翌セッションでの継続やフォロースルーを想定し、日足のクローズ時点でポジションを構築することで、初期の反転やマーケットテストを活用し、利益の出ているトレードをオーバーナイトで保有して追加の値動きを捉えることです。 この手法の核となるのは、日足タイムフレームにおける 2 期間の Rate of Change(ROC)から算出される短期ピボットポイントの計算です。このピボットは、直近の終値
Bounce Zone MT5
Nguyen Thanh Cong
4.56 (9)
Introduction The Bounce Zone indicator is a cutting-edge non-repainting technical tool built to identify key areas on the price chart where market sentiment is likely to cause a significant price reversal. Using advanced algorithms and historical price data analysis, this indicator pinpoints potential bounce zones. Combined with other entry signal, this indicator can help forex traders place the best trades possible Signal A possible buy signal is generated when price is in the green zone an
FREE
概要 Auto Fibo Trend Signalは、裁量トレーダーの環境認識とエントリー判断を直感的にサポートするために開発された多機能分析インジケーターです。 チャート上に表示されるインタラクティブなダッシュボードを通じて、各種テクニカル指標の制御やパラメータ変更をシームレスに行うことができます。プロパティ画面を毎回開く手間を省き、相場状況に合わせた柔軟な分析が可能です。 主な機能と特徴 インタラクティブダッシュボード チャート上に配置された専用パネルから、各インジケーターのオンオフや期間の変更を直接行うことができます。パネルはドラッグして好きな位置に移動できるほか、最小化してチャートの視界を確保することも可能です。 統合シグナルエンジン SMA(単純移動平均線)、MACD、RSI、ボリンジャーバンドの4つの代表的なテクニカル指標を統合しています。ダッシュボードで有効にしているすべての指標の条件が一致した箇所でのみ、チャート上に売買シグナル(矢印)と損切り・利益確定の目安ラインを発生させます。 ライブパフォーマンス表示 発生したシグナルに基づく仮想トレードの勝敗を記録し、ダッシュ
FREE
これは、価格ラベル付きのAdvanced ZigZagDynamic および/または ExtendedFractals インジケーターの極値に基づくサポートおよびレジスタンスレベルのMTFインジケーターです(無効にすることができます)。 MTFモードでは、より高いTFを選択できます。デフォルトでは、レベルはZigZagインジケータードットに基づいて生成されます。フラクタルインジケータードットは、ZigZagと一緒に、またはその代わりに使用することもできます。使用を簡素化し、CPU時間を節約するために、計算はバーの開口部ごとに1回実行されます。 パラメーター: ForcedTF-レベル計算のチャート時間枠(現在の時間枠と等しいか、それを超える場合があります) MinPipsLevelWidth-ポイント単位の最小レベル幅(非常にタイトなレベルに使用) Use ZigZag Extremums points -ZigZagピークを使用してサポート/抵抗レベルを計算することを有効/無効にします Fixed pips range -ジグザグインジケーターを計算するための最小値と最大値の間の距離
こんにちは。トレーダーにとって最大の悩みの一つを解決するために、ここに来ました。 価格チャートを開いて分析を始めると、大きな問題が発生します。 MetaTrader 5で様々なウィンドウや時間枠を切り替え、トレンドライン、注文ブロック、そして様々な静的・動的ラインを描画して市場を理解しようとします。 これは非常に面倒で、時には誤解を招くこともありました。そこで、これらの問題をすべて解決し、特定の時間枠で必要な情報をすべて表示するシステムを設計しようと考えました。 このシステムを使えば、価格チャートをクリックするだけで、お好みの時間枠で様々な時間枠のトレンドや注文ブロック(OB)を簡単に確認できます。 価格チャートには2つの表が表示されます。1つは必要な一般情報を提供し、もう1つはチャートをクリックするだけでツールの機能に簡単にアクセスできる表です。 FARMAN TREND LINE - ダイナミックモードでは、ATR、ポジション流動性、注文ブロックといった複数のパラメータに基づいて非常に複雑な計算を行い、高・低時間枠との比較を行い、価格チャートに表示します。 - このツールの
Long&Short Cointegration Analyzer An advanced tool for traders looking to profit from cointegration. Analyzes any asset pair for Long&Short strategies. What does the Long&Short Cointegration Analyzer do? Identifies cointegrated pairs that revert to the mean, ideal for profitable trades. Provides a detailed panel with statistical data for confident decisions. Works with any currency pair, on any timeframe. Find buying and selling opportunities based on cointegration. Minimize risks with a relia
Overview Heiken Ashi CE Filtered MT5 is a technical indicator for the MetaTrader 5 platform. It integrates smoothed candlestick charting with a dynamic exit strategy and a customizable trend filter to deliver clear buy and sell signals. The indicator is designed to improve trend detection and signal reliability by reducing market noise. If you want to see more high-quality products or order the development/conversion of your own products, visit my partners' website: 4xDev Get 10% OFF on manual
Adaptive Trend Lines
Henri Salvatore Bigatti
4.76 (25)
This indicator shows the TLH and TLL and some trendlines that allow us to estimate the trend of market.  It also shows the values of the angles of the lines in percentage in points (pip) , the standard deviation, and the trend of each line, and when it breaks the lines of support and resistance (TLH and TLL). And finally, it also shows the points identified as supports and resistances through the fractal algorithm in the graph. The high and low trend lines are supported by the highs and lows, th
FREE
このプロダクトを購入した人は以下も購入しています
ARICoin is a powerful trading companion designed to generate high-probability entry signals with dynamic TP/SL/DP levels based on volatility. Built-in performance tracking shows win/loss stats, PP1/PP2 hits, and success rates all updated live. Key Features: Buy/Sell signals with adaptive volatility bands Real-time TP/SL/DP levels based on ATR Built-in MA Filter with optional ATR/StdDev volatility Performance stats panel (Success, Profit/Loss, PP1/PP2) Alerts via popup, sound, push, or email Cust
AriX
Temirlan Kdyrkhan
1 (4)
AriX Indicator for MT5 A powerful trend-following and signal-evaluation tool AriX is a custom MT5 indicator that combines Moving Averages and ATR-based risk/reward logic to generate clear buy/sell signals. It visualizes dynamic SL/TP levels, evaluates past trade outcomes, and displays win/loss statistics in a clean on-chart panel. Key features include: Buy/Sell signals based on MA crossovers ATR-based SL/TP1/TP2/TP3 levels with visual lines and labels Signal outcome tracking with real-time stat
このインジケーターを購入された方には、以下の特典を 無料 で提供しています: 各トレードを自動で管理し、ストップロスとテイクプロフィットを設定し、戦略ルールに基づいてポジションを決済する補助ツール 「Bomber Utility」 様々な銘柄に合わせたインジケーターの設定ファイル(セットファイル) 「最小リスク」、「バランスリスク」、「待機戦略」 の3つのモードで使用できる Bomber Utility 用の設定ファイル このトレーディング戦略をすぐに導入・設定・開始できる ステップバイステップのビデオマニュアル ご注意: 上記の特典を受け取るには、MQL5のプライベートメッセージシステムを通じて販売者にご連絡ください。 オリジナルのカスタムインジケーター 「Divergence Bomber(ダイバージェンス・ボンバー)」 をご紹介します。これは、MACDのダイバージェンス(乖離)戦略に基づいた 「オールインワン」型のトレーディングシステム です。 このテクニカルインジケーターの主な目的は、価格とMACDインジケーターの間に発生するダイバージェンスを検出 し、将来の価格の動きを示す
Market Flow Pro Market Flow Pro is an intelligent trading advisor for the MetaTrader 5 platform, designed for automatic trading on financial markets using algorithmic analysis and strict risk management. -Key features: - Fully automatic trading 24/5 - Adaptive trend and momentum entry algorithm -  Built-in risk management - Flexible lot settings (fixed/auto-calculation) - Support for major currency pairs and indices - Optimised for operation on various timeframes  How it works Market
優れたテクニカルインジケーター「Grabber」をご紹介します。これは、すぐに使える「オールインワン」トレーディング戦略として機能します。 ひとつのコードに、市場のテクニカル分析ツール、取引シグナル(矢印)、アラート機能、プッシュ通知が強力に統合されています。 このインジケーターを購入された方には、以下の特典を無料で提供します: Grabberユーティリティ:オープンポジションを自動で管理するツール ステップバイステップのビデオマニュアル:インジケーターのインストール、設定、取引方法を解説 カスタムセットファイル:インジケーターをすばやく自動設定し、最大限の成果を出すための設定ファイル 他の戦略はもう忘れてください!Grabberだけが、あなたを新たなトレードの高みへと導いてくれるのです。 Grabber戦略の主な特徴: 推奨タイムフレーム:M5〜H4 対応通貨ペア・資産:どれでも使用可能ですが、私が実際に検証した以下を推奨します(GBPUSD、GBPCAD、GBPCHF、AUDCAD、AUDUSD、AUDSGD、AUDCHF、NZDUSD、NZDCAD、EURCAD、EURUSD、E
このインジケーターは、反転ポイントと価格戻りゾーンを正確に表示します。     主要プレーヤー 。新たなトレンドが形成される場所を把握し、最大限の精度で意思決定を行い、すべての取引をコントロールします。 TREND LINES PRO インジケーターと組み合わせることで、その潜在能力を最大限に発揮します。 VERSION MT4 インジケーターが示す内容: 新しいトレンドの始まりに活性化する反転構造と反転レベル。 リスクと報酬の比率を最小限に抑えた利益 確定 と 損失停止の レベルの表示     RR 1:2   。 インテリジェントな削減ロジックによるストップロス。 指定されたインジケーターから 2 つのトレンド タイプの反転パターンを表示します。 指標: トレンドを追う   TREND LINES PRO   (世界的なトレンドの変化) TREND PRO   (クイックトレンド変更) シンプルで効果的   スキャナー   リアルタイムトレンド(新機能)。 マルチタイムフレームのインストゥルメント フィルタリング。 画面   利益     LOGIC AI信号の後。 当日プラス方
Quantum TrendPulse を ご紹介します。これは、   SuperTrend   、   RSI   、および Stochastic のパワーを 1 つの包括的なインジケーターに組み合わせて、取引の可能性を最大限に引き出す究極の取引ツールです。精度と効率を求めるトレーダー向けに設計されたこのインジケーターは、市場のトレンド、勢いの変化、最適なエントリー ポイントとエグジット ポイントを自信を持って特定するのに役立ちます。 主な特徴: SuperTrend 統合: 現在の市場動向に簡単に追従し、収益性の波に乗ることができます。 RSI精度: 買われすぎと売られすぎのレベルを検出し、市場の反転のタイミングに最適で、SuperTrendのフィルターとして使用されます。 確率的精度: 確率的振動を活用して、変動の激しい市場で隠れたチャンスを見つけます。SuperTrend のフィルターとして使用されます。 マルチタイムフレーム分析:   M5 から H1 または H4 まで、さまざまなタイムフレームで市場を常に把握します。 カスタマイズ可能なアラート: カスタム取引条件が満たされ
Azimuth Pro
Ottaviano De Cicco
5 (4)
発売プロモーション Azimuth Proは先着100名様限定で 299ドル でご提供します。最終価格は 499ドル となります。 リテールとインスティテューショナルのエントリーの違いはインジケーターではなく、ロケーションにあります。 多くのトレーダーは、モメンタムを追いかけたり、遅行シグナルに反応して、任意の価格レベルでエントリーします。機関投資家は、需給が実際にシフトする構造的なレベルに価格が到達するのを待ちます。 Azimuth Proはこれらのレベルを自動的にマッピングします:スイングアンカーVWAP、マルチタイムフレーム構造ライン、高確率ロケーションにのみ出現するABCパターン。 Azimuth Proは、構造分析とインテリジェントな自動化の両方を求めるプロフェッショナルトレーダー向けに構築されています。 Azimuthが外科的精度で市場構造をマッピングする一方、Azimuth Proはインテリジェンスレイヤーを追加します:トレーディングスタイルの自動検出、スマート設定された移動平均線、20年のデータでバックテストされた最適化パラメータ。その結果、お使いの銘柄と
RelicusRoad Pro: 定量的市場オペレーティングシステム 【期間限定】無制限アクセス 70% OFF - 2,000人超のトレーダーと共に なぜ多くのトレーダーは「完璧な」インジケーターを使っても失敗するのでしょうか? それは、文脈を無視して 単一の概念 だけでトレードしているからです。文脈のないシグナルは単なるギャンブルです。勝ち続けるには、 根拠の重なり(コンフルエンス) が必要です。 RelicusRoad Proは単なる矢印インジケーターではありません。完全な 定量的市場エコシステム です。独自のボラティリティモデリングを用いて、価格が推移する「適正価値の道(Fair Value Road)」をマッピングし、ノイズと真の構造的ブレイクを判別します。 推測はやめましょう。機関投資家レベルの「ロード・ロジック」でトレードを。 コアエンジン:「Road」アルゴリズム システムの中心となる Road Algo は、市場環境にリアルタイムで適応するダイナミックなボラティリティチャネルです。 安全ライン(平衡点) と、価格が数学的に反転しやすい 拡張レベル を投影します。 Si
これはMT5のインジケーターで、再描画なしで取引に参入するための正確なシグナルを提供します。 外国為替、暗号通貨、金属、株式、インデックスなど、あらゆる金融資産に適用できます。かなり正確な見積もりを提供し、取引を開始して終了するのに最適な時期を教えてくれます。1つのシグナルを処理しただけでインジケーターの元が取れた例の 動画 (6:22)をご覧ください。Entry PointsPro インジケーターの助けを借りたほとんどのトレーダーの最初の1週間の結果が改善しています。 Telegramグループ に登録してください。Entry Points Proインジケーターのメリットは次の通りです。 再描画のないエントリーシグナル 再描画されるインジケーターでは一度表示されたシグナルが削除されて大きな金銭的損失につながることがありますが、これと異なり、表示されて確認されたシグナルは消えることがありません。 エラーなしの取引開始 インジケーターアルゴリズムによって取引を開始する(資産を売買する)理想的な瞬間を見つけることができます。それを使用するすべてのトレーダーの成功率が向上します。 あら
トレンドラインプロ   市場の真の方向転換点を理解するのに役立ちます。この指標は、真のトレンド反転と主要プレーヤーが再び参入するポイントを示します。 分かりますか     BOSライン   複雑な設定や不要なノイズなしに、より長い時間足でのトレンドの変化と重要なレベルを把握できます。シグナルは再描画されず、バーが閉じた後もチャート上に残ります。 MT4バージョン   -   RFI LEVELS PRO インジケーター と組み合わせることで、その最大限の能力を発揮します インジケーターが示す内容: 本当の変化   トレンド(BOSライン) 一度シグナルが現れたら、それは有効です!これは、リペイント機能を持つインジケーターとの重要な違いです。リペイント機能を持つインジケーターは、シグナルを発した後、それを変更し、資金の損失につながる可能性があります。これにより、より高い確率と精度で市場に参入できます。また、矢印が現れた後、目標値(利益確定)に達するか、反転シグナルが現れるまで、ローソク足の色を変更する機能もあります。 繰り返しエントリ   主要プレーヤーの補充 エントリーポイントを探す
ARIPoint is a powerful trading companion designed to generate high-probability entry signals with dynamic TP/SL/DP levels based on volatility. Built-in performance tracking shows win/loss stats, PP1/PP2 hits, and success rates all updated live. Key Features: Buy/Sell signals with adaptive volatility bands Real-time TP/SL/DP levels based on ATR Built-in MA Filter with optional ATR/StdDev volatility Performance stats panel (Success, Profit/Loss, PP1/PP2) Alerts via popup, sound, push, or email Cu
ご紹介     Quantum Breakout PRO は 、ブレイクアウト ゾーンの取引方法を変革する画期的な MQL5 インジケーターです。 13年以上の取引経験を持つ経験豊富なトレーダーのチームによって開発されました。     クォンタム ブレイクアウト プロ   は、革新的でダイナミックなブレイクアウト ゾーン戦略により、あなたのトレーディングの旅を新たな高みに押し上げるように設計されています。 クォンタム ブレイクアウト インジケーターは、5 つの利益ターゲット ゾーンを備えたブレイクアウト ゾーン上のシグナル矢印と、ブレイクアウト ボックスに基づいたストップロスの提案を提供します。 初心者トレーダーにもプロのトレーダーにも適しています。 量子EAチャネル:       ここをクリック 重要!購入後、インストールマニュアルを受け取るためにプライベートメッセージを送ってください。 推奨事項: 時間枠: M15 通貨ペア: GBPJPY、EURJPY、USDJPY、NZDUSD、XAUUSD アカウントの種類: ECN、Raw、またはスプレッドが非常に低い R
CGE Trading Suite
Carl Gustav Johan Ekstrom
5 (1)
CGE Trading Suite delivers the analytical edge typically reserved for professional trading desks. The platform integrates a full suite of analytical tools into one seamless workflow: dynamic grid mapping, liquidity behavior analysis, ECM, trend lines, MIDAS, trade cycles, and directional channel projections. Together, these provide a unified view of market structure and momentum. Directional clarity is further enhanced by the capital flow index, which measures currency basket strength to identif
Bill Williams Advanced is designed for automatic chart analysis using Bill Williams' "Profitunity" system. The indicator analyzes four timeframes at once. Manual (Be sure to read before purchasing) Advantages 1. Analyzes the chart using Bill Williams' "Profitunity" system. Signals are displayed in a table in the corner of the screen and on the price chart. 2. Finds all known AO and AC signals, as well as zone signals. Equipped with a trend filter based on the Alligator. 3. Finds "Divergence Bar
Candle Smart Range
Gianny Alexander Lugo Sanchez
MetaTrader 5用 Candle Smart Range (CSR) Candle Smart Rangeは、複数のタイムフレームで価格レンジを自動的に識別するためのテクニカル指標です。このツールは、ローソク足の形成と、以前の高値・安値との相互作用に基づいて市場構造を分析します。 主な機能: レンジ検出: 勢いのある動きの前のコンソリデーション(保ち合い)ゾーンを特定します。 だまし(フェイクアウト)の識別: 価格が以前の水準を超えたものの、ローソク足の終値基準でレンジ内に戻った場合をマークします。 マルチタイムフレーム分析: カスタム期間を含む最大19のタイムフレームのデータを1つのチャートに表示します。 内部可視化(ズーム): チャートを切り替えずに、上位足のローソク足内部の値動きを確認できます。 時間フィルター: 主要な市場セッションなど、特定の時間帯で動作するように設定可能です。 履歴確認モード: 過去のデータをステップバイステップで確認し、分析できます。 アラート機能: ローソク足の確定や新しいレンジの検出を通知します。 インターフェース: 視覚的な負荷を管理する画面
「 Dynamic Scalper System MT5 」インジケーターは、トレンド波の中でスキャルピング取引を行う手法のために設計されています。 主要通貨ペアと金でテスト済みで、他の取引商品との互換性があります。 トレンドに沿った短期的なポジションオープンのシグナルを提供し、追加の価格変動サポートも提供します。 インジケーターの原理 大きな矢印はトレンドの方向を決定します。 トレンド波の中では、小さな矢印の形でスキャルピングシグナルを生成するアルゴリズムが機能します。 赤い矢印は強気方向、青い矢印は弱気方向です。 トレンドの方向には敏感な価格変動ラインが描かれ、小さな矢印のシグナルと連動します。 シグナルは次のように機能します。適切なタイミングでラインが現れるとエントリーシグナルが形成され、ラインが開いている間はポジションが保持され、完了すると取引が終了します。 推奨される動作時間枠はM1~H4です。 矢印は現在のローソク足に形成され、次のローソク足が開いている場合は、前のローソク足の矢印は再描画されません。 入力パラメータ Trend Wave Period - トレ
初心者やエキスパートトレーダーに最適なソリューション! このインジケーターは、独自の機能と新しい計算式を取り入れた、ユニークで高品質、かつ手頃な価格のトレーディングツールです。たった1枚のチャートで28の為替ペアの通貨強度を読み取ることができます。新しいトレンドやスキャルピングチャンスの引き金となるポイントを正確に特定することができるので、あなたのトレードがどのように改善されるか想像してみてください。 ユーザーマニュアルはこちら  https://www.mql5.com/en/blogs/post/697384 これが最初の1本、オリジナルだ! 価値のないクローンを買わないでください。 特別な サブウィンドウの矢印で強い通貨の勢いを表示 GAPがあなたのトレードを導く! 基準通貨や気配値が売られすぎ・買われすぎのゾーン(外相フィボナッチレベル)にあるとき、個別チャートのメインウィンドウに警告表示。 通貨がレンジの外側から反落した場合、プルバック/リバーサルのアラート。 クロスパターンの特別なアラート 複数の時間枠を選択可能で、トレンドを素早く確認できます。通貨強度のライン
MetaBands M5
Vahidreza Heidar Gholami
4.5 (2)
MetaBandsは、強力でユニークなアルゴリズムを使用してチャンネルを描画し、トレンドを検出して、トレーダーに取引の入出ポイントを提供することができます。チャンネル指標に加えて、強力なトレンド指標でもあります。入力パラメータを使用して新しいチャンネルを作成するために、異なるタイプのチャンネルを統合することができます。MetaBandsは、市場のイベントについてユーザーに通知するために、すべてのタイプのアラートを使用します。 特徴 ほとんどのチャンネルアルゴリズムをサポート 強力なトレンド検出アルゴリズム 異なるタイプのチャンネルを統合する能力 マルチタイムフレームおよびマルチカレンシー(シグナルマトリックス) すべてのタイプのアラート機能(サウンド、画面フラッシャー、プッシュ通知、メール、ポップアップ、矢印) 再描画しない トレンド検出 MetaBandsは、チャネル内を振動する青いラインを使用してトレンドを検出します。ラインがチャネルの上部バンドに達すると、下降トレンドの開始を示し、下部バンドに達すると上昇トレンドの開始を示します。青いラインが中心ラインに近づくと、市場はコンソリ
自動RR&BOSスキャナー搭載ストラクチャートレンド バージョン: 1.0 概要 自動RRスキャナー搭載ストラクチャートレンドは、プライスアクションとマーケットストラクチャーを重視するトレーダー向けに設計された包括的なトレーディングシステムです。平滑化されたトレンドフィルターとスイングポイント検出、そしてストラクチャーブレイク(BOS)シグナルを組み合わせ、高確率のトレードセットアップを生成します。 このツールの最大の特徴は、自動リスク管理です。有効なストラクチャーブレイクを検出すると、インジケーターはリスク/リワードゾーン(1:1、1:2、1:3)を瞬時に計算・描画し、価格が目標値に到達すると自動的にトレードの視覚化を管理します。これにより、手動で描画ツールを使用する必要がなくなり、トレーダーは執行のみに集中できます。 主な機能 ダイナミック・ストラクチャーブレイク(BOS)検出 スイングハイ(HH/LH)とスイングロー(HL/LL)を自動的に識別します。 価格が主要なストラクチャーレベルをブレイクすると、チャート上にBOSラインを直接描画し、トレンドの方向を確認します。
Gartley Hunter Multi - An indicator for searching for harmonic patterns simultaneously on dozens of trading instruments and on all possible timeframes. Manual (Be sure to read before purchasing) | Version for MT4 Advantages 1. Patterns: Gartley, Butterfly, Shark, Crab. Bat, Alternate Bat, Deep Crab, Cypher 2. Simultaneous search for patterns on dozens of trading instruments and on all possible timeframes 3. Search for patterns of all possible sizes. From the smallest to the largest 4. All fou
まず第一に、この取引ツールはノンリペイント、ノンリドロー、ノンラグの指標であり、プロの取引に理想的ですことを強調する価値があります。 オンラインコース、ユーザーマニュアル、デモ。 スマートプライスアクションコンセプトインジケーターは、新米から経験豊富なトレーダーまで、非常 に強力なツールです。Inner Circle Trader AnalysisやSmart Money Concepts Trading Strategiesなど、20以上の有用な指標を1つに組み合わせています。このインジケーターはスマートマネーコンセプトに焦点を当て、大手機関の取引方法を提供し、彼らの動きを予測するのに役立ちます。 特に、流動性分析に優れており、機関がどのように取引しているかを理解しやすくしています。市場のトレンドを予測し、価格の動きを慎重に分析するのに優れています。機関の戦略とトレードを合わせることで、市場の動向についてより正確な予測ができます。このインジケーターは多目的であり、市場構造を分析し、重要な注文ブロックを特定し、さまざまなパターンを認識するのに優れています。 このインジケーター
Cyclic Impulse MT5 — このテクニカル指標はチャートを構築し、周期的な価格変動を識別します。これにより、反転する周期的な価格変動とエントリーシグナルを見つけることができます。 指標の仕組み 周期的な下降傾向が検出されると、ローソク足が閉じた後に青い下降バーが生成されます。このバーは現在のローソク足上でちらつく場合があり、シグナルはまだ確認されていません。青い矢印は価格チャートに複製されます。 周期的な上昇傾向が検出されると、ローソク足が閉じた後に赤い上向きバーが生成されます。このバーは現在のローソク足上でちらつく場合があり、シグナルはまだ確認されていません。オレンジ色の矢印は価格チャートに複製されます。 あらゆるチャート、時間枠、取引商品で使用できます。 複数のアラートタイプ。 価格チャートに追加の矢印を表示。 履歴データの再描画は行わず、ローソク足の終値に基づいて機能します。ローソク足が閉じても、矢印またはバーは消えません。 使いやすく、パラメータの設定も簡単で、不要な情報でチャートが乱雑になることはありません。 異なるパラメータを持つ2つのインジケーターを使用
このインジケーターは、市場で 関心が示されたゾーン をハイライトし、その後に 注文の蓄積ゾーン を表示します。 これは、大規模な**板情報(オーダーブック)**のように機能します。 これは、 巨大な資金 のためのインジケーターです。その性能は卓越しています。 市場にどんな関心が存在していても、 必ず目に見えるようになります 。 (これは 完全に再設計され、自動化されたバージョン です。もはや手動分析は必要ありません。) トランザクションスピード(取引速度) は新しい概念のインジケーターで、市場で大口注文が どこに・いつ 集中しているかを示し、それに基づいたチャンスを提供します。 トレンドの変化を 非常に早い段階 で察知することができます。 FXでは「出来高」と呼ばれているものは誤解されています。実際には、これは 時間あたりの価格変動量 です。したがって、正しい名称は トランザクションスピード です。 考え方・行動・分析の仕方すべてが問われます。 分析パラダイムの転換は非常に重要です。 このインジケーターは、FXにおける出来高の考え方を 根本から再定義 し、論理的な形で正確に活用する、
Ultimate SMC Indicator
Hicham Mahmoud Almoustafa
1 (1)
ULTIMATE SMC INDICATOR — PRO EDITION     Trade Like Institutional Traders Are you tired of losing trades because you don't  know WHERE the big money is positioned? The Ultimate SMC Indicator reveals the hidden  footprints of banks and institutions directly on  your chart — giving you the edge that professional  traders use every day. WHAT IS SMC
The Trend Forecaster indicator utilizes a unique proprietary algorithm to determine entry points for a breakout trading strategy. The indicator identifies price clusters, analyzes price movement near levels, and provides a signal when the price breaks through a level. The Trend Forecaster indicator is suitable for all financial assets, including currencies (Forex), metals, stocks, indices, and cryptocurrencies. You can also adjust the indicator to work on any time frames, although it is recommen
BTMM State Engine Pro — the   all-in-one Banks   & Institutions Market Maker indicator for Meta Trader 5. Built for   BTMM traders who follow the Asian   session breakout methodology with Kill Zone timing , level stacking, peak formation detection , and multi-pair scanning — all   from a single chart. Combines   a full BTMM State Engine   with a built-in multi-pair Scanner dashboard, eliminating the need to flip between charts or run multiple indicators. WHAT IT DOES Automatically detec
Super Scalp Indicator MT5  is a unique  trend reversal  100% non-repainting  multi-algo indicator that can be used on all symbols/instruments:   forex,   commodities,   cryptocurrencies,   indices,   stocks .  Super Scalp Indicator MT5  will determine the current trend at its early stages, gathering information and data from up to 10 standard algos When indicator give a valid buy or sell signal, a corresponding arrow will be printed on the chart, open trade at start of the next candle/bar indic
Berma Bands
Muhammad Elbermawi
5 (8)
Berma Bands (BBs) インジケーターは、市場のトレンドを特定して活用したいトレーダーにとって貴重なツールです。価格と BBs の関係を分析することで、トレーダーは市場がトレンド段階にあるか、レンジ段階にあるかを判断できます。 詳細については、[ Berma Home Blog ] をご覧ください。 バーマ バンドは、上部バーマ バンド、中部バーマ バンド、下部バーマ バンドの 3 つの異なる線で構成されています。これらの線は価格の周りにプロットされ、全体的な傾向に対する価格の動きを視覚的に表します。これらのバンド間の距離から、ボラティリティや潜在的な傾向の反転についての洞察を得ることができます。 バーマ バンドの線がそれぞれ離れると、市場が横ばいまたはレンジ相場の期間に入っていることを示すことがよくあります。これは、明確な方向性の偏りがないことを示しています。トレーダーは、これらの期間中にトレンドを特定するのが難しいと感じる可能性があり、より明確なトレンドが出現するまで待つ場合があります。 バーマ バンドの線が 1 本の線に収束すると、強いトレンド環境の兆候となること
現在33%オフ 初心者にもエキスパートトレーダーにも最適なソリューション このインジケーターは独自の機能と新しい公式を多数内蔵しており、ユニークで高品質かつ手頃な取引ツールです。このアップデートでは、2つの時間枠ゾーンを表示できるようになります。より長いTFだけでなく、チャートTFとより長いTF(ネストゾーンを表示)の両方を表示できます。すべてのSupply Demandトレーダーの皆さんのお気に召すはずです。:) 重要情報の公開 Advanced Supply Demandの可能性を最大化するには、 https://www.mql5.com/ja/blogs/post/720245 にアクセスしてください。   エントリーまたはターゲットの正確なトリガーポイントを正確に特定できれば取引がどのように改善されるか想像してみてください。新しい基盤となるアルゴリズムに基づいて構築されているため、買い手と売り手の間の潜在的な不均衡をさらに簡単に特定できます。これは、最も強い需要と供給のゾーンと、過去のパフォーマンス(古いゾーンを表示)がグラフィカルに表現されるためです。これらの機能は、最適な
作者のその他のプロダクト
Specialized for GOLD Trading with Advanced VWAP Strategy Transform your Gold trading with this sophisticated dual VWAP system specifically optimized for XAUUSD markets. Key Features Dual VWAP Technology Fast VWAP (100 bars) for short-term momentum Slow VWAP (500 bars) for trend confirmation Volume-weighted precision pricing for optimal entry/exit points Intelligent Position Management Smart scaling system that adds positions on favorable retracements Automatic position reversals w
Gold Order Block Robot EA Professional Order Block Trading System with Advanced Risk Management Overview The Gold Order Block Robot is a sophisticated Expert Advisor designed for automated trading using OrderBlock methodology. This EA identifies pivot points, creates Order Blocks based on institutional trading concepts, and executes trades with comprehensive risk management features. Key Features Order Block Detection Pivot-Based Detection : Identifies swing highs/lows using configurable pivo
Mario Order Block Indicator Overview The Professional Order Block Indicator is an advanced technical analysis tool that automatically identifies and displays institutional order blocks on your chart. Based on smart money concepts, this indicator helps traders identify high-probability support and resistance zones where institutional traders have placed significant orders. Key FeaturesAutomatic Order Block Detection Identifies bullish and bearish order blocks based on pivot point analysis Uses so
RamLalla Magic Trend Indicator Overview RamLalla Magic Trend  is a sophisticated trend-following indicator that combines the power of CCI (Commodity Channel Index) and ATR (Average True Range) to create dynamic trend lines with visual cloud formations. This indicator provides clear trend direction signals through color-coded lines and fills, making it easier for traders to identify market momentum shifts. This stands out from the standard Super Trend Indicator. Key Features The indicator uses a
ProScaler EA
Sandeep Kumar Tiwary
ScalerPro EA The Ultimate VWAP & EMA Fusion Trading System Overview ScalerPro EA is a next-generation Expert Advisor that fuses the institutional power of Volume Weighted Average Price (VWAP) with the reliability of Exponential Moving Averages (EMA). With dual-strategy architecture, smart position scaling, and intelligent risk controls, ScalerPro EA adapts dynamically to changing market conditions while keeping risk in check. Key Features Dual Strategy Engine VWAP Strategy → Captures momen
Force Momentum Robot - Advanced N-Candle Momentum Strategy with Comprehensive Analytics ADVANCED CSV TRADE ANALYTICS FOR OPTIMIZATION The EA includes a sophisticated trade logging system that generates detailed CSV reports for comprehensive strategy optimization and analysis: CSV Data Fields for Strategy Optimization: Peak Performance Tracking : Real-time monitoring of peak profits and drawdowns with exact timestamps Entry/Exit Analysis : Complete trade lifecycle from open to close with preci
フィルタ:
レビューなし
レビューに返信