End Flow Momentum
- Indicateurs
-
Nestor Jose Mendez Boza
 Concepteur de Systèmes de Trading Quantitatif et Chercheur en Analyse de Série Temporelle
 - Version: 3.0
- Mise à jour: 13 août 2026
- Activations: 10
END FLOW MOMENTUM
Capital Flow Analysis with a Geometric Approach
Overview
End Flow Momentum is a technical indicator that blends volume, price, and volatility analysis into a visual tool. Designed for traders seeking an alternative capital flow analysis tool.
Key Features
1. Mathematical Foundation
-
Proprietary Calculation Model: Uses a mathematical core that serves as a dynamic central reference point.
-
Volatility-Adaptive Scaling: Utilizes the asset's inherent volatility as the primary scalar, allowing automatic adaptation across different instruments.
-
Geometric Structure: Incorporates geometric proportions to define support and resistance level structures.
2. Dual Signal Trading System
A) Real-Time Capital Flow Signals
-
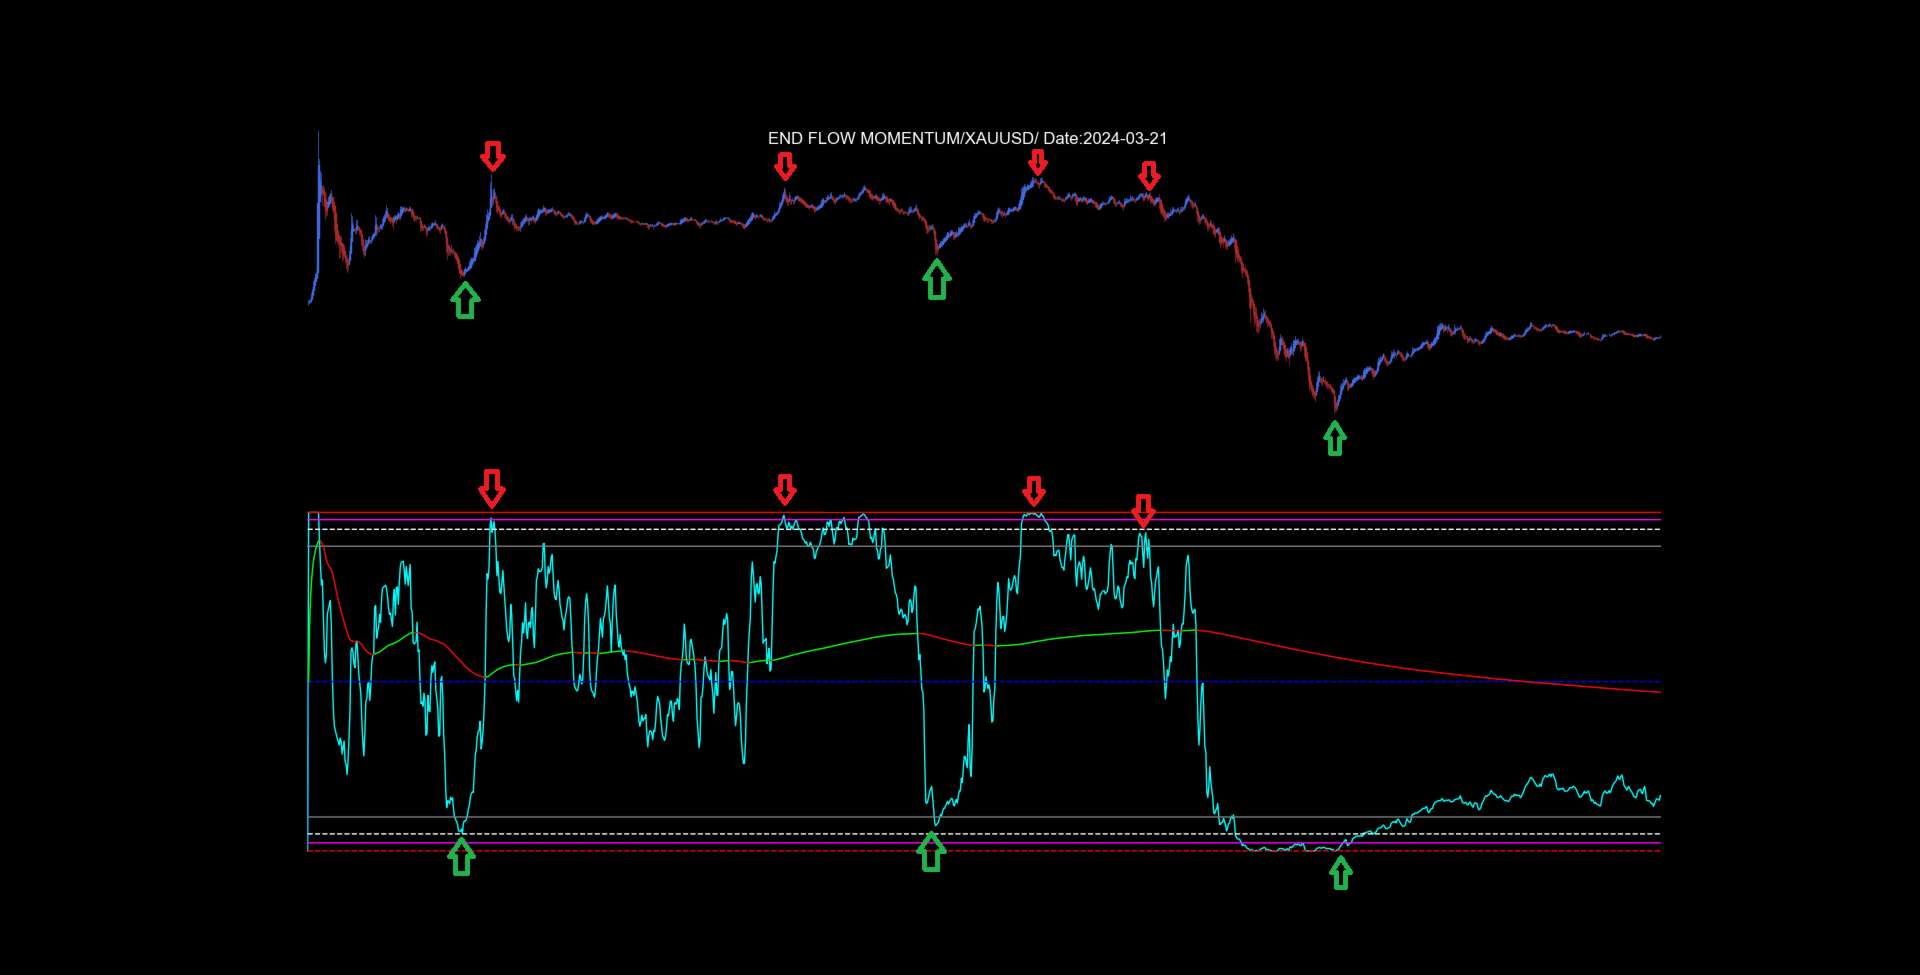
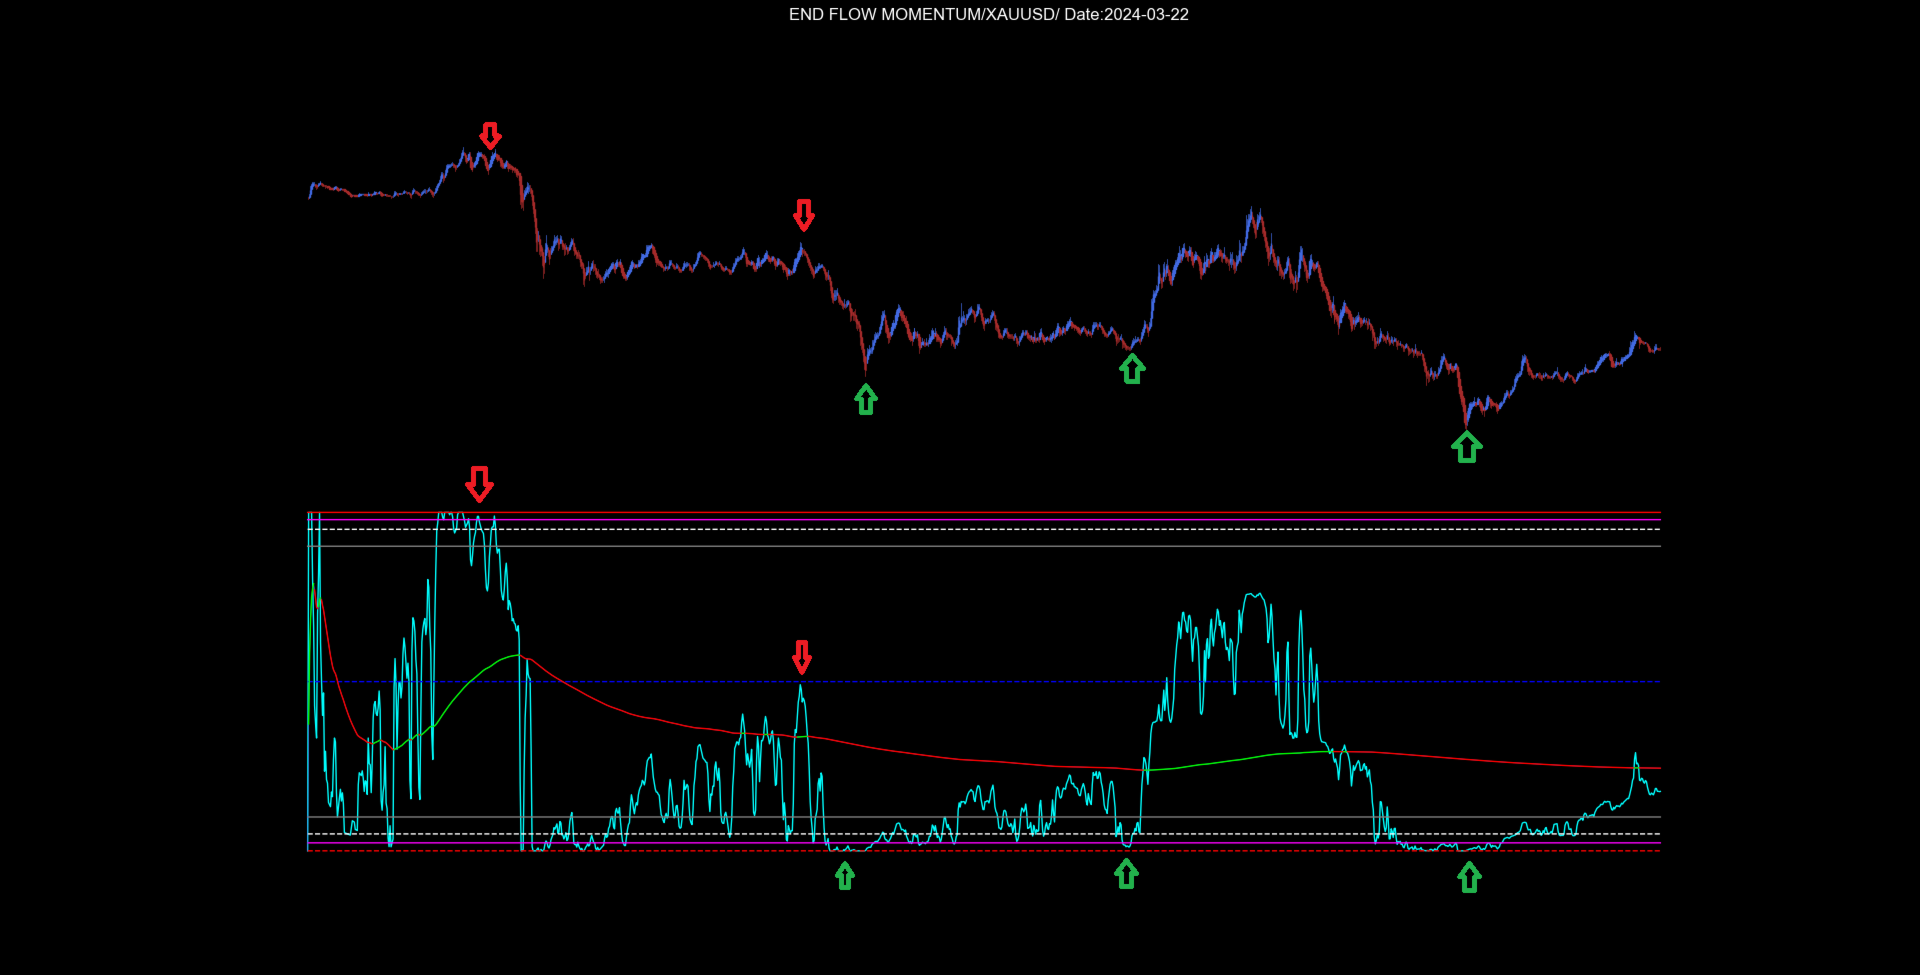
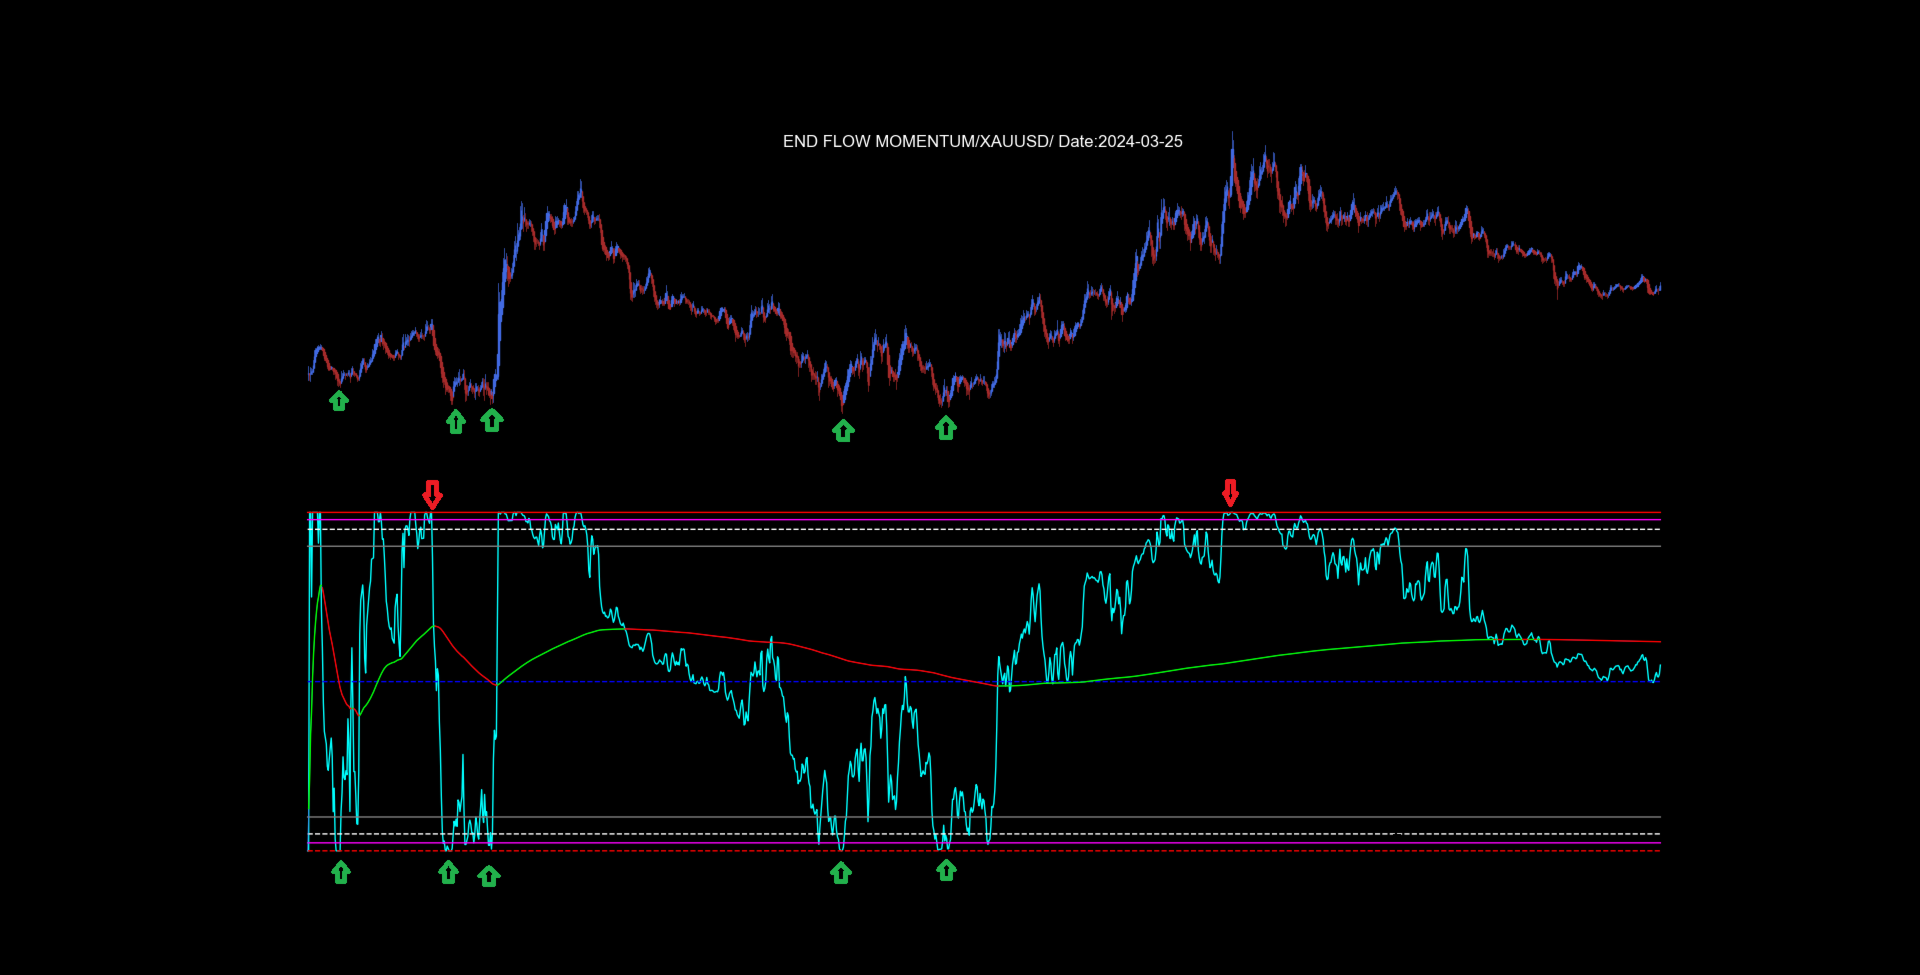
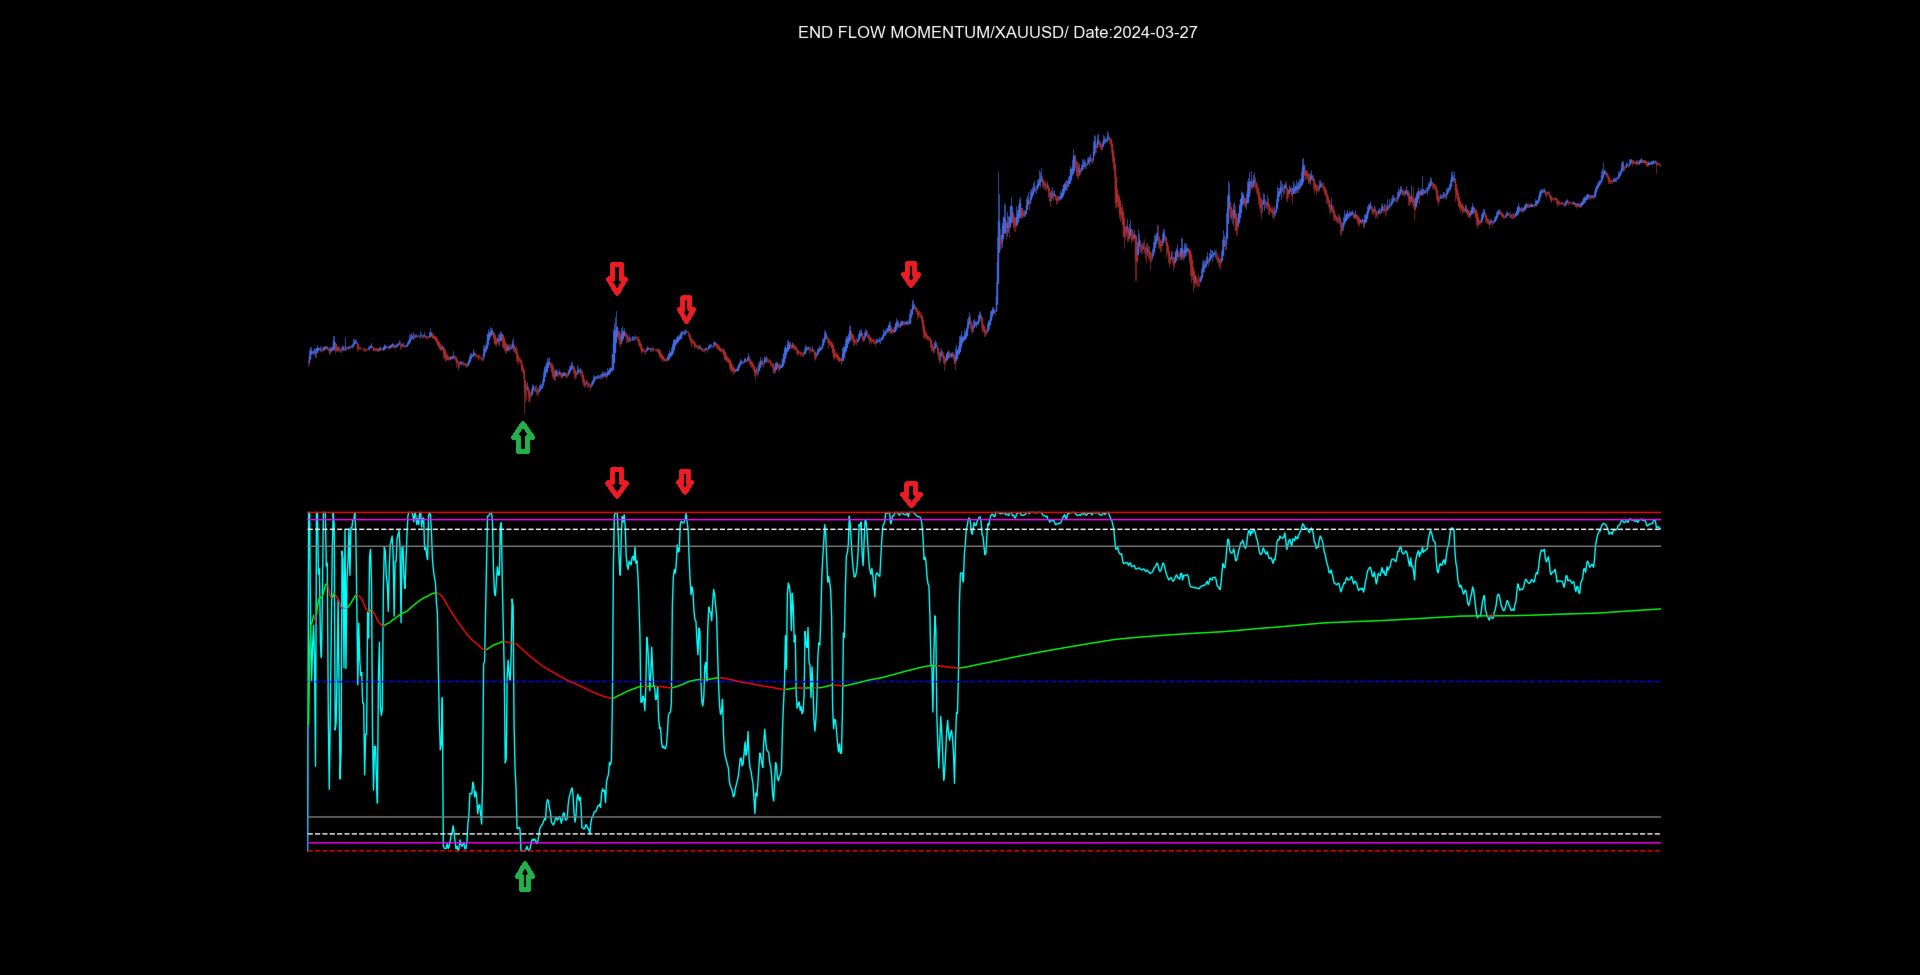
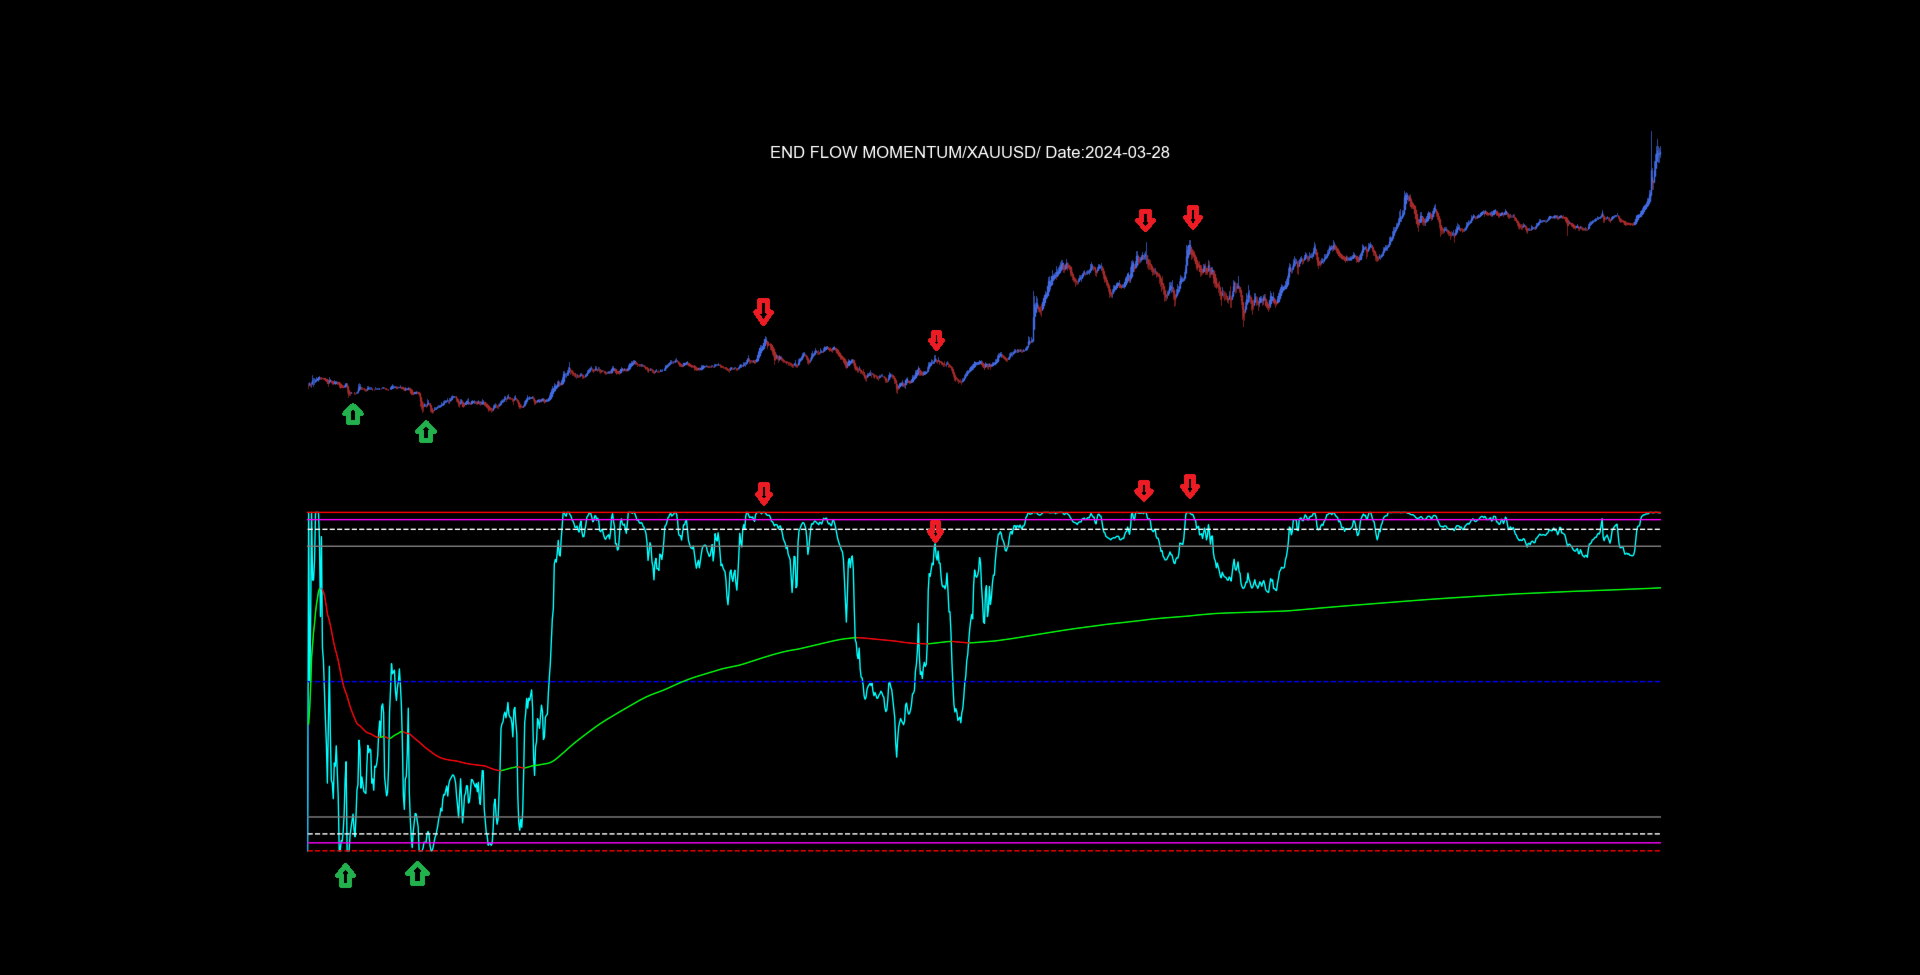
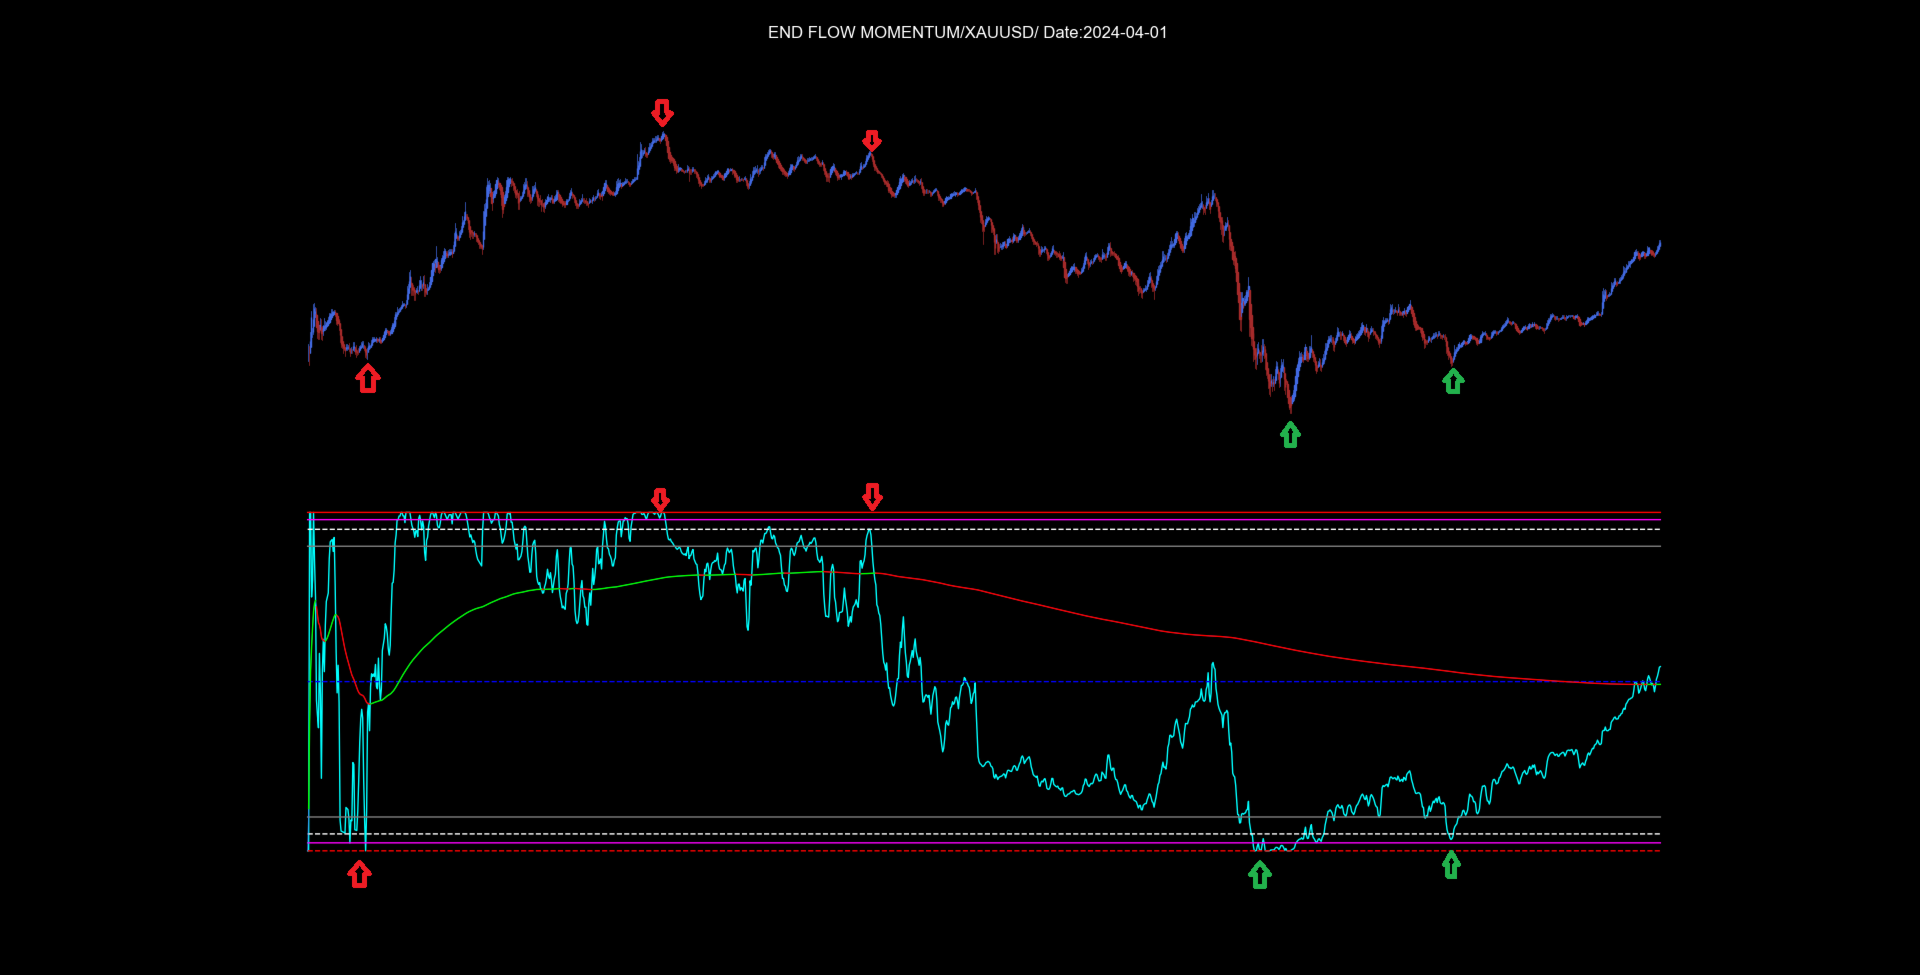
1. Instant Flow Signal: Cyan Line. Represents money/volume flow in real-time, showing the market's immediate intention.
-
2. Cumulative Momentum Signal: Dynamic Lime Green (bullish) or Red (bearish) Line. Represents the accumulation of money/volume flow, showing market momentum.
B) 9-Level Trading System (Price Ranges)
The indicator defines nine critical levels that form a framework for market analysis:
| Lvl | Name | Type | Description |
|---|---|---|---|
| a | Buy Exhaustion - Upper Limit | Solid Red Line | Zone where buying pressure exhausts; may suggest a reversal or distribution. |
| b | Impulse Validation Level (Buy Side) | Solid Magenta Line | Critical point that may indicate the strength of a bullish impulse. |
| c | Mid-Point Validation Level | White Dotted-Dashed Line | Intermediate equilibrium level acting as dynamic support/resistance. |
| d | Retracement Zone (Buy Side) | Solid Gray Line | Base of the bullish move; origin of demand and defense for buyers. |
| e | General Average Level | Blue Dashed Line | Theoretical global equilibrium point of the indicator. |
| f | Retracement Zone (Sell Side) | Solid Gray Line | Base of the bearish move; origin of supply and defense for sellers. |
| g | Mid-Point Validation Level (Sell Side) | White Dotted-Dashed Line | Intermediate point of the bearish trajectory. |
| h | Impulse Validation Level (Sell Side) | Solid Magenta Line | Level that may confirm or invalidate the bearish impulse. |
| i | Sell Exhaustion - Lower Limit | Solid Red Line | Zone where selling pressure exhausts; may suggest a bearish climax. |
3. Capital Flow Algorithm
-
Tick-by-Tick or Closed Bar Analysis: Processes tick-level volume data to analyze market intention.
-
Intention Detection: Distinguishes between accumulation/distribution and market movements.
4. Technical Implementation
-
Language: Developed in MQL5 for integration with MetaTrader 5.
-
Optimization: Coded for maximum efficiency.
5. Compatibility
-
Universal Application: Compatible with all financial instruments.
-
Recommended Timeframe: Works on M1 to M5 timeframes.
Advantages
-
Dual Signals: Provides readings for both Capital Flow direction and Accumulation/Distribution phases.
-
Automatic Adaptability: Self-adjusts to any asset.
-
Visual Clarity: The 9-level system provides a visualization of market dynamics.
Interpretation Guide
-
Cumulative Signal (Lime Green/Red) above Central Equilibrium (Blue Line): May suggest a bullish bias.
-
Cumulative Signal (Lime Green/Red) below Central Equilibrium (Blue Line): May suggest a bearish bias.
-
Rejection at Exhaustion Levels (Red Lines): May suggest a potential reversal.
-
Hold at Demand/Supply Origin (Gray Lines): May indicate the strength of the current trend.
-
Instant Flow Signal (Cyan): May provide real-time confirmation of capital flow direction.
Important Note
End Flow Momentum is a decision-support tool. It does not guarantee trading results. The indicator should be used as part of a comprehensive strategy that includes risk management. Always backtest and forward-test any strategy before using it with real capital.