SMC Analyzer Multi Timeframe MT4
- インディケータ
-
Cao Minh Quang
 Welcome to my profile. I am a developer MQL4 and MQL5.
Telegram: https://t.me/storevan
Thanks and regards! - バージョン: 1.0
- アクティベーション: 5
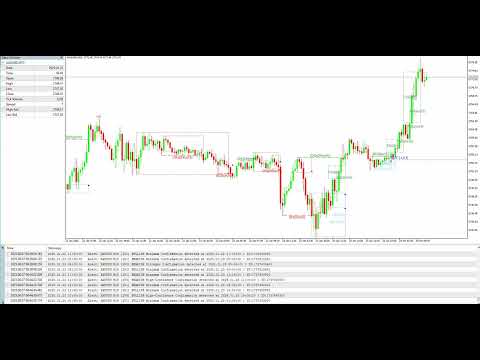
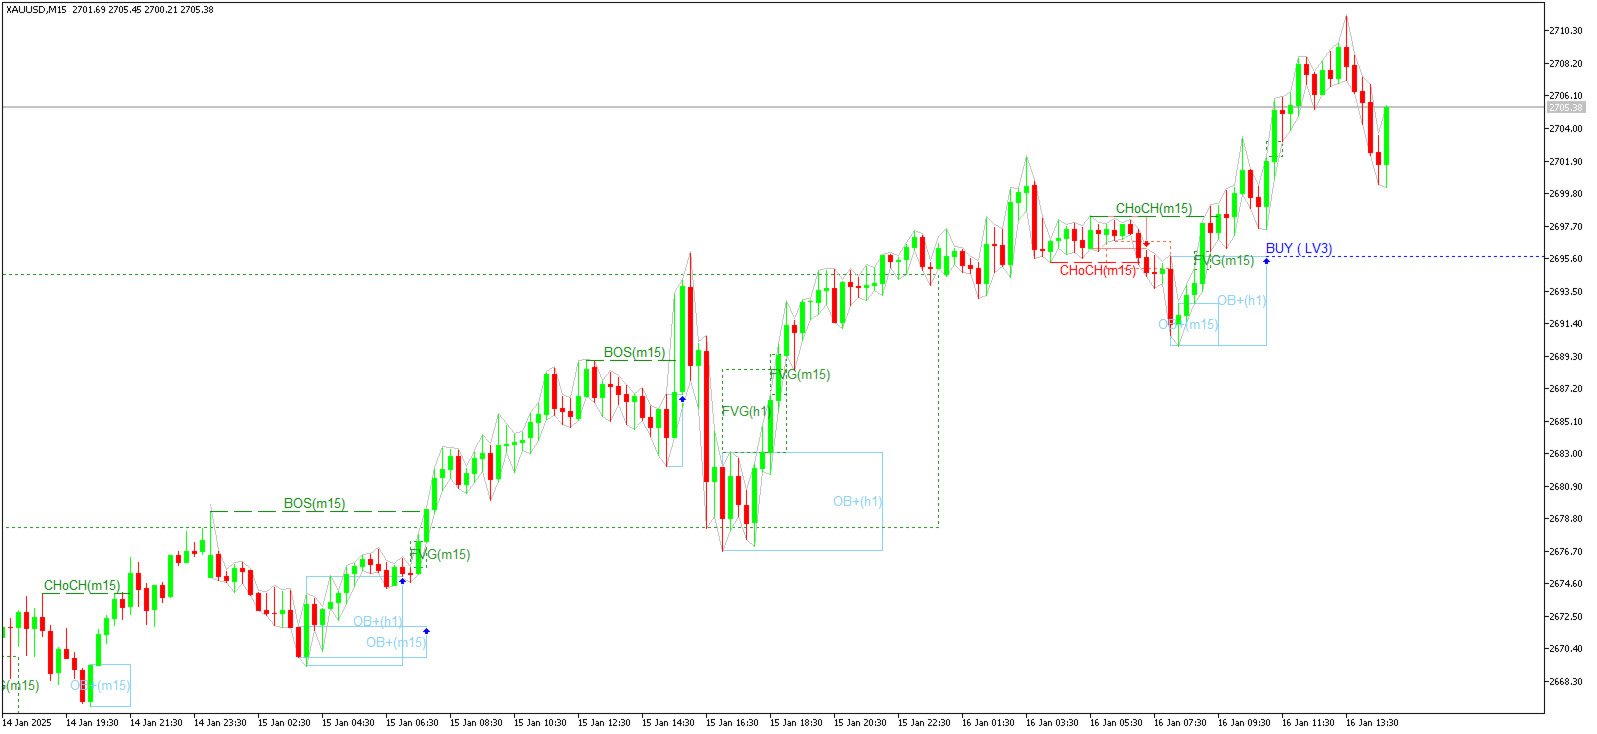
SMC Analyzer Multi-Timeframe is a powerful tool designed to help traders apply Smart Money Concepts (SMC) across multiple timeframes. This indicator identifies key structural points such as market structure shifts (Break of Structure and Change of Character), order blocks, fair value gaps (FVG), and liquidity zones from higher timeframes and overlays them onto the current chart.
By aligning these critical SMC signals across multiple timeframes, traders gain a more comprehensive view of institutional activity and potential trade opportunities.
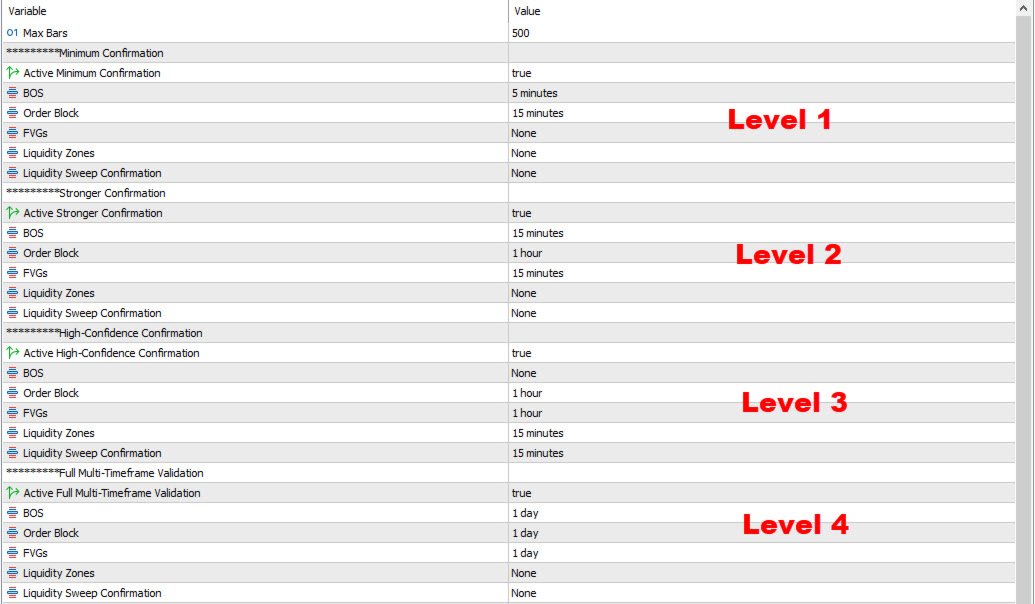
Each level has configurable elements (BOS, OB, FVG, Liquidity Zones, Liquidity Sweep Confirmation).
The system dynamically validates confirmations from Level 1 to Level 4.
The highest confirmed level determines the entry signal.
Confirmation Levels (Default):
-
Minimum Confirmation – Combines BOS(M5) and Order Block(M15) to detect early potential setups.
-
Stronger Confirmation – Combines BOS(M15), Order Block(H1) and FVG(M15) to detect early potential setups.
-
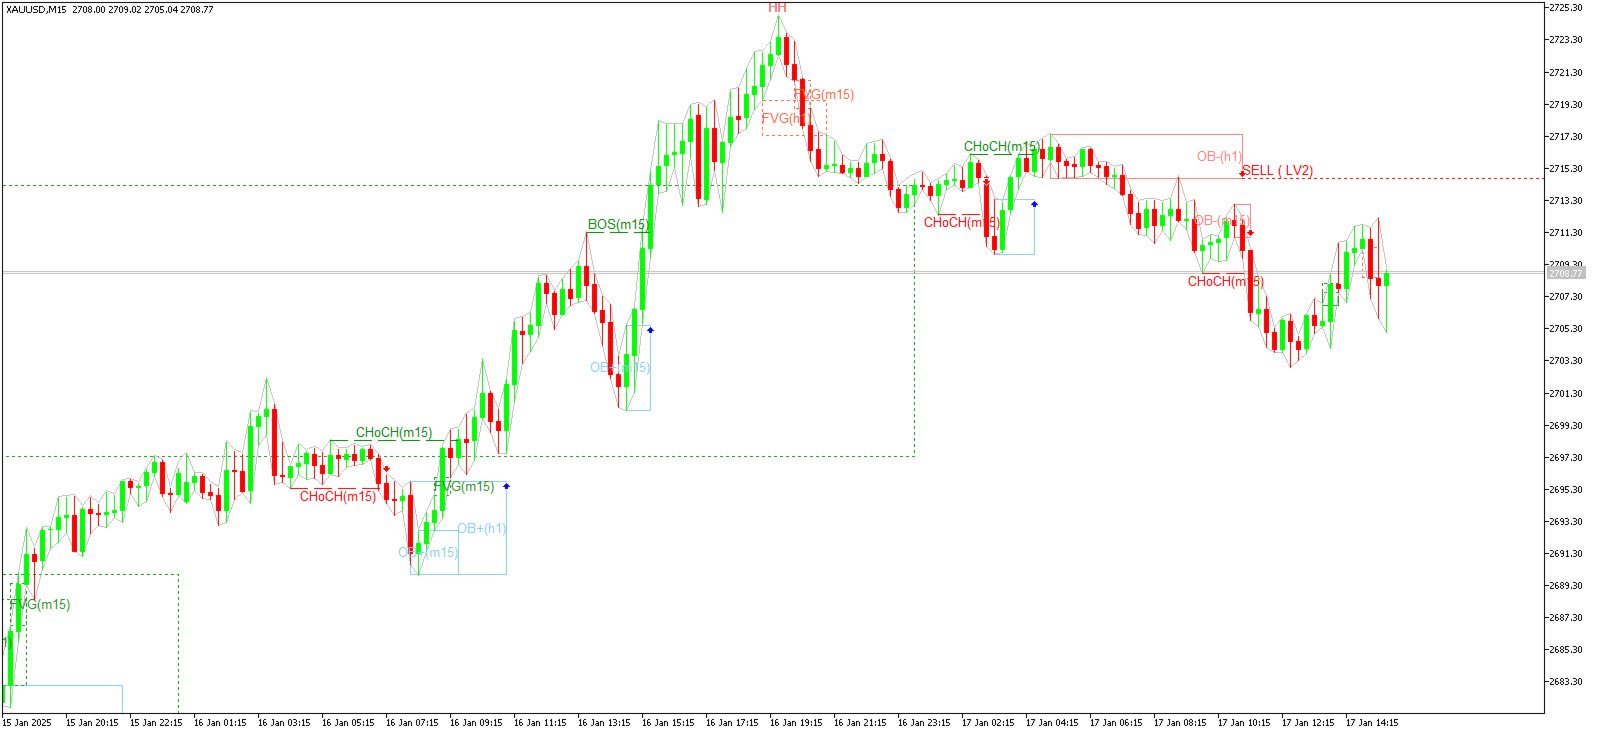
High-Confidence Confirmation – Combines Order Block(H1), Liquidity Zones(M15), Liquidity Sweep(M15) and FVG(H1) to detect early potential setups.
-
Full Multi-Timeframe Validation – Combines BOS(D1), Order Block(D1) and FVG(D1) to detect early potential setups.
Entry Data Handling
| Level 1 | Level 2 | Level 3 | Level 4 |
| ✅ If Met | ✅ If Met | ✅ If Met | ✅ If Met |
→ Entry Data Updated (Price, Time, Direction, Level)
Key Features:
-
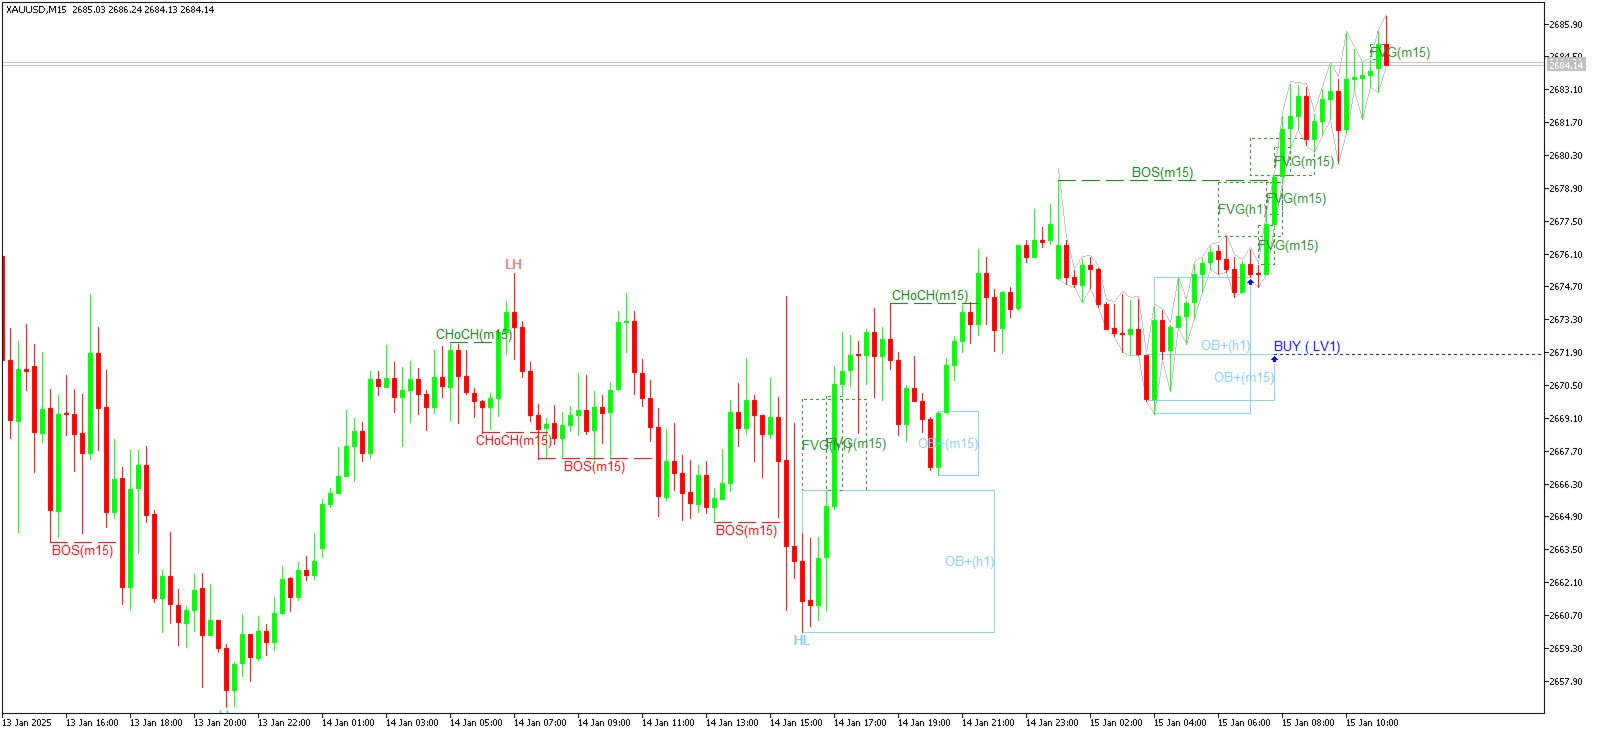
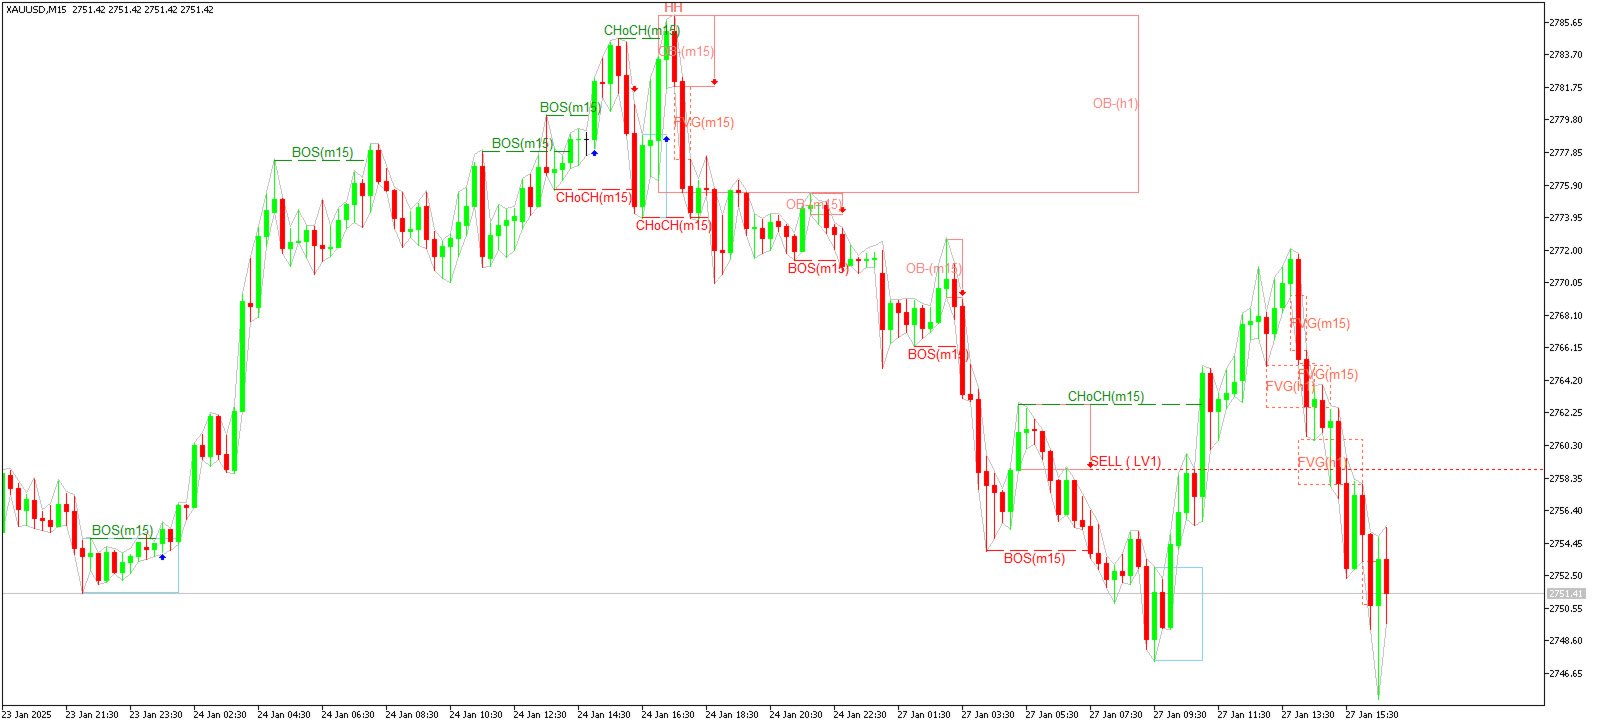
Detects Break of Structure (BOS) and Change of Character (CHoCH) across selected timeframes
-
Highlights confirmed and unconfirmed Order Blocks
-
Marks Fair Value Gaps for potential entries or exits
-
Tracks internal and external liquidity zones
-
Multi-timeframe overlay of all critical SMC elements
-
Fully customizable visuals and timeframe selection
-
Optional alerts for CHoCH, BOS, and FVG formations
-
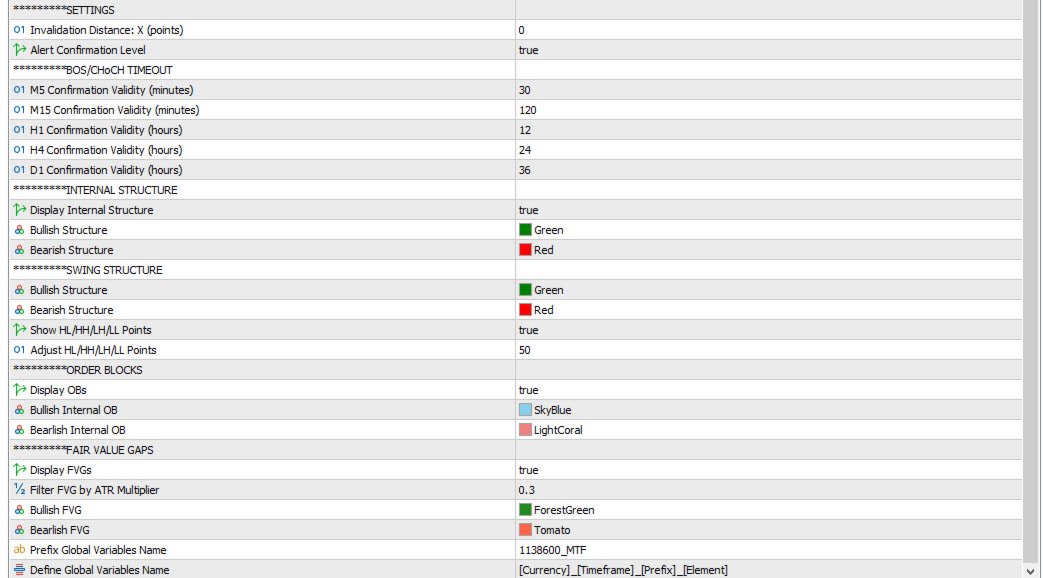
Signal Timeout Feature – User-defined input to set the maximum time (in minutes) that the entry signal remains valid (after which the signal resets to 0).
-
Global Output Variables – Each confirmation updates the following global variables, making integration with other EAs or dashboards seamless:
| Global Variable | Description |
|---|---|
| PrefixGlobal + "MTF_ENTRY_PRICE" | The price where the entry condition is met. |
| PrefixGlobal + "MTF_ENTRY_TIME" | The exact time the entry condition is confirmed. |
| PrefixGlobal + "MTF_TRADE_DIRECTION" | Trade Direction (Buy/Sell) |
| PrefixGlobal + "MTF_CONFIRMATION_LEVEL" | Confirmed Level (1–4) |
| PrefixGlobal + "MTF_ENTRY_SIGNAL" | Entry Signal Validity (0/1) |
Inputs:
-
Higher Timeframes to analyze (e.g., H1, H4, D1)
-
Structure sensitivity (swing detection parameters)
-
FVG and OB filter settings
-
Display toggle for each SMC component
-
Alert preferences (on-screen, push notifications)
Use Case:
SMC Analyzer Multi-Timeframe is ideal for traders who incorporate institutional trading concepts in their strategy and need to confirm setups across timeframes. Whether you're scalping on M15 or swing trading on H4, this indicator brings essential smart money insights directly into your workflow.