RC Range Filtered AlgoAlpha MT5
- Indicateurs
-
Francisco Rayol
 MQL5 | MQL4 | PINESCRIPT | NINJASCRIPT
RC ATR Volatility Hedge Zones: https://www.mql5.com/en/market/product/114742 - Version: 1.0
- Activations: 10
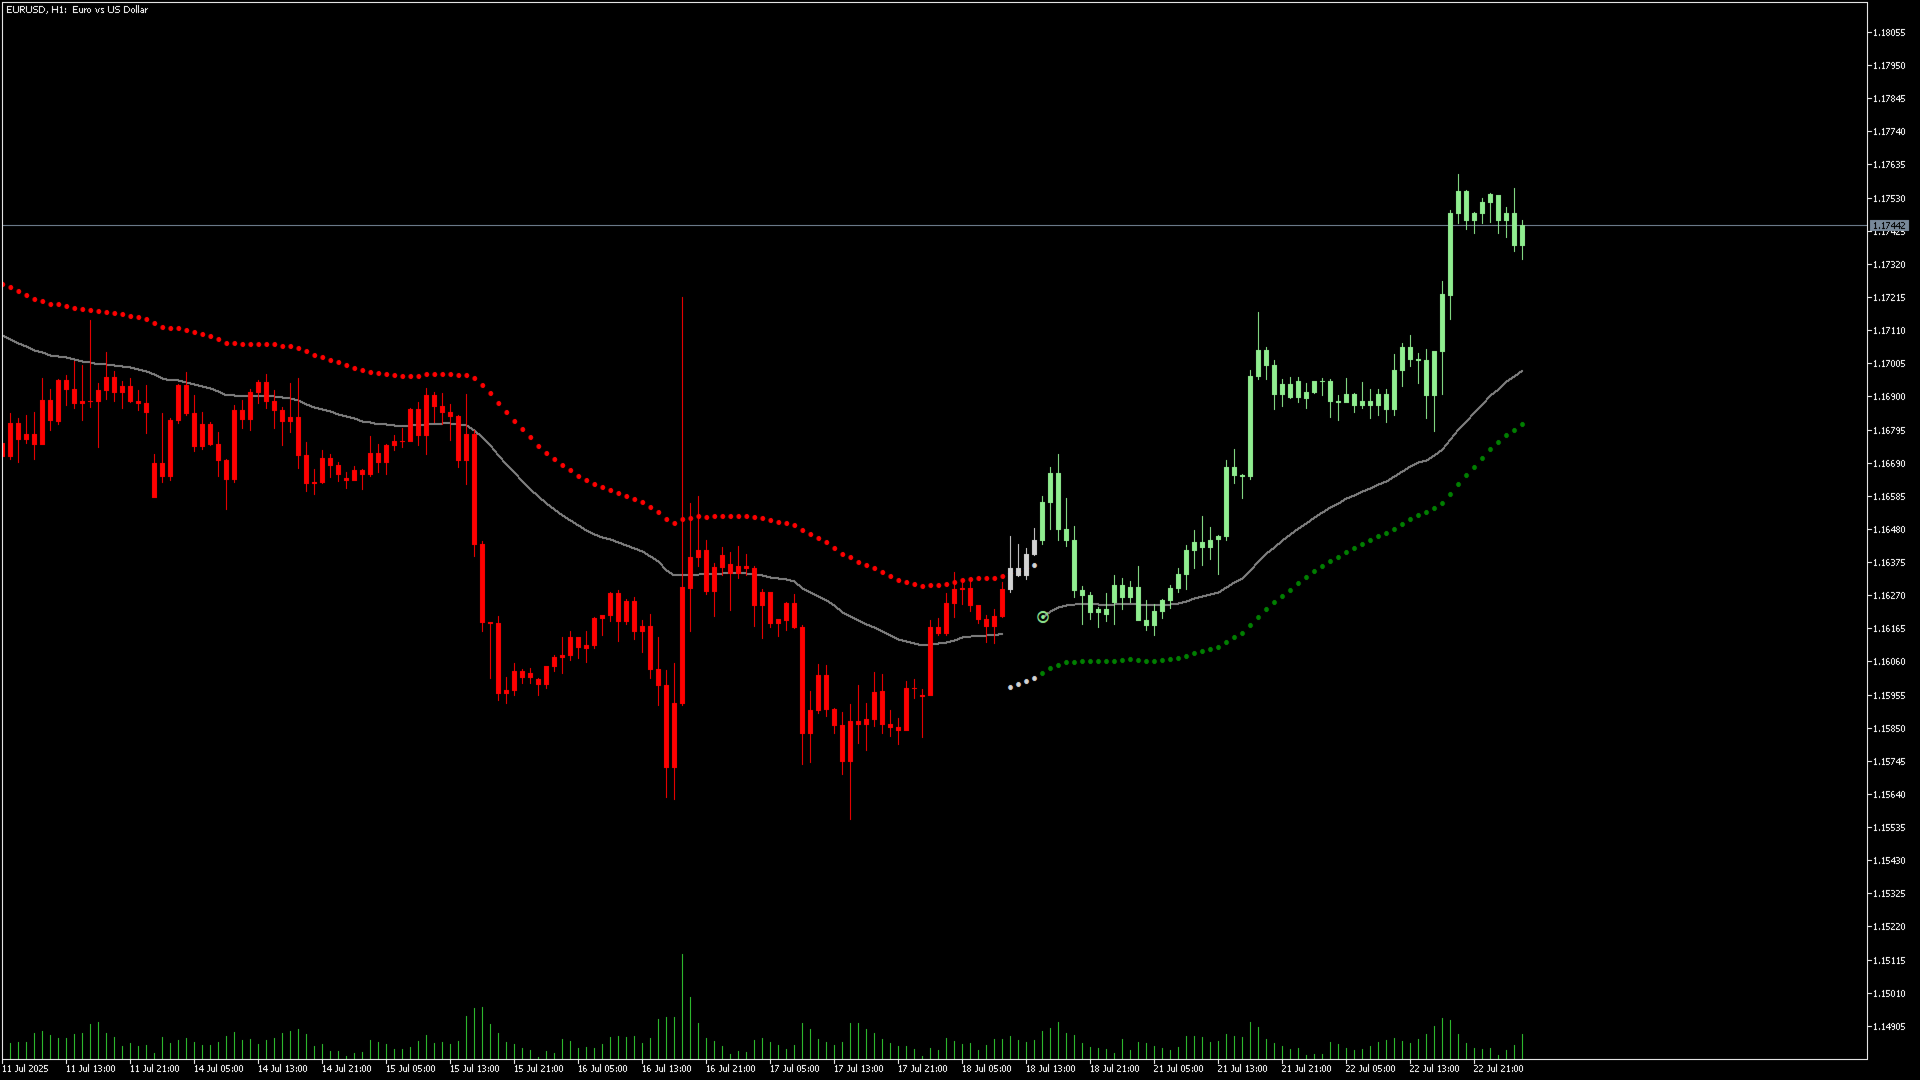
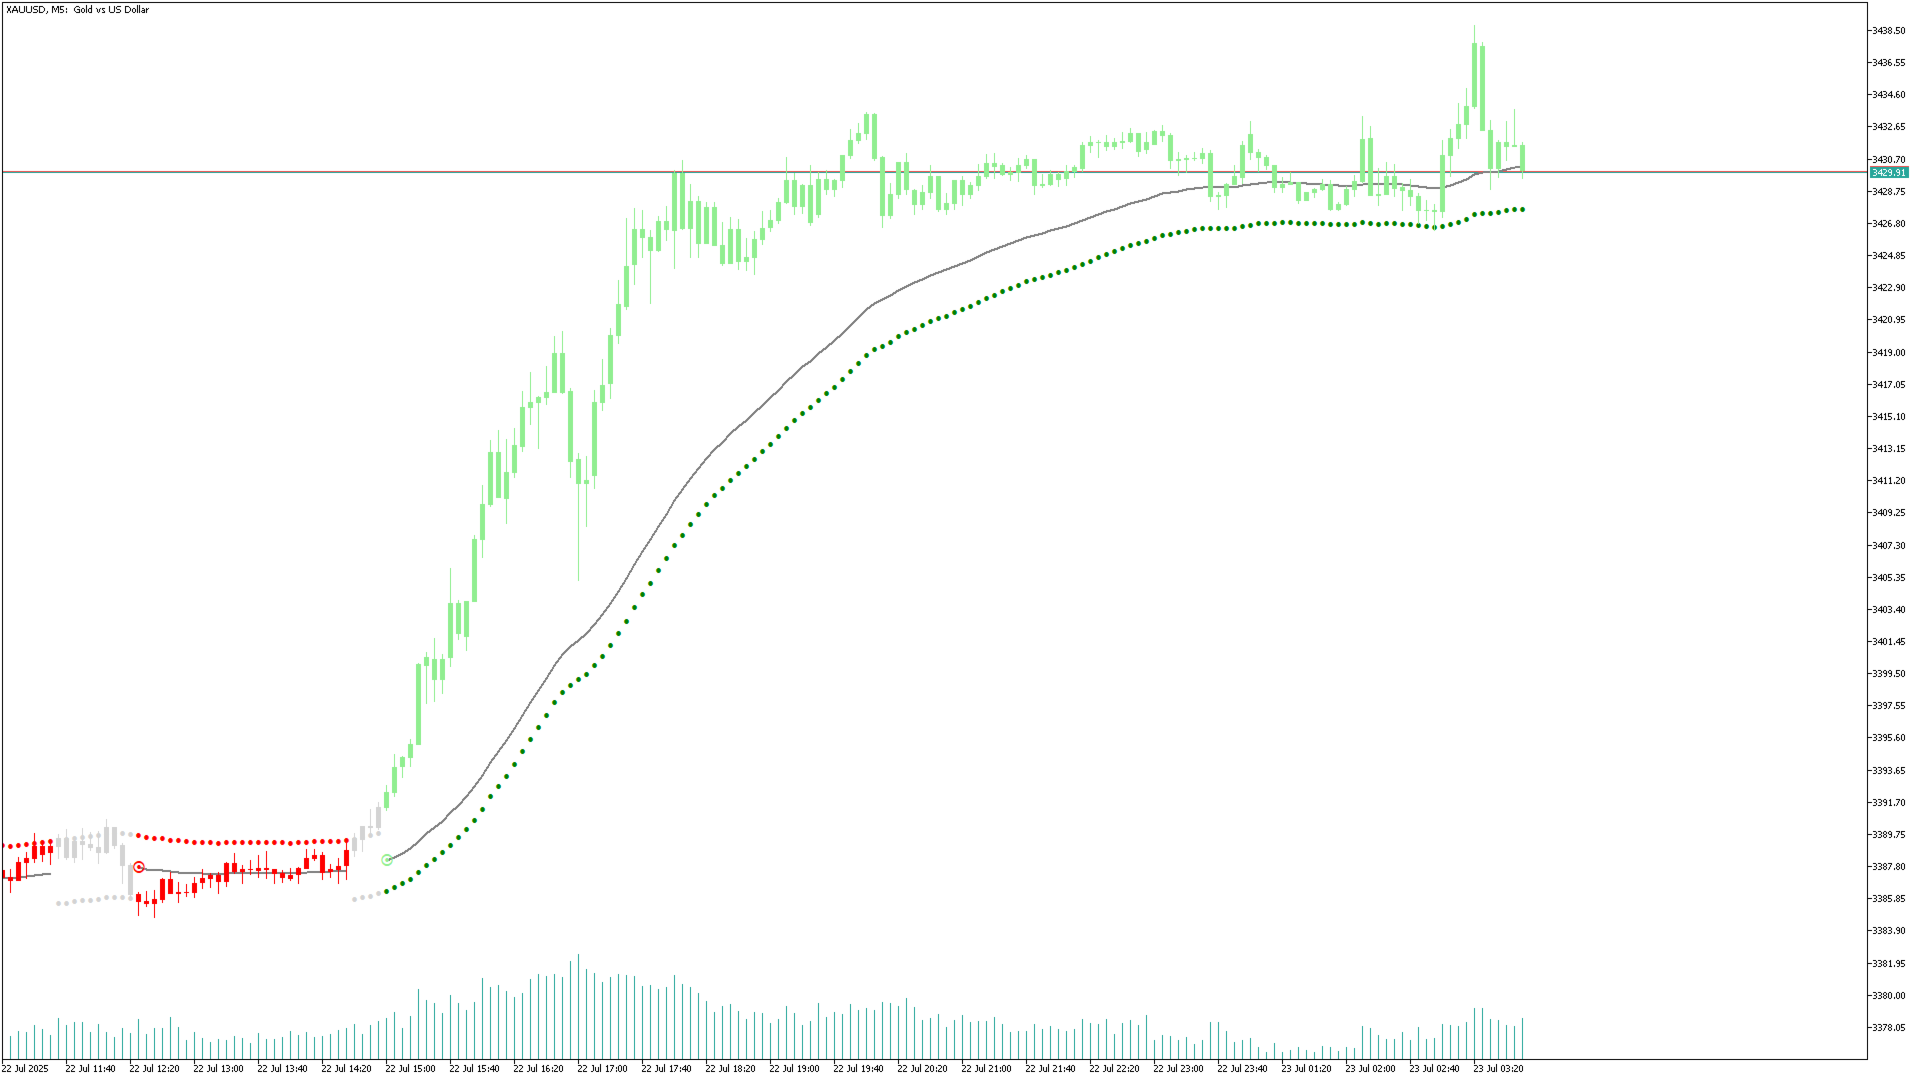
Range Filtered AlgoAlpha est un outil d'analyse technique conçu pour identifier des opportunités de trading potentielles en analysant la volatilité des marchés. Cette adaptation MetaTrader de l'indicateur original TradingView d'AlgoAlpha combine plusieurs méthodes analytiques pour fournir une évaluation visuelle du marché.
Caractéristiques techniques
Utilisation du filtrage de Kalman (Kalman Filtering) pour lisser les prix
Intègre des bandes basées sur ATR (ATR-based Bands) pour mesurer la volatilité
Comprend des éléments Supertrend pour l'analyse de tendance
Fournit des signaux visuels via des chandeliers colorés (Candles) et marqueurs (Markers)
Propose des options d'alerte configurables (Configurable Alerts)
Fonctionnalités
L'indicateur traite les données de marché pour :
Calculer les plages de volatilité avec ATR (Average True Range)
Appliquer des techniques de filtrage (Filtering Techniques) pour réduire le bruit de marché
Afficher les directions de tendance potentielles via des éléments visuels (Visual Elements)
Cas d'utilisation
Utile pour les stratégies de trading basées sur la volatilité (Volatility-based Trading)
Peut servir d'outil complémentaire pour l'analyse technique (Technical Analysis) de divers instruments
Fournit des points de référence visuels (Visual Reference Points) sur les conditions de marché
Avertissement
Le trading comporte des risques importants. Cet indicateur est fourni à titre informatif uniquement. Les utilisateurs assument l'entière responsabilité de leurs décisions de trading.