Anchored VWAP by TradingDE

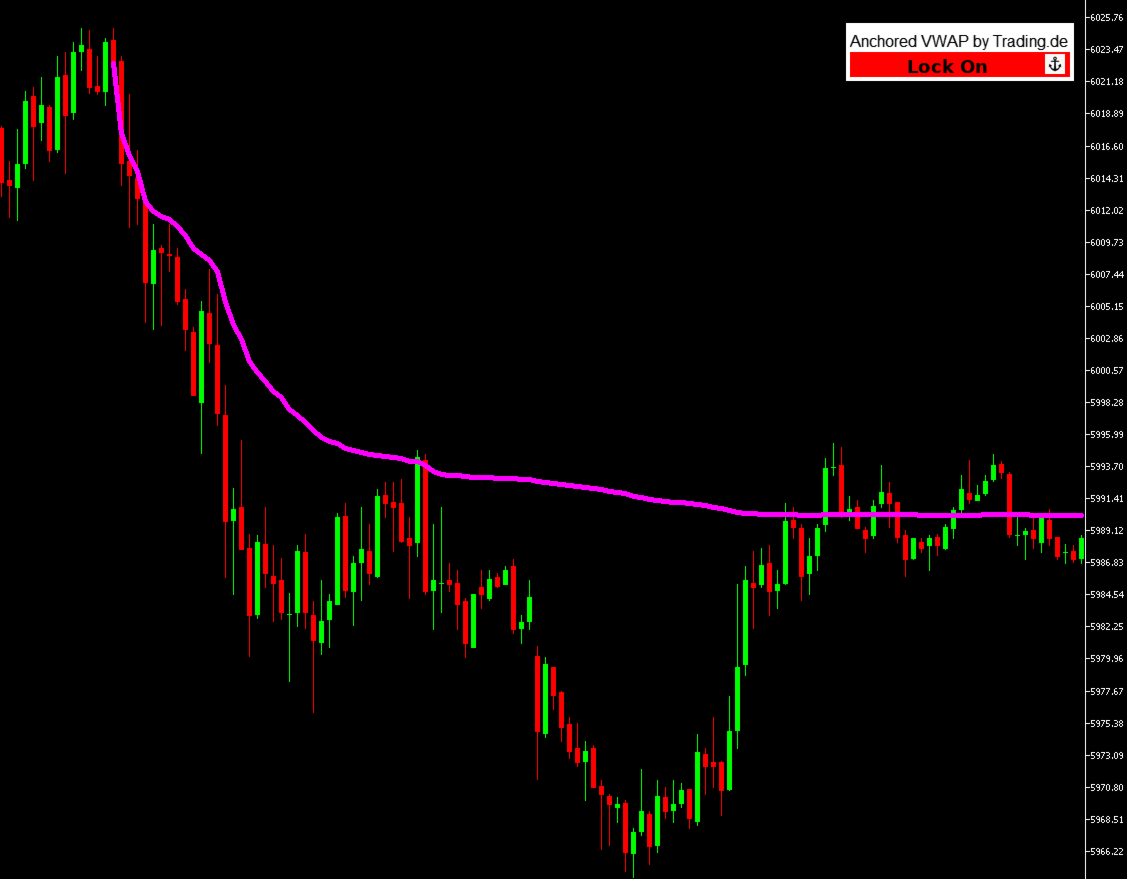
Specially developed Anchored VWAP for MetaTrader 5 (MT5) from Trading.de. To match our day trading strategy, you can place an Anchored VWAP in your chart. The Volume Weighted Average Price indicator can be adjusted in color and also fixed on the chart. It is possible to choose real volume as well as no real volume in the settings. The indicator is best suited for day trading in a 1-minute chart, as you learn in training at Trading.de.


You can use "E" on your Keyboad to lock/unlock the AVWAP, too.

おすすめのプロダクト
Elevate Your Trading with Advanced Anchored Volume Weighted Average Price Technology Unlock the true power of price action with our premium Anchored VWAP Indicator for MetaTrader 5 - the essential tool for precision entries, strategic exits, and high-probability trend continuation setups. Write me a DM for a 7 day free trial.  Anchored VWAP Plus gives traders unprecedented control by allowing custom anchor points for Volume Weighted Average Price calculations on any chart. With support for 4 sim
FREE
インジケーター解説:Anchored VWAP Bands(トリプル・アンカー・ロジック) Anchored VWAP Bands は、チャート上の任意の地点から出来高加重平均価格(VWAP)を算出できる高度な精密分析ツールです。独自の ダイナミック・クリック・アンカリング機能 により、直感的な操作を実現しました。 最大の特徴:高精度クリック検知(Click-Point Detection) 一般的なVWAPとは異なり、このインジケーターはローソク足のどの位置をクリックしたかを検知し、計算の基準値を自動的に設定します。 上部をクリック (HIGH): 高値を基準に計算を開始します。天井圏やレジスタンス確認後の「売り手」の平均コストを測定するのに最適です。 中央をクリック (TYPICAL): 代表価格 $(H+L+C)/3$ を基準にします。市場の均衡点やボリューム・ポイント・オブ・コントロール(VPOC)の特定に有効です。 下部をクリック (LOW): 安値を基準にします。サポートラインや底値圏からの「買い手」の平均コストを正確に把握できます。 主な機能: 標準偏差バンド: 中央線の
Weighted average price indicator or VWAP. The well-known standard VWAP with the beginning of the day is added with the function of selecting the periodization. It can be calculated both every day and on other periods. Also the indicator allows to exclude the volume from the calculation, which will allow using it on the cryptocurrencies and forex. There is an alert for a VWAP price crossing. There are 1 and 2 standard deviation. Settings: Volume: turning volume on and off in the calculation mecha
Theory VWAP is a volume-weighted moving average, bringing greater relevance to prices. The VWAP base calculation follows the classic formula described in Investopedia ( https://www.investopedia.com/terms/v/vwap.asp ). VWAP = sum(typical price[i]*volume[i]) / sum(volume[i]) Functionalities Orion Intraday VWAP innovates by allowing the user to choose between the conventional Daily, Weekly and Monthly periods, also having the option of calculating the Intraday indicator, as used in other platform
MIDAS Super VWAP
Flavio Javier Jarabeck
4.27 (11)
Imagine VWAP, MVWAP and MIDAS in one place... Well, you found it! Now you can track the movement of Big Players in various ways, as they in general pursue the benchmarks related to this measuring, gauging if they had good execution or poor execution on their orders. Traders and analysts use the VWAP to eliminate the noise that occurs throughout the day, so they can measure what prices buyers and sellers are really trading. VWAP gives traders insight into how a stock trades for that day and deter
FREE
VWAP and MVWAP
Flavio Javier Jarabeck
3.88 (8)
Volume Weighted Average Price (VWAP) is a trading benchmark commonly used by Big Players that gives the average price a Symbol has traded throughout the day. It is based on both Volume and price. Additionally we put in this indicator the MVWAP (Moving Volume Weighted Average Price). For those who do not know the usage and the importance od this indicator I recommend a great article about this subject at Investopedia ( https://www.investopedia.com/articles/trading/11/trading-with-vwap-mvwap.asp )
FREE
シンプルだが効果的。 反転インジケーター - それは何か? スーパートレンドのロジックと指数曲線技術を組み合わせたトレンドフォロー型オーバーレイインジケーターです。トレンドの方向を検知し、チャート上に動的なチャネルを描画し、トレンドが反転した際にリアルタイムでアラートを送信します。 仕組み ATRとスーパートレンド係数を用いて指数ベースラインを算出。価格がこのベースラインを上抜け/下抜けした時点でトレンド反転を確認。緑矢印は買いトレンド開始、赤矢印は売りトレンド開始を示す。 特徴: ATRベースの動的チャネル付き指数トレンドベースライン 緑/赤で色分けされたトレンドラインと塗りつぶしチャネル トレンド反転時の買い/売り矢印シグナル 内蔵アラート:ポップアップ、プッシュ通知、メール、サウンド 重複アラート防止(1バーあたり1アラート) 完全カスタマイズ可能:色、線幅、矢印サイズ、チャネル幅 遅延のないクリーンなチャートオーバーレイ 入力パラメータ: 指数係数、スーパートレンド係数、ATR期間、チャネル幅 オン/オフ切り替え:チャネル塗りつぶし、矢印、各アラートタイプ 全視覚
FREE
Weis Wave Double Side
Eduardo Da Costa Custodio Santos
The Weis Wave Bouble Side Indicator for MT5 is part of the toolkit (Wyckoff Academy Wave Market) The Weis Wave Bouble side Indicator for MT5 was created based on the already established Weis Wave created by David Weis. The Weis Wave Double Side indicator reads the market in waves as it was done by R. Wyckoff in 1900. It helps in the identification of effort x result, cause and effect, and Supply and demand Its differential is that it can be used below the zero axis, further improving plus operat
Zone vwap auto band
Anizio Donizete Dias De Moraes
It is an indicator used to identify support and resistance points from the daily VWAP and you can use it to check the best entry and exit points. The calculated value of the channel distance can be calculated in several ways: - Manual   Defining the value to be projected to calculate the distance of the channels. - Automatic   Select the timeframe to be used.   Regardless of the graphic time that is on the screen, if the parameter is changed to      H1(One hour candles), the system will calc
Introducing the B4S BidLine CandleTimer An insightful indicator that combines real-time bid line visualization with a dynamic countdown timer. Gain a competitive edge in your trading as you stay informed about the time remaining until the next candle starts, all displayed seamlessly on your chart. Why B4S BidLine CandleTimer? Unleash the potential of your trading strategy with the B4S BidLine CandleTimer. Here's why this indicator stands out: Real-Time Bid Line: Witness market movements like nev
Features 3 types of waves: bullish, bearish and unknown. The unknown tower comes when prices move in opposite the direction of the current tower. Label that shows the percentage remaining for the next tower. Allows you set the type of volume that will be accumulated in the towers, either real or tick volumes. Thus, the indicator works in any market, for example: stocks, futures, forex, commodities, etc. Allows you to set the required score for the tower exchange. Allows you to set the font size
Fvg Edge
Ahmad Meftah Abdulsalam Alawwami
5 (2)
FVG Smart Zones – 無料版 MetaTrader 5 (MT5)用 公正価値ギャップ(FVG)検出インジケーター ただのランダムなインジケーターではなく、 本格的なトレーディングツール をお探しですか? FVG Smart Zones – 無料版 は、公正価値ギャップ(FVG)を自動で検出し、チャート上に 高確率トレーディングゾーン をハイライトして、プロフェッショナルな市場の洞察を提供します。 以下のトレーダー向けに設計されています: スマートマネーコンセプト (SMC) ICTトレーディングコンセプト プライスアクション (Price Action) 需給分析 (Supply & Demand) 機関投資家向けトレーディング戦略 このインジケーターは、 価格が反応しやすいゾーン に集中するのを助けます。 主な機能 スマートゾーン検出 上昇・下降FVGの自動検出 クリーンでプロフェッショナルなビジュアルゾーン 弱い、または関連性の低いギャップを除去するインテリジェントフィルター 高度な確認機能 上位時間軸(HTF)
FREE
Rolling vwap atr market panel
Florian Alain Bernard Jean-paul Pierre Cuiset
Rolling VWAP + ATR Bands + Market Panel — powerful visual tool for scalping, extensions detection and intraday market structure analysis. Rolling VWAP + Panel Rolling VWAP + Panel is a professional MetaTrader 5 indicator designed to analyze market structure using a Rolling Volume Weighted Average Price (VWAP) combined with ATR-based volatility bands , a real-time market analysis panel , and an integrated candle countdown timer . This indicator provides a clear and structured view of price beha
FREE
GDS Renko Entry Helper Pro GDS Renko Entry Helper Pro HOW THE SYSTEM WORKS This tool is part of the Golden Delta Renko trading system. The system is designed to guide you step by step: 1.   Renko Zones       → shows where key levels are   2.   Entry Helper      → highlights where to focus   3.   Entry Helper PRO      → shows setup quality and context   4.   Trade Desk Panel      → executes trades with full control  
Volume Profile Density V2.40 価格ごとの出来高分布を表示し、機関投資家が注目する価格帯を明らかにします。 時間軸ベースの出来高とは異なり、どこで取引量が集中したかを示します。 基本概念: 水平バー = 各価格の取引量 バーが長いほど出来高が多い 赤いゾーン = 主要なサポート/レジスタンス 主な用途: 実際のサポート・レジスタンスの特定 POC(コントロールポイント) の確認 バリューエリア(総出来高の70%) の定義 低出来高ゾーンをストップやターゲットに利用 カラーガイド: 青 = 低出来高(価格が素早く通過) 黄 = 中程度の出来高(バランスゾーン) 赤 = 高出来高(機関ゾーン) トレード戦略: 赤ゾーンでの反発買い VAHまたは赤ゾーンでの拒否売り 出来高を伴うPOCブレイクで参入 POCへの戻りでエントリー 青ゾーンを目標に設定 設定: 初心者: 1.0 / 100% / 1.0 スキャルピング: 0.5 / 200% / 0.5 スイング: 2.0 / 50% / 1.5 技術情報: バージョン: 2.40 プラットフォーム: MT5 対応資産
FREE
Weis Wave Double Side Alert
Eduardo Da Costa Custodio Santos
The Weis Wave Bouble Side Indicator for MT5 is part of the toolkit (Wyckoff Academy Wave Market) The Weis Wave Bouble side Indicator for MT5 was created based on the already established Weis Wave created by David Weis. The Weis Wave Double Side indicator reads the market in waves as R. Wyckoff did in 1900. It helps in the identification of effort x result, cause and effect, and Supply and demand Its differential is that it can be used below the zero axis and has a breakout alert showing Who is s
Simple Vwap with the daily, weekly and monthly VWAP is the abbreviation for   volume-weighted average price , which is a technical analysis tool that shows the ratio of an asset's price to its total trade volume. It provides traders and investors with a measure of the average price at which a stock is traded over a given period of time. How it's used Identify entry and exit points:   Traders can use VWAP to determine when to buy or sell an asset.   Understand price trends :  Traders can use V
FREE
Description: The Volume Profile displays detailed informations of historical trading activities at certain price levels (Market Profile). Locate the areas with the best prices in the market and get an advantage over other market participants. Features: Customizable Market Profile Shows the "fair" Value Area with 70% of all Volume Shows critical low volume zones Shows VPOC, VAL and VAH Points integrated resource management to reduce the load while working with multiple charts Works on all timefr
TrendView Zero Automator — Full Automation with One Click TrendView Zero Automator is the official automation module designed to work seamlessly with the TrendView Zero indicator. While the indicator analyzes the market, selects the best internal configuration, and generates trading signals, the Automator transforms those signals into fully automated trades. It follows the same philosophy as TrendView Zero: zero complexity and maximum clarity. A single on-screen button controls the entire sy
Stackable VWAP
Flavio Javier Jarabeck
3.5 (4)
Volume Weighted Average Price (VWAP) is a trading benchmark commonly used by Big Players that gives the average price a Symbol has traded throughout the day. It is based on both Volume and price. Additionally we put in this indicator the MVWAP (Moving Volume Weighted Average Price). For those who do not know the usage and the importance od this indicator I recommend a great article about this subject at Investopedia ( https://www.investopedia.com/articles/trading/11/trading-with-vwap-mvwap.asp
FREE
VWAP Diaria
Samuel De Souza Ferreira
Daily VWAP — Institutional Reference for Intraday Value The Daily VWAP is a professional indicator based on the Volume-Weighted Average Price (VWAP) , designed to reveal the true balance between price and volume throughout the trading session. Unlike traditional moving averages, the Daily VWAP incorporates the weight of traded volume in every price movement, providing a much more accurate reference to the behavior of institutional traders and large market participants. What the indicator deliver
FREE
Golden Delta Library — Free MT5 Tools Market Description This indicator is also integrated into the advanced   Golden Delta EDGE   trading panel. Short Description Golden Delta Library is a free MT5 toolkit for traders who want cleaner chart structure, Renko-based context, risk planning, and practical execution panels. The collection includes Renko indicators, SuperTrend / ADX Renko variants, XAUUSD helper panels, and RiskLab TradeDesk tools. Each product is designed to be lightweight, visual
FREE
Aggression Volume
Flavio Javier Jarabeck
4.29 (17)
Aggression Volume Indicator is the kind of indicator that is rarely found in the MQL5 community because it is not based on the standard Volume data provided by the Metatrader 5 platform. It requires the scrutiny of all traffic Ticks requested on the platform... That said, Aggression Volume indicator requests all Tick Data from your Broker and processes it to build a very special version of a Volume Indicator, where Buyers and Sellers aggressions are plotted in a form of Histogram. Additionally,
FREE
This indicator sums up the difference between the sells aggression and the buys aggression that occurred in each Candle, graphically plotting the waves of accumulation of the aggression volumes.   Through these waves an exponential average is calculated that indicates the direction of the business flow. Note: This indicator DOES NOT WORK for Brokers and/or Markets WITHOUT the type of aggression (BUY or SELL).   Be sure to try our Professional version with configurable features and alerts:  Agre
FREE
Vegas indicador
Valter Cezar Costa
3.5 (2)
Esse Indicador é uma boa opção para quem gosta de operar a longo prazo e com paciência. Ele trabalho com os níveis de fibo na media de 200 são  9 níveis  onde você pode operar nas reversões o mercado partir do níveis abaixo.    Level 1 = 550 pontos    Level 2 = 890 pontos    Level 3 = 1440 pontos    Level 4 = 2330 pontos    Level 5 = 3770 pontos    Level 7 = 9870 pontos    Level 8 = 15970 pontos   Level 9 = 25840 pontos      Level 6 = 6100 pontos
FREE
AP VWAP Bands Pro (MT5) Volume-weighted average price with ±σ bands for clear intraday bias, mean-reversion zones, and dynamic support/resistance. Works on crypto (incl. BTC) , FX , indices , and metals . Uses tick-volume when real volume isn’t available. What it shows VWAP line (volume-weighted mean price). Two envelopes around VWAP (default ±1σ and ±2σ) to highlight balance vs. extension. Reset modes : Day , Week , or Anchor Time (HH:MM) to start VWAP where you need it (e.g., exchange open).
FREE
Hunter’s Scope: ボラティリティおよびトレンド強度インジケーター (MT5) Hunter’s Scopeは、方向性の強さとボラティリティの両方をフィルタリングすることで価格拡大を特定する、MetaTrader 5用の高モメンタムインジケーターです。重要なインパルス(衝動)的なローソク足を検出し、モメンタムトレードのための明確かつ客観的なシグナルを提供します。 コアロジック:二層フィルター 遅行性のクロスオーバーではなく、以下の二段階確認モデルを使用します: トレンド強度 (ADX): ADXがユーザー定義のしきい値を超えた場合のみシグナルが発生し、レンジ相場や低モメンタム市場を除外します。 ボラティリティ拡大 (ATR): 特定のATR倍率を超えたローソク足のみをインパルスと見なし、統計的に有意な動きであることを保証します。 主な特徴 非再描画: ローソク足確定時にシグナルが生成され、固定されます。 モメンタム重視: 反応遅延型のインジケーターではなく、インパルス的な動きを狙います。 統合診断パネル: ADX、ATRしきい値、ローソク足サイズをリアルタイムで表示。 クリ
This indicator allows you to enjoy the two most popular products for analyzing request volumes and market deals at a favorable price: Actual Depth of Market Chart Actual Tick Footprint Volume Chart This product combines the power of both indicators and is provided as a single file. The functionality of Actual COMBO Depth of Market AND Tick Volume Chart is fully identical to the original indicators. You will enjoy the power of these two products combined into the single super-indicator! Below is
Caicai L&S Yield Histogram Important Notice: This indicator is an integral tool of the automated EA Caicai Long and Short Pair Trading . This indicator visually displays the percentage deviation (Yield %) of a pair's current spread relative to its own historical mean. It is an excellent tool for quickly visualizing the gross financial potential of a market distortion in Long & Short operations. Main Features: Percentage Visualization: Understand the size of the distortion in palpable percentage
概要 このインジケーターは、クラシックな ドンチャンチャネル を強化したバージョンで、実践的なトレード機能を追加しています。 標準の3本線(上限、下限、中央線)に加え、 ブレイクアウト を検出し、チャート上に矢印で視覚的に表示します。また、チャートを見やすくするために、 現在のトレンド方向と逆側のラインのみを表示 します。 インジケーターの機能: 視覚的シグナル :ブレイクアウト時にカラフルな矢印を表示 自動通知 :ポップアップ、プッシュ通知、Eメール RSIフィルター :市場の相対的な強弱に基づいてシグナルを検証 カスタマイズ可能 :色、ラインの太さ、矢印コード、RSI閾値など 動作原理 ドンチャンチャネルは次のように計算します: 上限線 :直近N本のクローズ済みローソク足の最高値 下限線 :直近N本のクローズ済みローソク足の最安値 中央線 :最高値と最安値の平均値 上方ブレイクアウト は終値が上限線を超えたときに発生し、 下方ブレイクアウト は終値が下限線を下回ったときに発生します。 インジケーターは以下を行います: 3本のドンチャンラインを描画 方向転換後の最初のブレイクアウト
FREE
このプロダクトを購入した人は以下も購入しています
ARIPoint is a powerful trading companion designed to generate high-probability entry signals with dynamic TP/SL/DP levels based on volatility. Built-in performance tracking shows win/loss stats, PP1/PP2 hits, and success rates all updated live. Key Features: Buy/Sell signals with adaptive volatility bands Real-time TP/SL/DP levels based on ATR Built-in MA Filter with optional ATR/StdDev volatility Performance stats panel (Success, Profit/Loss, PP1/PP2) Alerts via popup, sound, push, or email Cu
SuperScalp Pro
Van Minh Nguyen
4.63 (24)
SuperScalp Pro – 高度なマルチフィルタースキャルピングインジケーターシステム SuperScalp Pro は、クラシックな Supertrend と複数のインテリジェント確認フィルターを組み合わせた高度なスキャルピングインジケーターです。M1 から H4 まで複数の時間足で効率的に動作し、XAUUSD、BTCUSD、主要 Forex 通貨ペア向けに最適化されています。 このインジケーターは明確な Buy / Sell シグナルを提供し、ATR に基づいてエントリー価格、Stop Loss、Take Profit を自動計算します。Fibonacci Take Profit 機能により、重要な価格帯で早期決済し、到達時に通知を送信します。 初期設定では Fibonacci Take Profit が有効化されており、より安定した取引体験を重視しています。チャートに適用するだけですぐ利用可能です。上級者向けに、すべてのパラメータは自由にカスタマイズできます。 EMA、RSI、ADX、Volume、VWAP、Bollinger Bands、MACD Divergence な
Entry In The Zone and SMC Multi Timeframe is a real-time 2-in-1 market analysis tool that combines market structure analysis and a No Repaint BUY / SELL signal system into a single indicator, built on Smart Money Concepts (SMC) — a widely adopted framework used by professional traders to understand market structure. This indicator helps you see the market more clearly, make decisions based on structure rather than guesswork, and focus on high-probability zones where price is more likely to react
このインジケーターを購入された方には、以下の特典を 無料 で提供しています: 各トレードを自動で管理し、ストップロスとテイクプロフィットを設定し、戦略ルールに基づいてポジションを決済する補助ツール 「Bomber Utility」 様々な銘柄に合わせたインジケーターの設定ファイル(セットファイル) 「最小リスク」、「バランスリスク」、「待機戦略」 の3つのモードで使用できる Bomber Utility 用の設定ファイル このトレーディング戦略をすぐに導入・設定・開始できる ステップバイステップのビデオマニュアル ご注意: 上記の特典を受け取るには、MQL5のプライベートメッセージシステムを通じて販売者にご連絡ください。 オリジナルのカスタムインジケーター 「Divergence Bomber(ダイバージェンス・ボンバー)」 をご紹介します。これは、MACDのダイバージェンス(乖離)戦略に基づいた 「オールインワン」型のトレーディングシステム です。 このテクニカルインジケーターの主な目的は、価格とMACDインジケーターの間に発生するダイバージェンスを検出 し、将来の価格の動きを示す
Power Candles V3 - 自己最適化型強弱インジケーター Power Candles V3は 、通貨や銘柄の強さを、適用されたすべてのチャート上で実行可能なトレードプランに変換します。単にローソク足を色分けするだけでなく、バックグラウンドでリアルタイムの自動最適化を実行し、目の前の銘柄に対して最適なストップロス、テイクプロフィット、およびシグナルの閾値を提示します。ワンクリックで実取引に適用でき、エントリーポイント、ストップロス、テイクプロフィットのラインが正確な価格位置にチャート上に表示され、方向性を示すアラートがリアルタイムで発動します。 このツールは、Stein Investmentsのエコシステムの一部です。  18種類以上のツールをすべて閲覧し、AIを活用したセットアップの推奨事項を入手し、  https://stein.investments でコミュニティに参加しましょう クローズしたバーごとに3,000回以上のトレードシミュレーション。9つの強さの状態。2つの戦略を並行してテスト。勝率の高い設定をワンクリックで適用。 なぜこれが必要なのか ほとんどの強
SignalTech MT5 is a fully rule based trading system for EURUSD, USDCHF, USDJPY, AUDUSD, NZDUSD, EURJPY, AUDJPY, NZDJPY, CADJPY.  All the winning trades with chart setups are published on the comments page. 2025-12 1174 Pips 2026-01 2624 Pips 2026-02 2937 Pips 2026-03 2165 Pips 2026-04 2243 Pips It can generate signals with Buy/Sell Arrows and Pop-Up/Sound Alerts. Each signal has clear Entry and Stop Loss levels, which should be automatically flagged on the chart, as well as potential Targets 1,
ご紹介     Quantum Breakout PRO は 、ブレイクアウト ゾーンの取引方法を変革する画期的な MQL5 インジケーターです。 13年以上の取引経験を持つ経験豊富なトレーダーのチームによって開発されました。     クォンタム ブレイクアウト プロ   は、革新的でダイナミックなブレイクアウト ゾーン戦略により、あなたのトレーディングの旅を新たな高みに押し上げるように設計されています。 クォンタム ブレイクアウト インジケーターは、5 つの利益ターゲット ゾーンを備えたブレイクアウト ゾーン上のシグナル矢印と、ブレイクアウト ボックスに基づいたストップロスの提案を提供します。 初心者トレーダーにもプロのトレーダーにも適しています。 量子EAチャネル:       ここをクリック 重要!購入後、インストールマニュアルを受け取るためにプライベートメッセージを送ってください。 推奨事項: 時間枠: M15 通貨ペア: GBPJPY、EURJPY、USDJPY、NZDUSD、XAUUSD アカウントの種類: ECN、Raw、またはスプレッドが非常に低い R
Azimuth Pro
Ottaviano De Cicco
5 (7)
Azimuth Pro V2:MT5向けシンセティック・フラクタル構造分析と確認済みエントリー 概要 Azimuth Pro は Merkava Labs によるマルチレベルスイング構造インジケーターです。4つのネストされたスイングレイヤー、スイングアンカーVWAP、ABCパターン検出、3タイムフレーム構造フィルタリング、そして確定バーでの確認済みエントリー — 1つのチャートで、ミクロスイングからマクロサイクルまでを網羅するワークフロー。 これはブラインドシグナル製品ではありません。ロケーション、コンテキスト、タイミングを重視するトレーダーのための構造ファーストワークフローです。 V2発売記念オファー — Azimuth Pro V2をUSD 399で(次の100本)。最終価格:USD 499。 1. V2での変更点 シンセティック・マルチタイムフレームエンジン 上位タイムフレーム分析をMeridian Proと同じ独自のシンセティックアーキテクチャで一から再構築。よりクリーンなHTFコンテキスト、安定したライブ動作、従来のMTF同期問題なし。シンセティックエンジンは 固定比率タ
Gann Made Easy   は、ミスター・ギャンの理論を使用した取引の最良の原則に基づいた、プロフェッショナルで使いやすい外国為替取引システムです。 W・D・ガン。このインジケーターは、ストップロスとテイクプロフィットレベルを含む正確な買いと売りのシグナルを提供します。 PUSH通知を利用して外出先でも取引可能です。 ご購入後、取引方法の説明と優れた追加インジケーターを無料で入手するには、私にご連絡ください! おそらく、ギャンの取引手法についてはすでに何度も聞いたことがあるでしょう。通常、ギャンの理論は初心者のトレーダーだけでなく、すでにある程度の取引経験がある人にとっても非常に複雑なものです。なぜなら、ギャンの取引手法は理論的にはそれほど簡単に適用できるものではないからです。私はその知識を磨き、最良の原則を私の外国為替インジケーターに組み込むために数年を費やしました。 このインジケーターは非常に簡単に適用できます。必要なのは、それをチャートに添付し、簡単な取引推奨事項に従うだけです。このインジケーターは常に市場分析の仕事を行い、取引の機会を探します。適切なエントリーポイントを検
RelicusRoad Pro: 定量的市場オペレーティングシステム 【期間限定】無制限アクセス 70% OFF - 2,000人超のトレーダーと共に なぜ多くのトレーダーは「完璧な」インジケーターを使っても失敗するのでしょうか? それは、文脈を無視して 単一の概念 だけでトレードしているからです。文脈のないシグナルは単なるギャンブルです。勝ち続けるには、 根拠の重なり(コンフルエンス) が必要です。 RelicusRoad Proは単なる矢印インジケーターではありません。完全な 定量的市場エコシステム です。独自のボラティリティモデリングを用いて、価格が推移する「適正価値の道(Fair Value Road)」をマッピングし、ノイズと真の構造的ブレイクを判別します。 推測はやめましょう。機関投資家レベルの「ロード・ロジック」でトレードを。 コアエンジン:「Road」アルゴリズム システムの中心となる Road Algo は、市場環境にリアルタイムで適応するダイナミックなボラティリティチャネルです。 安全ライン(平衡点) と、価格が数学的に反転しやすい 拡張レベル を投影します。 Si
MetaTrader 5 向けスマート多層ブレイクアウト&プルバック検出器 「スマート・シンプル・ファスト!」 高確率のブレイクアウトエントリーを見逃すことにうんざりしていませんか? 複数のチャートを何時間もスキャンし、ブレイクアウトをトレンド方向と通貨のモメンタムに合わせようとして、それでも動きを逃してしまうことはありませんか? Break Pullback は、1つのインジケーターでそのすべてを解決します。 Break Pullback とは何ですか? Break Pullback は、マーケットストラクチャー、ブレイクアウト、トレンド継続のセットアップを取引するトレーダー向けに特別に設計されたプロフェッショナルグレードの MetaTrader 5 インジケーターです。 リアルタイムで複数の通貨ペアにわたるブレイクとプルバックの形成を自動的に検出し、3層の確認を通じてすべてのシグナルをフィルタリングします: ストラクチャラルブレイクアウト検出 — チャート上の主要なブレイクレベルを特定 HTF 日足バイアス — エントリーを支配的な日足トレンド方向に合わせる 通貨強弱指数 —
このインジケーターを購入すると、プロ仕様のトレードマネージャーを無料で差し上げます。 まず第一に、このトレーディングシステムがノンリペイント、ノンリドロー、ノンラグのインジケーターであることを強調する価値がある。これにより、手動取引とロボット取引の両方に理想的なものになっています。 オンラインコース、マニュアル、プリセットのダウンロード。 「スマートトレンドトレーディングシステム MT5」は、新規および経験豊富なトレーダー向けにカスタマイズされた包括的なトレーディングソリューションです。10以上のプレミアムインジケーターを組み合わせ、7つ以上の堅実なトレーディング戦略を備えており、多様な市場状況に対応する多目的な選択肢となっています。 トレンドフォロー戦略:トレンドを効果的に乗り越えるための正確なエントリーとストップロス管理を提供します。 リバーサル戦略:潜在的なトレンドの反転を特定し、トレーダーがレンジ相場を活用できるようにします。 スキャルピング戦略:高速で正確なデイトレードおよび短期取引のために設計されています。 安定性:すべてのインジケーターはノンリペイント、ノンリドロー、ノ
まず第一に、この取引インジケーターは再描画されず、再描画されず、遅延しないことを強調する価値があります。これにより、手動取引とロボット取引の両方に理想的なものになります。 ユーザーマニュアル:設定、入力、戦略。 アトミックアナリストは、価格の強さとモメンタムを利用して市場でより良いエッジを見つけるためのPA価格アクションインジケーターです。ノイズや誤ったシグナルを除去し、取引ポテンシャルを高めるための高度なフィルターを備えています。複雑なインジケーターの複数のレイヤーを使用して、アトミックアナリストはチャートをスキャンし、複雑な数学的計算をシンプルなシグナルと色に変換します。これにより、どのような初心者トレーダーでも理解して使用し、一貫した取引の決定を行うことができます。 「アトミックアナリスト」は、新規および経験豊富なトレーダー向けにカスタマイズされた包括的な取引ソリューションです。プレミアムインジケーターとトップノッチの機能を1つの取引戦略に組み合わせ、すべてのタイプのトレーダーにとって汎用性のある選択肢にします。 デイリートレーディングとスキャルピング戦略:高速で正確なデイ
Quantum TrendPulse を ご紹介します。これは、   SuperTrend   、   RSI   、および Stochastic のパワーを 1 つの包括的なインジケーターに組み合わせて、取引の可能性を最大限に引き出す究極の取引ツールです。精度と効率を求めるトレーダー向けに設計されたこのインジケーターは、市場のトレンド、勢いの変化、最適なエントリー ポイントとエグジット ポイントを自信を持って特定するのに役立ちます。 主な特徴: SuperTrend 統合: 現在の市場動向に簡単に追従し、収益性の波に乗ることができます。 RSI精度: 買われすぎと売られすぎのレベルを検出し、市場の反転のタイミングに最適で、SuperTrendのフィルターとして使用されます。 確率的精度: 確率的振動を活用して、変動の激しい市場で隠れたチャンスを見つけます。SuperTrend のフィルターとして使用されます。 マルチタイムフレーム分析:   M5 から H1 または H4 まで、さまざまなタイムフレームで市場を常に把握します。 カスタマイズ可能なアラート: カスタム取引条件が満たされ
FX Trend NG:次世代マルチマーケット・トレンドインテリジェンス 概要 FX Trend NG は、複数の時間足に対応したプロフェッショナル向けトレンド分析およびマーケット監視ツールです。 市場全体の構造を数秒で把握することができます。 複数のチャートを切り替える必要はありません。どの銘柄がトレンド中なのか、どこでモメンタムが弱まっているのか、そしてどの時間足で強い整合性があるのかを瞬時に確認できます。 ローンチ特別オファー – FX Trend NG を $30(6ヶ月) または $80 永久ライセンス でご利用いただけます。 すでに Stein Investments のユーザーですか? -> メッセージを送信 して、プライベートグループへアクセスしてください。 セットアップや詳細情報が必要ですか? -> Stein Investments 公式ページ をご覧ください。 1. FX Trend NG が他と異なる理由 3ステート・トレンドロジック ― Buy と Sell だけではない • 多くのインジケーターは Buy または Sell の2状態のみを表示します。
BTMM State Engine Pro is a MetaTrader 5 indicator for traders who use the Beat The Market Maker approach: Asian session context, kill zone timing, level progression, peak formation detection, and a multi-pair scanner from a single chart. It combines cycle state logic with a built-in scanner dashboard so you do not need the same tool on many charts at once. What it does Draws the Asian session range; session times can follow broker server offset or be set in inputs. Tracks level progression (L
Market Structure Order Block Dashboard MT5 は、市場構造と主要な価格反応ゾーンをチャート上で直接読み取りたいトレーダー向けに設計された MT5 インジケーターです。BOS、ChoCH、オーダーブロック、Fair Value Gap (FVG)、流動性、Kill Zones、Volume Profile、そして素早い分析のためのコンパクトなダッシュボードを組み合わせています。 本インジケーターは、市場構造、ICT、Smart Money の概念を意思決定の枠組みとして使用するトレーダーを対象としています。トレンド継続、反転の可能性、価格の不均衡、流動性ターゲット、注目ゾーンをより構造的に特定する助けとなります。 購入者向けの付属リソース 購入後、MQL5 のプライベートメッセージにてご依頼いただくと、完全な PDF ユーザーガイドとパラメータ設定のヒントを提供いたします。MQL5 のプライベートメッセージによる直接的な技術サポート。 バージョン 1.20 では 2 つの重要な追加機能があります: Pending BOS / Pending Cho
まず第一に、この取引ツールはノンリペイント、ノンリドロー、ノンラグの指標であり、プロの取引に理想的ですことを強調する価値があります。 オンラインコース、ユーザーマニュアル、デモ。 スマートプライスアクションコンセプトインジケーターは、新米から経験豊富なトレーダーまで、非常 に強力なツールです。Inner Circle Trader AnalysisやSmart Money Concepts Trading Strategiesなど、20以上の有用な指標を1つに組み合わせています。このインジケーターはスマートマネーコンセプトに焦点を当て、大手機関の取引方法を提供し、彼らの動きを予測するのに役立ちます。 特に、流動性分析に優れており、機関がどのように取引しているかを理解しやすくしています。市場のトレンドを予測し、価格の動きを慎重に分析するのに優れています。機関の戦略とトレードを合わせることで、市場の動向についてより正確な予測ができます。このインジケーターは多目的であり、市場構造を分析し、重要な注文ブロックを特定し、さまざまなパターンを認識するのに優れています。 このインジケーター
OrderFlux | MetaTrader 5 用フットプリント・オーダーフロー バージョン 2.0 – アクティブトレーダー向けのリアルタイム Bid/Ask 可視化 OrderFlux は MT5 用のフットプリントおよびオーダーフローインジケーターです。価格がどこに動いたかだけでなく、その動きの中で何が起きているか(各価格レベルの Bid/Ask ボリューム、デルタ、インバランス、ボリューム分布)を表示します。 多くのチャートはローソク足の最終結果しか表示しません。OrderFlux はそこに至るまでの過程を表示します。ローソク足の形状だけでなく、市場参加者の動向を読み取りたい場合にまさに役立ちます。 ライブチャートにおいて、OrderFlux は主に次の3つの質問に答えます: 現在、どこで積極的な買いまたは売りの圧力が市場に参入しているか? どの価格レベルでボリュームが吸収、または拒否されているか? 現在の動きはセッションのコンテキスト(背景)にどう適合しているか? インターフェースで得られるもの メインチャートは、Canvas ベースでフットプリントを直接レンダリングします
優れたテクニカルインジケーター「Grabber」をご紹介します。これは、すぐに使える「オールインワン」トレーディング戦略として機能します。 ひとつのコードに、市場のテクニカル分析ツール、取引シグナル(矢印)、アラート機能、プッシュ通知が強力に統合されています。 このインジケーターを購入された方には、以下の特典を無料で提供します: Grabberユーティリティ:オープンポジションを自動で管理するツール ステップバイステップのビデオマニュアル:インジケーターのインストール、設定、取引方法を解説 カスタムセットファイル:インジケーターをすばやく自動設定し、最大限の成果を出すための設定ファイル 他の戦略はもう忘れてください!Grabberだけが、あなたを新たなトレードの高みへと導いてくれるのです。 Grabber戦略の主な特徴: 推奨タイムフレーム:M5〜H4 対応通貨ペア・資産:どれでも使用可能ですが、私が実際に検証した以下を推奨します(GBPUSD、GBPCAD、GBPCHF、AUDCAD、AUDUSD、AUDSGD、AUDCHF、NZDUSD、NZDCAD、EURCAD、EURUSD、E
Crystal Heikin Ashi Signals - Professional Trend & Signal Detection Indicator Advanced Heikin Ashi Visualization with Intelligent Signal System for Manual & Automated Trading Final Price: $149 ---------> Price goes up $10 after every 10 sales . Limited slots available — act fast . Overview Crystal Heikin Ashi Signals is a professional-grade MetaTrader 5 indicator that combines pure Heikin Ashi candle visualization with an advanced momentum-shift detection system. Designed for both manual traders
まず正直に言いましょう。 どんなインジケーターも、それ単体であなたを利益化させることはできません。もしそう言う人がいるなら、それは夢を売っているだけです。完璧な売買シグナル(矢印)を表示するインジケーターは、いくらでも“完璧に見せる”ことができます。正しい過去の区間を拡大して、勝ちトレードだけを切り取ればいいだけです。私たちはそれをしません。 SMC Intraday Formula はツールです。 市場構造を読み取り、最も高い確率の価格ゾーンを特定し、今この瞬間のスマートマネーの痕跡をシンプルな言葉で正確に示します。最終判断はあなたが行います。トレードを実行するのもあなたです。しかし今は「希望」ではなく「精度」でエントリーできます。 私たちはこのインジケーターを、ゴールド(XAUUSD)および主要FX通貨ペアで約3年間、日々のスキャルピングに使用してきました。M1、M5、M15、M30の主要ツールです。これは未来を予測しようとするのではなく、今まさに形成されている高確率セットアップを示し、その理由を説明します。 他のすべてのインジケーターと何が違うのか? ほとんどのトレーディングイ
「 Dynamic Scalper System MT5 」インジケーターは、トレンド波の中でスキャルピング取引を行う手法のために設計されています。 主要通貨ペアと金でテスト済みで、他の取引商品との互換性があります。 トレンドに沿った短期的なポジションオープンのシグナルを提供し、追加の価格変動サポートも提供します。 インジケーターの原理 大きな矢印はトレンドの方向を決定します。 トレンド波の中では、小さな矢印の形でスキャルピングシグナルを生成するアルゴリズムが機能します。 赤い矢印は強気方向、青い矢印は弱気方向です。 トレンドの方向には敏感な価格変動ラインが描かれ、小さな矢印のシグナルと連動します。 シグナルは次のように機能します。適切なタイミングでラインが現れるとエントリーシグナルが形成され、ラインが開いている間はポジションが保持され、完了すると取引が終了します。 推奨される動作時間枠はM1~H4です。 矢印は現在のローソク足に形成され、次のローソク足が開いている場合は、前のローソク足の矢印は再描画されません。 入力パラメータ Trend Wave Period - トレ
このダッシュボードは、選択されたシンボルの最新の利用可能なハーモニックパターンを表示するので、時間を節約し、より効率的に /   MT4バージョン 。 無料インジケーター:   Basic Harmonic Pattern インジケーター列 Symbol : 選択したシンボルが表示されます。 Trend :   強気または弱気 Pattern : パターンの種類(ガートレー、バタフライ、バット、カニ、サメ、サイファー、ABCD) Entry : エントリー価格 SL: ストップロス価格 TP1: 1回目の利食い価格 TP2: 2回目の利食い価格 TP3:   3回目の利食い価格 Current price :   現在値 Age (in bars):    最後に描画されたパターンの年齢 主な入力項目 Symbols:   "28 Major Currency Pairs "または "Selected Symbols "から選択。 Selected Symbols:   カンマで区切られた監視したいシンボル("EURUSD,GBPUSD,XAUUSD")。ブローカーがペアに接
Meridian Pro
Ottaviano De Cicco
5 (2)
Meridian Pro 2.00:MT5向けプロ仕様マルチタイムフレーム・トレンドマトリクス Meridian Pro 2.00 は、MetaTrader 5 向けのプロ仕様の適応型トレンドマトリクスです。オリジナルの Meridian トレンドエンジン、クリーンなチャート ribbon、確定足ベースのシグナル矢印、8時間足 dashboard、Fuel momentum、weighted consensus、synthetic HTF processing、そしてチャート上に直接表示される上位足コンテキストラインを統合します。 目的はシンプルです。現在のトレンド、マルチタイムフレーム構造、強度、momentum、EA-ready 状態を、複数チャートに無関係なインジケータを重ねるのではなく、1つの整理された workflow で読むことです。 Meridian Pro の違い 1つの適応型エンジン - 同じ volatility-aware Meridian ロジックを M1 から W1 まで適用します。 Synthetic HTF architecture - 上位足行は下位足デ
OmniSync Projection
Antonio-alin Teculescu
5 (1)
Chronos Fractal Engine is an innovative price projection indicator for MetaTrader 5, designed to transform your technical analysis by intelligently identifying and projecting historical price patterns. Built upon an advanced correlation algorithm and the fractal principles of the market, this powerful tool visualizes potential future price movements, giving you a unique edge in your trading decisions. What is Chronos Fractal Engine? At its core, the Chronos Fractal Engine employs a sophisticat
FX Power: 通貨の強弱を分析して、より賢い取引を実現 概要 FX Power は主要通貨と金の実際の強弱をあらゆる市場状況で理解するための必須ツールです。強い通貨を買い、弱い通貨を売ることで、 FX Power は取引の意思決定を簡素化し、高い確率の取引機会を見出します。トレンドを追従する場合でも、極端なデルタ値を使用して反転を予測する場合でも、このツールはあなたの取引スタイルに完全に適応します。ただ取引するだけではなく、 FX Power で賢く取引をしましょう。 1. なぜ FX Power がトレーダーにとって非常に有益なのか 通貨と金のリアルタイム強弱分析 • FX Power は主要通貨と金の相対的な強弱を計算し、マーケットダイナミクスに関する明確な洞察を提供します。 • どの資産がリードしているか、または後れを取っているかを監視して、取引するペアを賢く選びましょう。 マルチタイムフレームの包括的なビュー • 短期、中期、長期のタイムフレームで通貨と金の強弱を追跡し、マーケットトレンドに基づいて取引戦略を調整できます。 • スキャルピングからスイングトレード
FX Levels: あらゆる市場における非常に高精度なサポート&レジスタンス 概要 通貨ペア、株式指数、個別銘柄やコモディティなど、どのような市場でも信頼できるサポートとレジスタンスを特定したいですか? FX Levels は伝統的な “Lighthouse” メソッドと先進的な動的アプローチを融合し、ほぼ汎用的な精度を実現します。ブローカーの実務経験を活かし、自動化されたデイリー更新とリアルタイム更新を組み合わせることで、 FX Levels は反転ポイントを見つけ、利益目標を設定し、自信をもってトレードを管理するための手助けをします。今すぐ試してみて、サポート/レジスタンス分析の正確性がどれほどトレードを向上させるかを実感してください! 1. FX Levels がトレーダーにとって非常に有用な理由 非常に正確なサポート&レジスタンスゾーン • FX Levels は異なるブローカー環境でもほぼ同一のゾーンを生成するよう設計されており、データフィードの差異や時刻設定のずれによる不一致を解消します。 • つまり、どのブローカーを利用していても一貫したレベルが得られるため、戦
Market Structure Patterns
Samuel Manoel De Souza
4.47 (19)
Market Structure Patterns   is an indicator based on   smart money concepts   that displays   SMC/ICT   elements that can take your trading decisions to the next level. Take advantage of the   alerts ,   push notifications   and   email messages   to keep informed from when an element is formed on the chart, the price crosses a level and/or enters in a box/zone. Developers can access the values of the elements of the indicator using the   global variables  what allows the automation of trading
トレンドラインプロ   市場の真の方向転換点を理解するのに役立ちます。この指標は、真のトレンド反転と主要プレーヤーが再び参入するポイントを示します。 分かりますか     BOSライン   複雑な設定や不要なノイズなしに、より長い時間足でのトレンドの変化と重要なレベルを把握できます。シグナルは再描画されず、バーが閉じた後もチャート上に残ります。 MT4バージョン   -   RFI LEVELS PRO インジケーター と組み合わせることで、その最大限の能力を発揮します インジケーターが示す内容: 本当の変化   トレンド(BOSライン) 一度シグナルが現れたら、それは有効です!これは、リペイント機能を持つインジケーターとの重要な違いです。リペイント機能を持つインジケーターは、シグナルを発した後、それを変更し、資金の損失につながる可能性があります。これにより、より高い確率と精度で市場に参入できます。また、矢印が現れた後、目標値(利益確定)に達するか、反転シグナルが現れるまで、ローソク足の色を変更する機能もあります。 繰り返しエントリ   主要プレーヤーの補充 エントリーポイントを探す
作者のその他のプロダクト
With the Anchored VWAP for MT4 from Trading.de, you can easily calculate and display the volume-based average price starting from a specific point in the chart (anchor). The indicator is ideal for our Trading.de 1-minute chart strategy, but can also be used in all other timeframes. The AVWAP for MetaTrader 4 is calculated using volume or an average period. In the settings, you can specify whether or not to use real trading volume. The indicator also has a "Lock" button in the upper right corner
フィルタ:
レビューなし
レビューに返信