Kerberos The Market Guard

Kerberos – マーケットガーディアン
(ギリシャ神話に登場する伝説の三つ頭の犬にちなんで名付けられた。絶え間ない警戒、圧倒的な力、そして容赦ない精度の象徴。)

コンセプト:

Kerberos は、高精度で多層的なトレンドフォロー型インジケーターです。
量よりも質と安全性を重視するトレーダーのために設計されています。
3つの確立された分析手法を組み合わせ、最高のチャンスのみを厳選します — 完璧な瞬間だけに行動する守護者のように:

  • EMA 50 および EMA 200 ➔ トレンド方向の確認

  • RSI (14) ➔ 過熱感(買われすぎ・売られすぎ)を判断

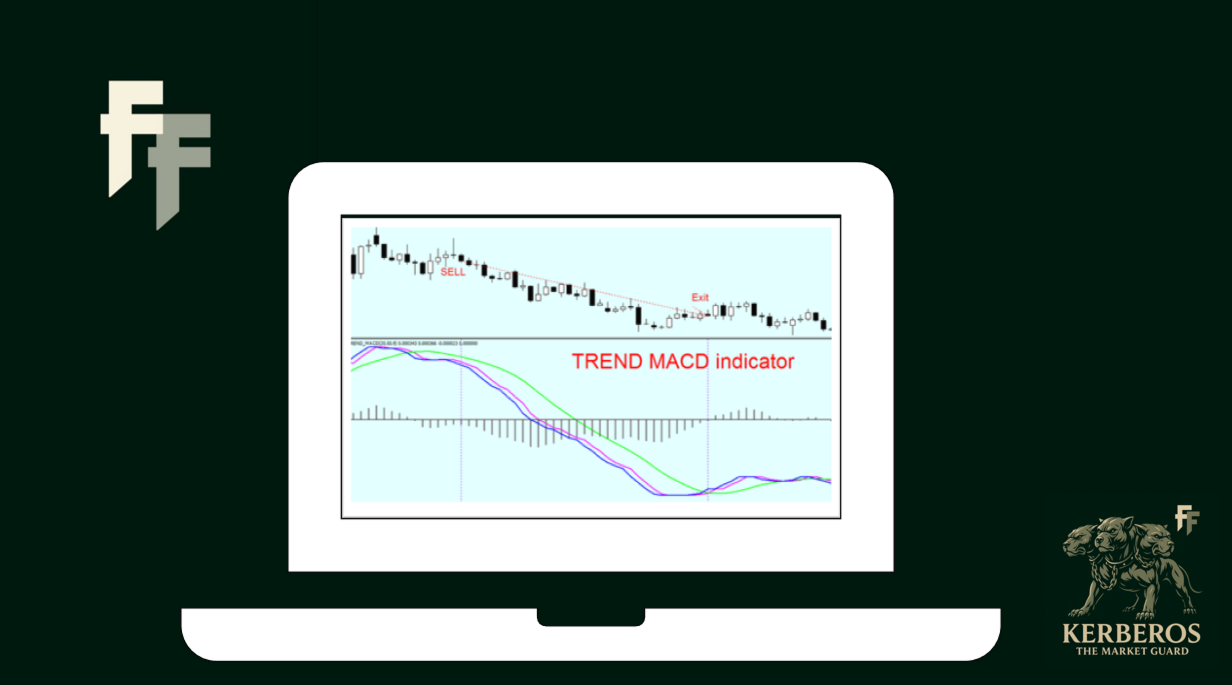
  • MACD ➔ モメンタムの変化を正確に捉える

すべての条件が同時に満たされたときにのみ、Kerberos は明確なBUYまたはSELLシグナルを発します。

動作原理:

買いシグナル(緑色ラベル):

  • EMA50 が EMA200 の上にある ➔ 上昇トレンド確認

  • RSI が70未満 ➔ 市場はまだ買われすぎではない

  • MACDラインがシグナルラインを下から上へクロス ➔ モメンタムが上昇方向へ転換

売りシグナル(赤色ラベル):

  • EMA50 が EMA200 の下にある ➔ 下降トレンド確認

  • RSI が30以上 ➔ 市場はまだ売られすぎではない

  • MACDラインがシグナルラインを上から下へクロス ➔ モメンタムが下降方向へ転換

アラート機能:

新しいシグナルが出た際に、ポップアップ通知やプッシュ通知をオプションで有効にできます — チャンスを逃さないために。

主な特徴:

特徴 説明
マーケットガード原則 Kerberos はトレンド方向に沿ったシグナルのみをフィルタリングし、ノイズを排除します。
正確なエントリー MACDクロス確認時にのみエントリーするため、タイミングが的確です。
明確なシグナル表示 BUY/SELLラベルがメインチャートの該当ローソク足付近に表示されます。
高い柔軟性 全パラメーターは自由にカスタマイズ可能です。

推奨使用方法:

  • 時間足: M15、H1、H4、D1

  • 対象市場: FX、ゴールド、株価指数、主要な暗号資産(仮想通貨)

  • 取引スタイル: トレンドフォロー型、中長期戦略。

伝説:

Kerberos は市場の門を守ります。
すべての動きに反応するのではなく、冷静に機会を待ち、完璧なチャンスが訪れたときのみ、容赦なく攻撃します。

短縮版:

「Kerberosは市場を守護し、真のチャンスにのみ攻撃を仕掛ける。」


おすすめのプロダクト
The Magic SMMA indicator is of great help in determining trend direction. It can be an excellent addition to your existing strategy or the basis of a new one. We humans can make better decisions when we see better visually. So we designed it to show a different color for rising and falling trends. Everyone can customize this in the way that suits them best. By setting the Trend Period, we can optimize it for longer or shorter trends for our strategy. It is great for all time frames. IF YOU NEE
FREE
Ichimoku Map (instant look at the markets) - built on the basis of the legendary Ichimoku Kinko Hyo indicator. The task of the Ichimoku Map is to provide information about the market strength on the selected time periods and instruments, from the point of view of the Ichimoku indicator. The indicator displays 7 degrees of buy signal strength and 7 degrees of sell signal strength. The stronger the trend, the brighter the signal rectangle in the table. The table can be dragged with the mouse. The
ApexVol Grid EA
TECHAURORA - FZCO
5 (1)
ATTENTION This is NOT a normal Grid / Martingale EA. Here are the setfiles: https://mega.nz/folder/fQF0hbRR#oIvhJcOVZXGRZMLYHr9_vw ApexVol Grid EA is a fully automated trading algorithm for MetaTrader 5. It is built on a volatility-filtered grid trading system and operates using dynamic moving average channels. The EA is designed to detect optimal entry zones during stable market conditions and execute trades in both directions based on predefined grid levels. The first 5 copies are availa
Introduction to Fractal Pattern Scanner Fractal Indicator refers to the technical indicator that makes use of the fractal geometry found in the financial market. Fractal Pattern Scanner is the advanced Fractal Indicator that brings the latest trading technology after the extensive research and development work in the fractal geometry in the financial market. The most important feature in Fractal Pattern Scanner is the ability to measure the turning point probability as well as the trend probabil
Correlation Matrix Pro - マルチ通貨ヘッジスキャナー 通貨ペア間の相関関係をリアルタイムで把握! 最大6つの通貨ペア間の統計的関係を同時に可視化する強力な分析ツールです。ポートフォリオ管理、リスク分散、ヘッジ戦略に最適です。 主な機能 - 対数リターンを使用したリアルタイムピアソン相関 - 最大6通貨ペアを同時監視 - 自動タイムフレーム検出 - 調整可能な遡及期間(5-200本) - ヘッジ機会の自動検出 - ミニマルで折りたたみ可能なパネルデザイン - 即座に解釈できるカラーコード付きマトリックス カラーコード 緑 (+0.70 〜 +1.00) = 強い正の相関 薄緑 (+0.50 〜 +0.69) = 中程度の正の相関 グレー (-0.49 〜 +0.49) = 弱い/相関なし オレンジ (-0.50 〜 -0.69) = 中程度の負の相関 赤 (-0.70 〜 -1.00) = 強い負の相関(ヘッジ) なぜ相関分析が重要? リスク管理 高相関ポジションによるリスクの二重化を回避。 ヘッジ戦略 効果的なヘッジのため、強い負の相関を持つペアを自動検出。
FREE
If you need more information than a few numbers in the iExposure index, this indicator is for you. Better iExposure indicator is an improvement over the original information, such as: Separate profit column for BUY and SELL Separate SL column for BUY and SELL Separate TP column for BUY and SEL Average Price as Horizontal Line in Chart Pip Value Profit https://www.facebook.com/groups/prop4y iExposure will show the opening of trading positions in tabular form in the sub-window below the main wi
MultiWay EA
PAVEL UDOVICHENKO
4.89 (19)
MultiWay EA は、強力な平均回帰戦略に基づいた、スマートで効率的な自動売買システムです。9つの相関関係のある(さらには通常「トレンド型」とされるものも含む)通貨ペア — AUDNZD、NZDCAD、AUDCAD、USDCAD、EURUSD、GBPUSD、EURCAD、EURGBP、GBPCAD — による広範な分散により、強い方向性の動きの後に価格が平均へ戻る動きを捉えます。 購入後、完全なセットアップ手順を受け取るためにプライベートメッセージを送ってください。 リアルタイムシグナル:  こちらをクリック 現在の価格 —   次の10名様はわずか $1937。 MultiWay EA は、シンプルさ、安定性、明確なロジックを重視する方に最適です — 複雑な設定は不要ですが、柔軟な資金管理とリスクコントロール機能を備えています。 このEAは本当の「セットして忘れる」哲学に従っています。ユーザーの介入を最小限に抑えながら、何年も安定して稼働でき、長期戦略に理想的です。 MultiWay EA を単独で使用することも、多様化ポートフォリオの重要な構成要素として追加す
Algo Pumping
Ihor Otkydach
4.76 (21)
PUMPING STATION – あなた専用の「オールインワン」戦略 PUMPING STATIONは、あなたのトレードをより楽しく、そして効果的に変えてくれる革新的なFXインジケーターです。ただの補助ツールではなく、強力なアルゴリズムを備えた本格的なトレーディングシステムで、より安定したトレードのスタートをサポートします。 この商品をご購入いただくと、以下の特典を無料でお付けします: 専用セットファイル:自動設定による最大パフォーマンスを実現。 ステップバイステップのビデオマニュアル:PUMPING STATION戦略の使い方を学べます。 Pumping Utility:PUMPING STATION専用の半自動トレードボットで、より快適かつシンプルな運用を可能にします。 ※ご購入後すぐにご連絡ください。追加リソースへのアクセスを提供いたします。 PUMPING STATIONの仕組み: トレンド管理:市場のトレンド方向を即座に判断。トレンドはあなたの最高の味方です。 エントリーサイン:チャート上の矢印で、取引のタイミングと方向を明確に示します。 明確な目標設定:インジケーターが自
BullBea Display
Everton Fernando Da Silva Messias
1. 基本情報 インジケーター名:   BullBear Display バージョン:   1.00 開発者:   [あなたの名前] 会社:   MT5TOOLSLAB 種類:   チャートインジケーター 市場:   外国為替、株式、先物、暗号通貨 2. 説明 BullBear Display   は以下をリアルタイムで表示する視覚的インジケーターです: ブル(買い手)の強さ ベア(売り手)の強さ 市場支配権(価格をコントロールしている側) このインジケーターはチャートの左上隅に情報を表示し、市場センチメントの迅速な分析を可能にします。 3. インストール BullBear_Display.mq5   を保存:   \MQL5\Indicators\ MetaTrader 5を再起動 「ナビゲータ」ウィンドウで「カスタムインジケーター」を探す 目的のチャートにドラッグ&ドロップ 4. 入力パラメータ PeriodBuySell   (デフォルト: 13): EMA参照計算の期間。低い値はより敏感なシグナルを、高い値はより滑らかなシグナルを生成します。 5. シグナル解釈 支配: ブル
Advisor for hedging trading or pair trading. A convenient panel allows you to open positions on the necessary trading instruments and lots. Automatically determines the type of trading account - netting or hedging. Advisor can close all its positions upon reaching profit or loss (determined in the settings). A negative value is required to control losses (for example, -100, -500, etc.). If the corresponding fields are 0, the EA will not use this function.   Settings: Close profit (if 0 here
Introducing the   Elite Chart Navigator   — your ultimate MetaTrader 5 Expert Advisor designed to revolutionize multi-symbol trading with seamless chart navigation and superior usability. Product Overview The   Elite Chart Navigator EA   is a sophisticated trading utility enabling rapid switching between multiple trading pairs through an intuitive on-chart button interface. Built for professional traders managing numerous instruments, this EA dramatically improves workflow efficiency, ensuring
3 candel indicator in 1 !!! The 3 most important candel indicator in 1 packadge. Help trader in chart visualisation, prevent reversal !!! Doji : Gravestone Doji, Long Legged Doji, Dragonfly Doji. Engulfing : Bullish, Bearish. Hammer : red hammer, green hammer. Fully parametrable indicator icon color config and alarm. Free life time update !!! Just try our demo for free.
Introducing the MAYARI MT5: The Trend Indicator Expert Advisor *Set Files for EURUSD available on the Comments Section *RESULTS SHOWN HERE ARE NOT OVER OPTIMIZED UNLIKE OTHER BOTS THE IS FOR SALE! ONLY REALISTIC RESULTS! *The default settings of MAYARI MT5 are optimized for EURUSD, based on rigorous back-testing over a 4-year period. For safe and effective operation, it's recommended to use the default settings with an account balance of at least $1,000 USD. Embark on a journey where technology
Inspired by the popular beat the market maker Multi MA. Now available for MT5 to be utilized. Multi Exponential Moving Average (Multi-EMA) Indicator for MT5 The Multi-EMA Indicator is designed to help traders visualize multiple exponential moving averages on one chart with precision and clarity. It plots five customizable EMA lines, each with distinct colors, making it easy to identify market trend direction, strength, and potential reversal zones at a glance. Key Features: Plots five indepen
The Hrum indicator was created to neutralize temporary pauses and rollbacks. It analyzes price behavior and, if there is a temporary weakness in the trend, you can notice this from the indicator readings, as in the case of a pronounced change in trend direction. Entering the market is not difficult, but staying in it is much more difficult. With the Giordano Bruno indicator and its unique trend line, staying on trend will become much easier! Every rise and every fall is reflected in your emoti
**Zonar Smart Analysis** is a complete "Smart Money" trading system designed for MetaTrader 5. It automates the classic **Opening Range Breakout (ORB)** strategy while filtering false signals using advanced Price Action algorithms (Wick Rejection & Swing Analysis). Stop guessing where the session is going. Let Zonar draw the zones, identify the breakout, and highlight institutional Order Blocks for maximum confluence. ### Key Features * **Automated ORB Box:** Automatically detects the Market
DirectionBias4 Pro
Luigi Salvatores Buigues Morillo
DirectionBias4 Pro is an institutional-grade algorithmic trading system designed for serious traders and Prop Firm challengers. Unlike traditional indicators that rely on a single lagging moving average, DB4 Pro uses an advanced Weighted Scoring Engine to evaluate the market from three different dimensions simultaneously, filtering out fake breakouts and market noise. Developed by Luis Buigues (binaryoption.cloud), this system has been rigorously backtested and Out-Of-Sample validated. Core S
Market Structure Quantum Scanner is a professional-grade multi-timeframe analysis tool designed to help traders identify the most structurally sound timeframes for trading while filtering out market noise. Core Function The indicator simultaneously monitors   4 different timeframes   (configurable) and quantifies market structure quality using advanced mathematical algorithms, presenting the data in an intuitive dashboard format. Key Benefits Find Your Edge : Instantly identifies which timeframe
Crystal FVG Touch Detector – スマートマネーコンセプト対応高機能インジケーター Crystal FVG Touch Detector は、Smart Money Concepts (SMC) と ICT 手法を使用するトレーダー向けに設計されたプロ仕様の指標です。 あらゆる時間足で Fair Value Gap (FVG) を自動検出し、タッチをリアルタイムに認識して表示します。 リペイントしないアルゴリズムにより、機関トレーダーの不均衡ゾーンを正確に把握します。 主な特徴 FVG(強気・弱気)を自動で検出。 タッチ時に即時更新。 全時間足対応。 カラー自動調整。 高速・安定動作。 カスタマイズ可能な設定。 キーワード: FVG, Fair Value Gap, Smart Money Concepts, SMC, ICT, Order Block, Imbalance, 流動性, サプライ・デマンド, Non Repaint, Volume Spread Analysis, Market Structure, CHoCH, BOS, Liquidity
FREE
Caicai L&S Z-Score Monitor Important Notice: This indicator is an integral tool of the automated EA Caicai Long and Short Pair Trading . If you are looking for the complete automation solution for this strategy, visit the EA page! This indicator monitors Long & Short (Pair Trading) operations by calculating the Z-Score of the spread between two defined assets (Asset Y and Asset X). It is an essential visual tool for identifying mean reversion opportunities. Key Features: Two Calculation Metho
Visual Trend Reversals — Professional Trend Reversal Indicator for MetaTrader 5 Visual Trend Reversals is a modern and efficient indicator for MetaTrader 5, specifically designed for the timely identification of trend reversal points and analysis of market conditions on any instrument: forex, cryptocurrencies, stocks, indices, and commodities. The indicator is optimized to improve entry quality, minimize false signals, and maximize clarity for traders of any experience level. Key Advantages of V
Logiciel MQL5 – TIME BOX PRO v2.0 概要 TIME BOX PRO v2.0 , MetaTrader 5 Liste des prix ​ Description du produit :  Y EAR(年)、SEMESTRE(半期)、QUARTER(四半期)、MONT H, SEMAINE, JOUR, jour ( HB 90 %, 50 %, 10 %) Logiciel MQL5化されており、全ての重要期間を迅速かつ効率的に確認できます。 主な機能 マルチタイムフレーム : ANNÉE, SEMESTRE, TRIMESTRE, MOIS, SEMAINE, JOUR ️ タイムフレームごとのカラーボックス で価格レンジを視覚化 カスタマイズ可能な HBレベル (90%, 50%, 10%) ️ 動的ラベル により期間を表示 (ANNÉE, S1, Q1, M1, SEMAINE, JOUR) Processeur CPU  : タイムフレームごとの表示/非表示 を入力設定で切替可能 表示期間の制限 で最
The  Smart FVG Statistics Indicator  is a powerful MetaTrader 5 tool designed to automatically identify, track, and analyze Fair Value Gaps (FVGs) on your charts. Love it? Hate it? Let me know in a review! Feature requests and ideas for new tools are highly appreciated. :) Try "The AUDCAD Trader": https://www.mql5.com/en/market/product/151841 Key Features Advanced  Fair Value Gap  Detection Automatic Identification : Automatically scans for both bullish and bearish FVGs across specified histo
FREE
BlackBox XAU — ゴールド向け先進型エキスパートアドバイザー 概要 BlackBox XAU は、ゴールド市場で利益を狙いながら、ドローダウンを厳格に管理するために丁寧に設計されたトレーディングシステムです。市場のすべての値動きを追いかけるのではなく、規律あるルールベースのアプローチを採用し、ボラティリティに適応しながら 高確率のトレード機会 のみを抽出します。 EA はリアルタイムで市場状況を継続的に評価し、質の低いシグナルを排除して、リスクとリワードのバランスが明確に有利になったタイミングを辛抱強く待ちます。条件が揃うと、精密なエントリーと動的に調整される保護機能を伴ってトレードを実行します。 この慎重な設計により、BlackBox はチャートを大量のエントリーで埋め尽くすことはなく、 量より質 を重視します。統計的に優位性のあるセットアップに集中することで、トレーダーにとって 安定した収益性、管理されたドローダウン、リスク調整後の一貫したリターン へとつながります。 仕組み BlackBox の中核は、市場のボラティリティとトレンドの変化を継続的に監視し、 リスクを大
Big Player Range
Thalles Nascimento De Carvalho
5 (3)
BigPlayerRange — MT5向け最強インジケーター BigPlayerRange は、MetaTrader 5 で日経ミニやドル先物などの取引において、 最も効果的なインジケーター と評価されています。大口投資家(機関投資家)の行動を可視化し、高精度なテクニカル分析を可能にします。 どのように機能するのか? BigPlayerRangeは、買い圧力ゾーン(緑ライン)と売り圧力ゾーン(赤ライン)を描画し、価格がその範囲を超えるとトレンド方向への動きを示唆します。 緑のライン上で終値: 買いの勢いが強く、上昇トレンドの可能性。 赤のライン下で終値: 売り圧力が優勢で、下落が予想される。 範囲内での価格: レンジ相場でブレイクを待つ段階。 主なメリット: 機関投資家ゾーンの検出: 大口のエントリーポイントを視覚化。 自動ターゲット計算: 利確ポイントを戦略的に設定。 プルバックの可能性分析: リスク管理に役立つ情報提供。 推奨の使い方: Imbalance DOM Pro と併用してゾーンブレイクを確認。 SwingVolum
Afribold Cybernetic Affluence
Itumeleng Mohlouwa Kgotso Tladi
AfriBold Cybernetic Affluence  Your Key to Autonated Trading In the dynamic world of financial markets, navigating the intricate patterns and making informed decisions can be a daunting task. Even seasoned traders face challenges in consistently outperforming the market. This is where the AfriBold Cybernetic Affluence emerges as a powerful tool, designed to automate your trading strategies. Harnessing the Power of AI The AfriBold Cybernetic Wealth Expert Advisor is a cutting-edge trading tool
Trend Strength Overview is a MetaTrader 5 indicator for analyzing trend strength across multiple symbols and timeframes . The values help you identify the best trend opportunities and indicate reversals It displays a compact panel on the main chart and a strength oscillator in a separate window. The panel allows fast comparison of trend conditions, while the oscillator helps visualize bullish, bearish, and neutral phases on the current chart. Clicking a panel cell switches the chart to the se
Genotype : Your reliable guide in the world of Forex Genotype is an advanced Forex trading bot specifically designed for traders seeking efficient and automated trading. This innovative tool offers a wide range of features and capabilities to enable traders to effectively manage their trades and strategies. Special offer for early adopters: price reduced, but will be increased in the future. Tools for work: EURUSD, AUDCAD, AUDCHF, AUDJPY, AUDNZD, AUDSGD, AUDUSD, CADCHF, CADJPY, GBPSEK, GBPSGD
PipFinite Impulse PRO MT5
Karlo Wilson Vendiola
4.88 (16)
Are You Tired Of Getting Hunted By Spikes And Whipsaws? Don't become a victim of the market's erratic moves.. Do Something About It! Instantly make smarter decisions with Impulse Pro's precise balance of filters and accurate statistics. Timing Is Everything In Trading To learn more, please visit www.mql5.com/en/blogs/post/718212 Anticipate the next big move before it unfolds in 3 Simple Steps! Advantages You Get Early impulse detection algorithm. Flexible combination to different trading s
このプロダクトを購入した人は以下も購入しています
Azimuth Pro
Ottaviano De Cicco
5 (6)
Azimuth Pro V2:MT5向けシンセティック・フラクタル構造分析と確認済みエントリー 概要 Azimuth Pro は Merkava Labs によるマルチレベルスイング構造インジケーターです。4つのネストされたスイングレイヤー、スイングアンカーVWAP、ABCパターン検出、3タイムフレーム構造フィルタリング、そして確定バーでの確認済みエントリー — 1つのチャートで、ミクロスイングからマクロサイクルまでを網羅するワークフロー。 これはブラインドシグナル製品ではありません。ロケーション、コンテキスト、タイミングを重視するトレーダーのための構造ファーストワークフローです。 V2発売記念オファー — Azimuth Pro V2をUSD 399で(次の100本)。最終価格:USD 499。 1. V2での変更点 シンセティック・マルチタイムフレームエンジン 上位タイムフレーム分析をMeridian Proと同じ独自のシンセティックアーキテクチャで一から再構築。よりクリーンなHTFコンテキスト、安定したライブ動作、従来のMTF同期問題なし。シンセティックエンジンは 固定比率タ
OmniSync Projection
Antonio-alin Teculescu
5 (1)
Chronos Fractal Engine is an innovative price projection indicator for MetaTrader 5, designed to transform your technical analysis by intelligently identifying and projecting historical price patterns. Built upon an advanced correlation algorithm and the fractal principles of the market, this powerful tool visualizes potential future price movements, giving you a unique edge in your trading decisions. What is Chronos Fractal Engine? At its core, the Chronos Fractal Engine employs a sophisticat
ARICoin is a powerful trading companion designed to generate high-probability entry signals with dynamic TP/SL/DP levels based on volatility. Built-in performance tracking shows win/loss stats, PP1/PP2 hits, and success rates all updated live. Key Features: Buy/Sell signals with adaptive volatility bands Real-time TP/SL/DP levels based on ATR Built-in MA Filter with optional ATR/StdDev volatility Performance stats panel (Success, Profit/Loss, PP1/PP2) Alerts via popup, sound, push, or email Cust
まず第一に、この取引ツールはノンリペイント、ノンリドロー、ノンラグの指標であり、プロの取引に理想的ですことを強調する価値があります。 オンラインコース、ユーザーマニュアル、デモ。 スマートプライスアクションコンセプトインジケーターは、新米から経験豊富なトレーダーまで、非常 に強力なツールです。Inner Circle Trader AnalysisやSmart Money Concepts Trading Strategiesなど、20以上の有用な指標を1つに組み合わせています。このインジケーターはスマートマネーコンセプトに焦点を当て、大手機関の取引方法を提供し、彼らの動きを予測するのに役立ちます。 特に、流動性分析に優れており、機関がどのように取引しているかを理解しやすくしています。市場のトレンドを予測し、価格の動きを慎重に分析するのに優れています。機関の戦略とトレードを合わせることで、市場の動向についてより正確な予測ができます。このインジケーターは多目的であり、市場構造を分析し、重要な注文ブロックを特定し、さまざまなパターンを認識するのに優れています。 このインジケーター
RelicusRoad Pro: 定量的市場オペレーティングシステム 【期間限定】無制限アクセス 70% OFF - 2,000人超のトレーダーと共に なぜ多くのトレーダーは「完璧な」インジケーターを使っても失敗するのでしょうか? それは、文脈を無視して 単一の概念 だけでトレードしているからです。文脈のないシグナルは単なるギャンブルです。勝ち続けるには、 根拠の重なり(コンフルエンス) が必要です。 RelicusRoad Proは単なる矢印インジケーターではありません。完全な 定量的市場エコシステム です。独自のボラティリティモデリングを用いて、価格が推移する「適正価値の道(Fair Value Road)」をマッピングし、ノイズと真の構造的ブレイクを判別します。 推測はやめましょう。機関投資家レベルの「ロード・ロジック」でトレードを。 コアエンジン:「Road」アルゴリズム システムの中心となる Road Algo は、市場環境にリアルタイムで適応するダイナミックなボラティリティチャネルです。 安全ライン(平衡点) と、価格が数学的に反転しやすい 拡張レベル を投影します。 Si
ARIPoint is a powerful trading companion designed to generate high-probability entry signals with dynamic TP/SL/DP levels based on volatility. Built-in performance tracking shows win/loss stats, PP1/PP2 hits, and success rates all updated live. Key Features: Buy/Sell signals with adaptive volatility bands Real-time TP/SL/DP levels based on ATR Built-in MA Filter with optional ATR/StdDev volatility Performance stats panel (Success, Profit/Loss, PP1/PP2) Alerts via popup, sound, push, or email Cu
TPA True Price Action indicator reveals the true price action of the market makers through 100% non-repainting signals strictly at the close of a candle! TPA shows entries and re-entries, every time the bulls are definitely stronger than the bears and vice versa. Not to confuse with red/green candles. The shift of power gets confirmed at the earliest stage and is ONE exit strategy of several. There are available now two free parts of the TPA User Guide for our customers. The first "The Basics"
AriX
Temirlan Kdyrkhan
1 (4)
AriX Indicator for MT5 A powerful trend-following and signal-evaluation tool AriX is a custom MT5 indicator that combines Moving Averages and ATR-based risk/reward logic to generate clear buy/sell signals. It visualizes dynamic SL/TP levels, evaluates past trade outcomes, and displays win/loss statistics in a clean on-chart panel. Key features include: Buy/Sell signals based on MA crossovers ATR-based SL/TP1/TP2/TP3 levels with visual lines and labels Signal outcome tracking with real-time stat
マーケットメーカーのためのツール。 Meravith は次の機能を提供します: すべての時間足を分析し、現在有効なトレンドを表示します。 強気と弱気の出来高が等しくなる流動性ゾーン(出来高均衡)を強調表示します。 異なる時間足のすべての流動性レベルをチャート上に直接表示します。 テキスト形式の市場分析を生成し、参考情報として表示します。 現在のトレンドに基づいて目標値、サポートレベル、ストップロスを計算します。 取引のリスクリワード比を算出します。 口座残高に基づいてポジションサイズを計算し、潜在的な利益を推定します。 また、市場に大きな変化があった場合には警告を表示します。 インジケーターの主要ライン: 強気/弱気の出来高エグゾーストライン ― 目標値として機能します。 市場のトレンドを示すライン。市場が強気か弱気かによって色が変わり、トレンドのサポートとして機能します。主にその色が市場センチメントを示します。 出来高均衡ライン(Eq)。Eq(Volume Equilibrium)ラインはシステムの中核です。これは買い手と売り手の出来高のバランスポイントを表します。市場の流動性を示し
FX Analysis is an all-in-one MT5 indicator dashboard that combines eight analytical tools in a single panel, helping traders identify high-probability setups without switching between charts or indicators. Designed for standard forex pairs on MetaTrader 5. Best results on M15 - H4 timeframes when all components are used together as part of the included workflow. Components Volatility Analyzer Displays historical average movement by hour and by day of the week. A real-time Pip Balance shows the
Introduction to X3 Chart Pattern Scanner X3 Cherart Pattern Scanner is the non-repainting and non-lagging indicator detecting X3 chart patterns including Harmonic pattern, Elliott Wave pattern, X3 patterns, and Japanese Candlestick patterns. Historical patterns match with signal patterns. Hence, you can readily develop the solid trading strategy in your chart. More importantly, this superb pattern scanner can detect the optimal pattern of its kind. In addition, you can switch on and off individu
このインジケーターは実践的なトレードに最適な自動波動分析のインジケーターです! 場合... 注:   Tang Lun (Tang Zhong Shuo Zen) の命名規則の影響で、私は波のグレーディングに西洋の名前を使用することに慣れていません。基本的な波を ペン 、二次波のバンドを セグメント と名付けました。同時に、 セグメント にはトレンドの方向が指定されます (この命名方法は将来のノートで使用されます。最初に言っておきます)。ただし、アルゴリズムは曲がりくねった理論とはほとんど関係がないため、付けるべきではありません。これは、私の市場分析 によって要約された、絶えず変化する複雑な運用ルール を反映しています。 バンドは標準化され、人によって異なることがないよう定義されており、市場参入を厳密に分析する上で重要な役割を果たす人為的な干渉の描画方法が排除されています。 このインジケーターを使用することは、取引インターフェイスの美しさを改善することと同等であり、元の K ライン取引を放棄し、取引の新しいレベルに連れて行きます。また、宣伝の観点から顧客の認識も向上します。 イ
Ultimate SMC Indicator
Hicham Mahmoud Almoustafa
1 (1)
Ultimate SMC Indicator v2.20 — Smart Money Concepts All-in-One Stop switching between 5 different indicators. Ultimate SMC gives you everything Smart Money traders need — in one clean indicator with interactive controls. GUIDE What makes this different? Most SMC indicators show you Order Blocks or FVGs separately. You still have to figure out which zones actually matter. Ultimate SMC does the hard work: it scans for Order Blocks, Fair Value Gaps, Liquidity Sweeps, Supply & Demand zones, Fibo
この位置が買いに適しているかどうかの判断をサポートします。 この位置が売りに適しているかどうかの判断をサポートします。 4つの指標が同時に底に達した場合は、反発のチャンスに注目してください。 4つの指標が同時に天井付近にある場合は、下落のチャンスに注目してください。 本システムは、中国の先進的なアルゴリズム技術と高度な数学モデリング体系に基づいて構築されています。 私は主に XAUUSD M5 でこの指標を使用しており、この時間足が最も良い結果を示します。 この指標のアルゴリズムと数式は非常に複雑なため、テスト時に動作が遅くなる場合があります。テストでは、リペイントの有無と遅れの有無を確認してください。正式版では実際の使用時により安定します。 この指標システムはリペイントせず、未来データも使用しません。ご購入前にご自身でテストしてご確認いただけます。 この指標には完全にカスタマイズ可能なアラートシステムが搭載されており、以下のリンクからご確認いただけます。 正式に使用する前に、完全な使用説明を十分にお読みください。 ご不明な点がございましたら、どうぞお早めにご連絡ください。できるだけ早
プレシジョン・インデックス・オシレーター(Pi-Osc)は、Precision Trading SystemsのRoger Medcalfによるものです。 バージョン2は、チャートにスーパーファストでロードされるように注意深く再コードされ、その他の技術的な改良も組み込まれて、エクスペリエンスを向上させています。 Pi-Oscは、市場が強制的に行かなければならない、すべての人のストップを取り除くためのポイントである、極限のエクソースト・ポイントを見つけるために設計された正確な取引タイミング信号を提供するために作成されました。 この製品は、極限のポイントがどこにあるかを知るという古代の問題を解決し、トレーダーの生活をはるかにシンプルにします。 これは、業界標準のオシレーターとは異なる強力な要素を持つ高度なコンセンサス・インジケーターです。 使用されている一部の機能には、需要指数、マネーフロー、RSI、スティリング、パターン認識、出来高分析、標準偏差の極値などがあり、異なる長さでこれらのバリエーションが多く含まれています。 初めて見ると、訓練されていない目には、他のオシレーター
Jean Meeus天文アルゴリズムを使用してトレーディングチャート上に月相を表示するテクニカルインディケーターです。プロの天文台と同等の科学的精度で月の周期を表す連続曲線を提供します。MT5のあらゆるシンボルと時間枠に対応し、外国為替、商品、指数、株式取引で使用できます。現在の月相、月の照明パーセンテージ、テクニカル分析用の参照レベルを表示する情報パネルを含みます。色とスタイル設定は完全にカスタマイズ可能です。精密な天文計算に基づくリアルタイム月相データを提供し、トレーダーが客観的に月の情報を市場分析に組み込むことを可能にします。科学的精度と金融市場分析を組み合わせたプロフェッショナル向けツールです。
Ace Trend
Mikhail Sergeev
5 (3)
私たちはあなたにトレンド取引の世界でゲームのルールを変える革命的な指標を提示します。 指標は、パフォーマンスを再考し、前例のない高さにあなたの取引経験を高めるように設計されています。 私たちの指標は、競合他社とは一線を画す高度な機能のユニークな組み合わせを誇っています。 "実質の価格設定要因"の先端技術は最も困難で、揮発市況の最高の安定性を保障する。 不安定なパターン、壊れた指標に別れを告げ、意識的で制御された取引を歓迎します。 指標は単なる美しい絵ではありません! 指標は、トレーダーの側にオッズをシフトし、それによって利益を得る必要があります。 インジケータ信号(完全自動モード)に基づいて取引結果に慣れる: https://www.mql5.com/ja/signals/2339244 AceTrendは、rbtiバージョンによるトレンド指標のランキングで第一位にランクされています。AceTrend-取引における最大の収益性と制御。 私たちの指標は、歴史ではなく、現在の市場相場に基づいて収益性を強調しています。 革命に参加-あなたの取引経験の可能性のロックを解除! インジケーターは、
ARIScalp is a powerful trading companion designed to generate high-probability entry signals with dynamic TP/SL/DP levels based on volatility. Built-in performance tracking shows win/loss stats, PP1/PP2 hits, and success rates all updated live. Key Features: Buy/Sell signals with adaptive volatility bands Real-time TP/SL/DP levels based on ATR Built-in MA Filter with optional ATR/StdDev volatility Performance stats panel (Success, Profit/Loss, PP1/PP2) Alerts via popup, sound, push, or email Cus
GEM Signal Pro GEM Signal Pro は、MetaTrader 5 向けのトレンドフォロー型インジケーターです。より明確なシグナル、より整理されたトレードセットアップ、そして実用的なリスク管理をチャート上で確認したいトレーダーのために設計されています。 単純な矢印だけを表示するのではなく、GEM Signal Pro はトレード全体の考え方を、より見やすく分かりやすい形で表示します。条件が確認されると、インジケーターはエントリー価格、ストップロス、利確目標をチャート上に表示し、トレードセットアップをより効率的に確認できるようにします。 動作の仕組み このインジケーターは、まず内部ロジックに基づいて有効なシードシグナルを検出します。 確認条件が満たされると、GEM Signal Pro はチャート上に完全なセットアップを表示します。これにより、トレーダーはトレード構造をより明確に把握し、手作業による分析を減らすことができます。 チャート上のトレードレベル 確認済みシグナルに対して、GEM Signal Pro は以下を表示できます。 エントリー価格 ストップロス テ
「 Dynamic Scalper System MT5 」インジケーターは、トレンド波の中でスキャルピング取引を行う手法のために設計されています。 主要通貨ペアと金でテスト済みで、他の取引商品との互換性があります。 トレンドに沿った短期的なポジションオープンのシグナルを提供し、追加の価格変動サポートも提供します。 インジケーターの原理 大きな矢印はトレンドの方向を決定します。 トレンド波の中では、小さな矢印の形でスキャルピングシグナルを生成するアルゴリズムが機能します。 赤い矢印は強気方向、青い矢印は弱気方向です。 トレンドの方向には敏感な価格変動ラインが描かれ、小さな矢印のシグナルと連動します。 シグナルは次のように機能します。適切なタイミングでラインが現れるとエントリーシグナルが形成され、ラインが開いている間はポジションが保持され、完了すると取引が終了します。 推奨される動作時間枠はM1~H4です。 矢印は現在のローソク足に形成され、次のローソク足が開いている場合は、前のローソク足の矢印は再描画されません。 入力パラメータ Trend Wave Period - トレ
Native Channels
BeeXXI Corporation
5 (1)
This indicator recognizes all support and resistance levels. A number of unique high-performance techniques have been applied, which made the existence of this indicator possible. All formed channels are naturally visible: horizontal linear linear parabolic cubic (Polynomial 3 degrees - Wave) This is due to a bundle of approximating channels. The formed channels form "standing waves" in a hierarchical sequence. Thus, all support and resistance levels are visible. All parameter management is i
このインジケーターは、市場で 関心が示されたゾーン をハイライトし、その後に 注文の蓄積ゾーン を表示します。 これは、大規模な**板情報(オーダーブック)**のように機能します。 これは、 巨大な資金 のためのインジケーターです。その性能は卓越しています。 市場にどんな関心が存在していても、 必ず目に見えるようになります 。 (これは 完全に再設計され、自動化されたバージョン です。もはや手動分析は必要ありません。) トランザクションスピード(取引速度) は新しい概念のインジケーターで、市場で大口注文が どこに・いつ 集中しているかを示し、それに基づいたチャンスを提供します。 トレンドの変化を 非常に早い段階 で察知することができます。 FXでは「出来高」と呼ばれているものは誤解されています。実際には、これは 時間あたりの価格変動量 です。したがって、正しい名称は トランザクションスピード です。 考え方・行動・分析の仕方すべてが問われます。 分析パラダイムの転換は非常に重要です。 このインジケーターは、FXにおける出来高の考え方を 根本から再定義 し、論理的な形で正確に活用する、
Range Cycle Indicator. Gives signal on price range cycling smoothed by moving average. It is better to use it on H1+ timeframes and avoid side markets. Because if market is flat this indicator will give too many zero profit or even losing signals. Parameters: PopUpAlert - to allow it to alert when trend changes; EMailAlert - for email alerts; period - this is a smoothing criteria, use higher values on lower timeframes; TimeFrame(new) - higher timeframe (or the same) to use for calculation, defa
The iChannels
BeeXXI Corporation
5 (2)
Ultra-fast recognition of parabolic channels (as well as linear, horizontal and wavy channels) throughout the depth of history, creating a hierarchy of channels. Required setting: Max bars in chart: Unlimited This indicator is designed primarily for algorithmic trading, but can also be used for manual trading.  This indicator will have a very active evolution in the near future and detailed descriptions on how to apply to create robots
VTrende Pro
Andrii Diachenko
5 (1)
VTrende Pro - MTF indicator for trend trading with a display panel for MT5 *** Videos can be translated into any language using subtitles (video language - Russian) Although the signals of the VTrende Pro indicator can be used as signals of a full-fledged trading system, it is recommended to use them in conjunction with the Bill Williams TS. VTrende Pro is an extended version of the VTrende indicator. Difference between Pro version and VTrende: - Time zones - Signal V - signal 1-2 waves -    S
note: this indicator is for METATRADER4, if you want the version for METATRADER5 this is the link:  https://www.mql5.com/it/market/product/108106 TRENDMAESTRO ver 2.5 TRENDMAESTRO recognizes a new TREND from the start, he never makes mistakes. The certainty of identifying a new TREND is priceless. DESCRIPTION TRENDMAESTRO identifies a new TREND in the bud, this indicator examines the volatility, volumes and momentum to identify the moment in which there is an explosion of one or more of these da
*** ### **Triple Crox Strategy - Professional Trading System** **Overview** The Triple Crox Strategy is an advanced technical indicator for MetaTrader 5, designed for serious traders. It synthesizes multiple analysis methodologies—including moving averages, Average True Range (ATR), Relative Strength Index (RSI), and cloud configurations—to generate highly reliable and precise trading signals. **Core Configuration** **Setup Types** *   **Setup Open/Close:** Utilizes Heikin Ashi can
Weis Wave with Alert MT5
Trade The Volume Waves Single Member P.C.
4.94 (17)
Rental/Lifetime Package Options and Privileges  Rent Monthly Six Months   Yearly/Lifetime Weis Wave with Speed with Alert+Speed Index x x x Manual  x x x Quick Set up Video x x x Blog x x x Lifetime Updates x x x Setup and Training Material x x Discord Access Channel "The SI traders"          x Rectangle Break Alert Tool      x How to trade with it:    http://www.tradethevolumewaves.com   ** If you purchase please contact me to setup your  : Training Room and  complete manual access.  Wei
トレンドに沿ってトレードする際の主な難しさは、レベルを見つけることではなく、どこが実際に有効なエントリーポイントなのかを理解することにあります。 価格はしばしばレベルに反応しますが、動きが継続しないことが多く、その結果、誤ったエントリーや機会損失につながります。 Owl Smart Levels は単にレベルを表示するだけではなく 、市場構造とプルバックに基づいてゾーンを形成します。これにより、エントリーポイントを異なる視点で評価でき、一部の誤シグナルを回避できます。 Owl Smart Levels システムに含まれるもの Owl Smart Levels は単なるレベルの表示ではなく、各要素が連携する 完全なトレードモデル です。 内容は以下の通りです: Owl Smart Levels(インジケーター) トレンド方向、プルバックゾーン、事前定義されたエントリー・StopLoss・TakeProfitレベルを表示 システムガイド 実際のトレードでのシグナルの扱い方を解説:どの状況を考慮し、どれを回避し、どのようにトレードを管理するか トレード判断チェックリスト シグナルを迅
Orderflow Scalp Pro v2.4   delivers institutional-grade trading intelligence through advanced volume analysis, dynamic VWAP calculations, real-time aggressive score monitoring, and precision arrow signals. This complete trading system transforms complex market data into clear, actionable signals for consistent profitability on 3-4 minute timeframes. Full Documentation: [Download PDF] Four Powerful Components in One System Volume Profile HeatMap with POC/VAH/VAL Transform your charts into inst
フィルタ:
Truta Petru Lucian
403
Truta Petru Lucian 2025.04.30 14:48 
 

ユーザーは評価に対して何もコメントを残しませんでした

レビューに返信