Volume Profile stairs
- インディケータ
- バージョン: 8.0
- アップデート済み: 27 8月 2026
- アクティベーション: 10

Short description (MQL5 summary field)
Multi-session Volume Profile displaying POC and Value Area (VAH/VAL) as developing step lines. Tokyo, London, New York, Daily and a custom session can be displayed simultaneously, each with its own hours, its own levels and its own colour. Works with both real volume (futures, stocks) and tick volume (Forex, CFDs).
Full description
The problem
A standard Volume Profile draws a flat POC line across the whole session: the final value, computed once the session is over. That is hindsight. During the session, what you actually need to know is where value sat at the moment price traded there, and whether the POC migrated or stayed anchored.
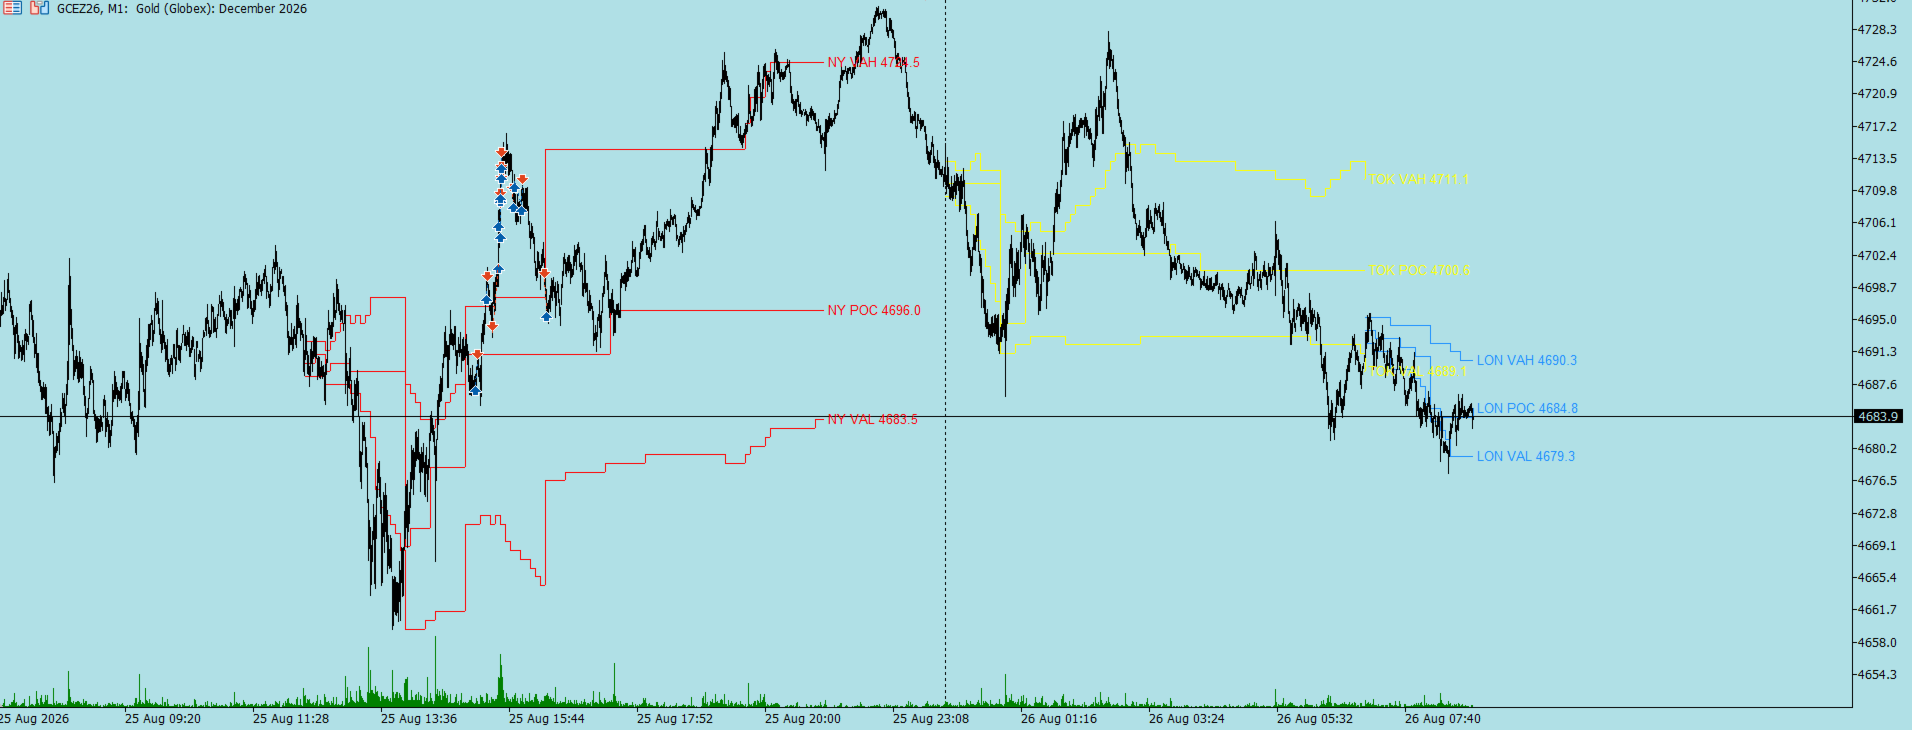
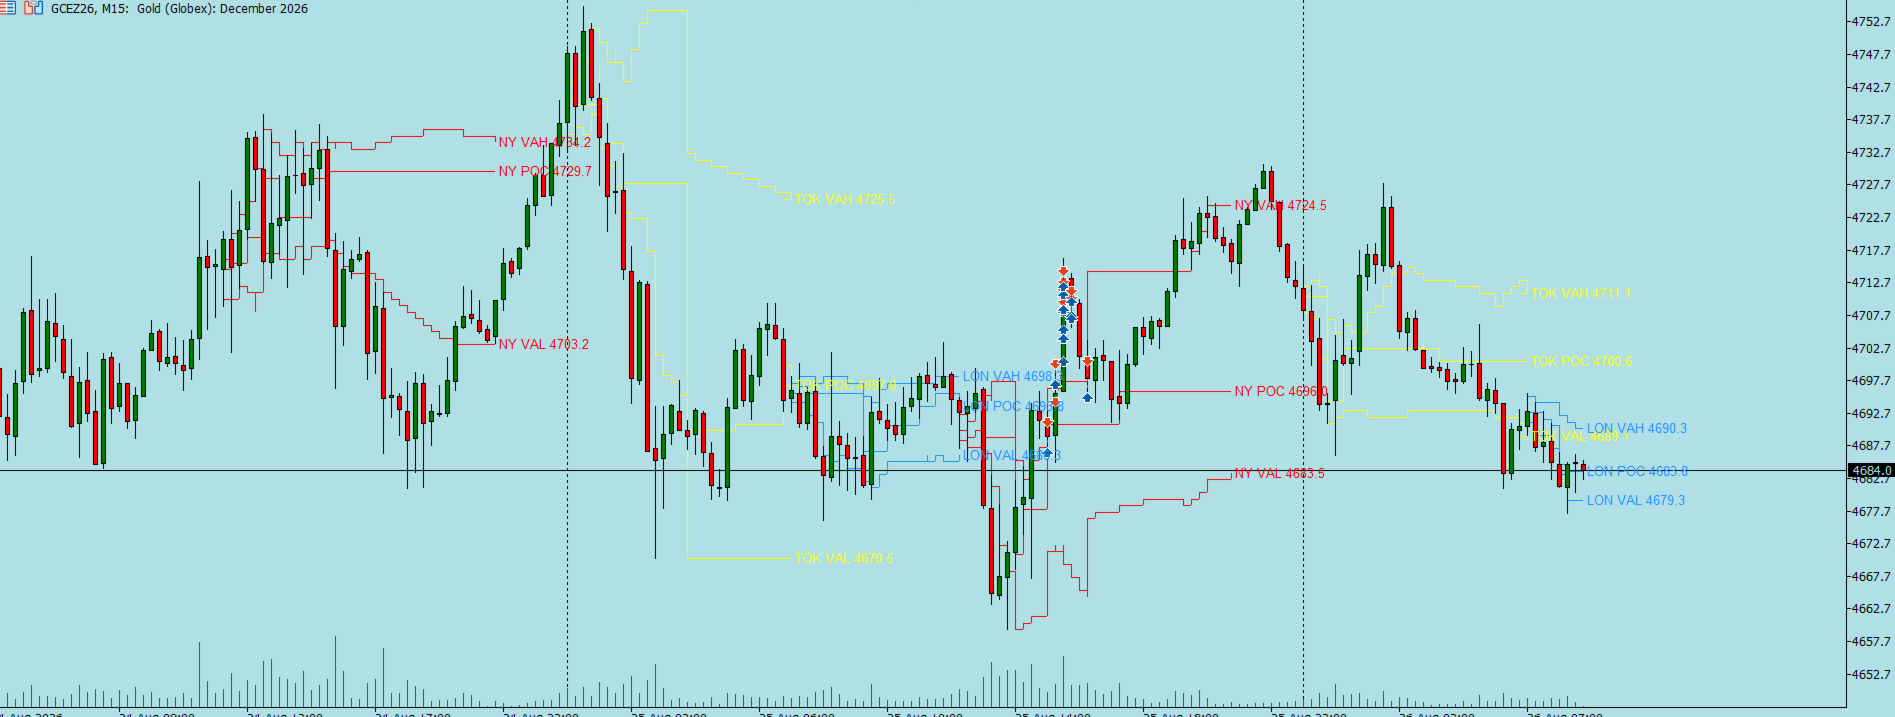
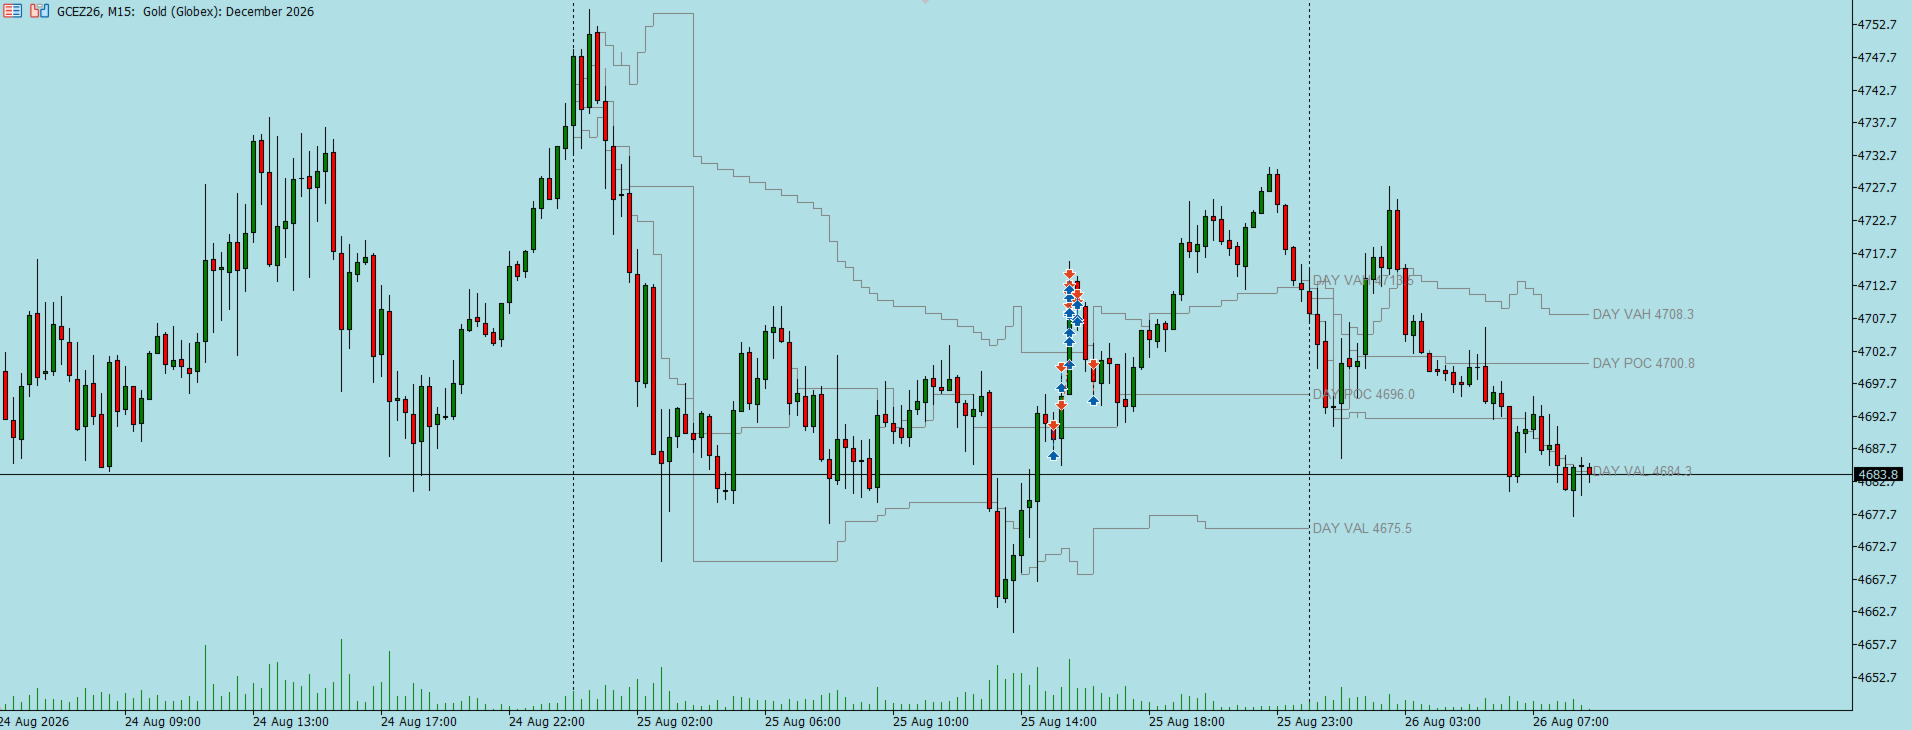
This indicator rebuilds the profile minute by minute and plots POC, VAH and VAL exactly as they developed through the session. Every change in level produces a step: a horizontal shelf while the level holds, a vertical riser when it shifts. The result is a direct read on how value migrated.
Key features
Developing POC and Value Area Levels are recomputed at a fixed interval on the volume accumulated since the session open. A POC that stays flat for hours marks a defended balance area; a run of steps in one direction marks value migration. The recalculation step is adjustable (1 to N minutes) to trade off granularity against readability.
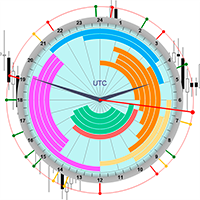
Five sessions, displayable at once Daily, Tokyo, London, New York and a free-form custom session. Each is toggled independently with a simple true/false, computes its own bins over its own time window, and gets its own colour. The Tokyo POC is never contaminated by New York volume. This lets you watch Asian value act as reference into the European open, or the London Value Area frame the US open.
Fully configurable hours Start and end hour and minute for every session, entered in local time. A broker offset parameter (hours plus minutes) handles the conversion to server time — you adjust a single field when clocks change instead of reconfiguring every session. Sessions crossing midnight are handled automatically.
Real volume or tick volume A switch selects the source. On futures and stocks, real volume (contracts actually traded) produces a faithful profile. On Forex and most CFDs, where real volume is not distributed, tick volume provides a usable proxy for activity. The indicator works either way; the right choice depends on what your feed carries.
Multi-session history Show the current session alone, or N previous sessions, each with its own profile and its own levels. Weekends can be skipped in the count, which avoids drawing empty sessions on a Monday.
Optional histogram The volume profile can be drawn as a histogram, with distinct colouring for the POC bin, bins inside the Value Area and bins outside it. It can also be switched off to keep only the lines — recommended when several sessions are active at the same time.
Light on resources By default, recalculation is triggered only when an M1 bar closes, not on every tick. A real-time mode remains available for those who want to watch the POC move continuously.
Parameters
Session
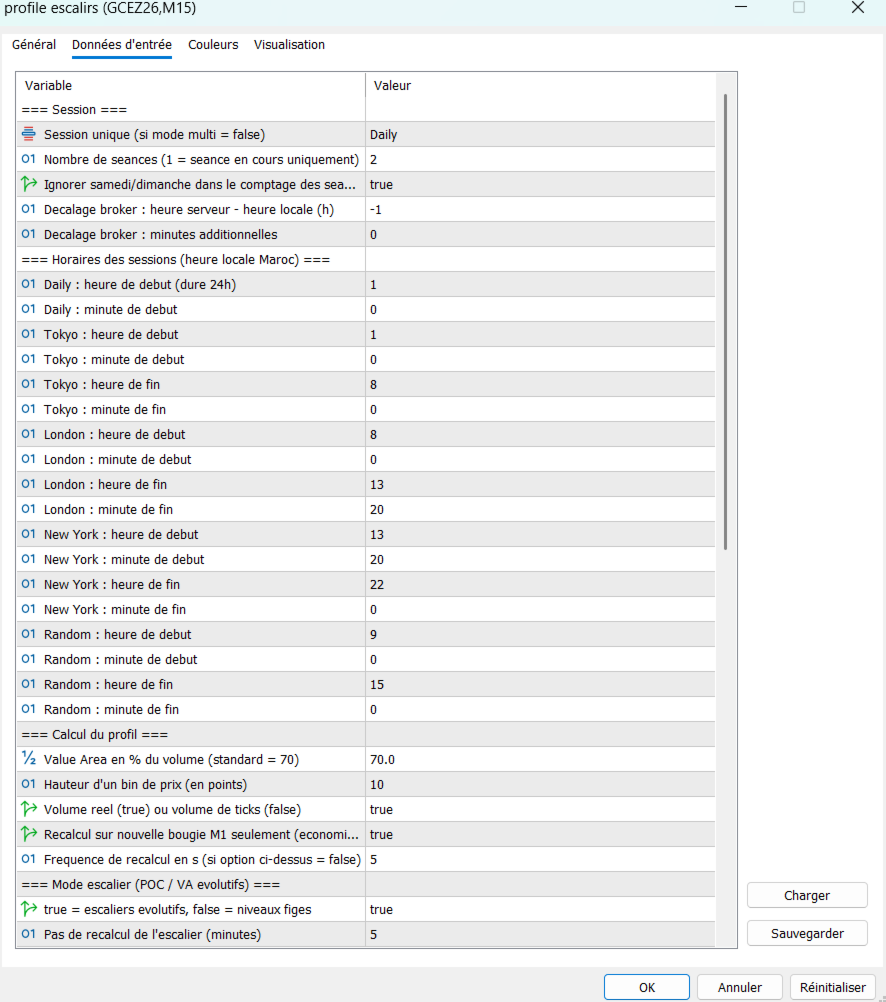
| Parameter | Description |
|---|---|
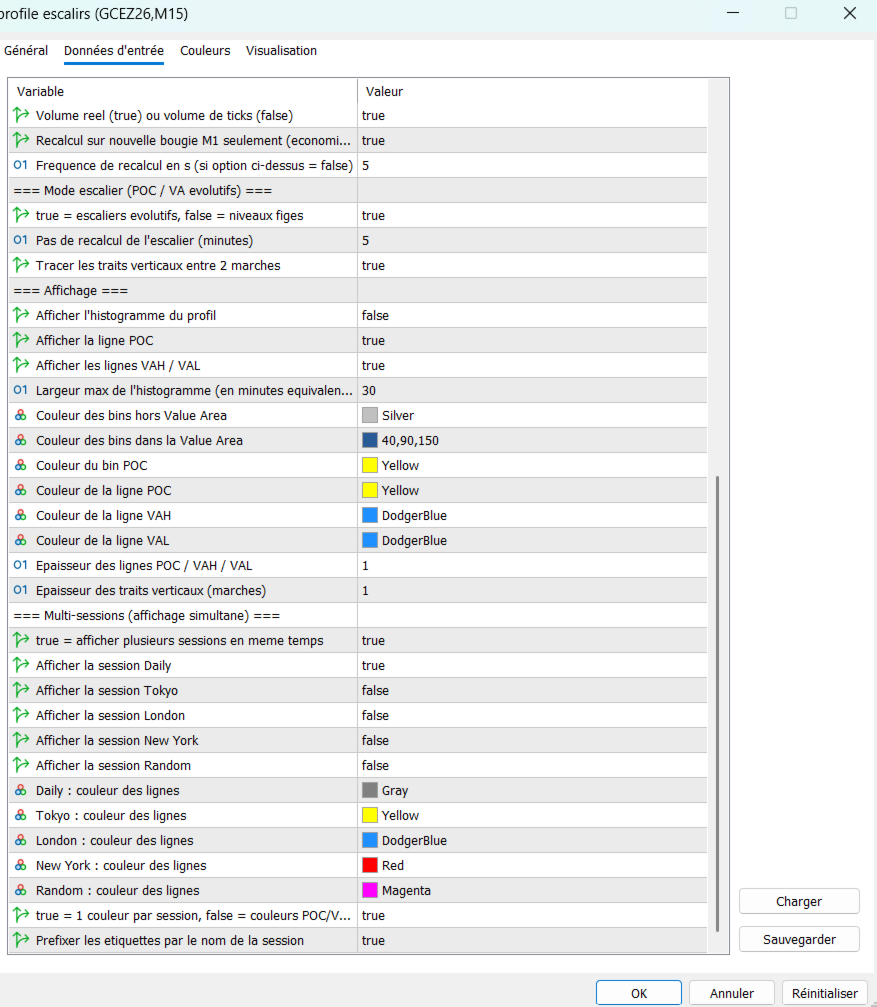
| InpSessionType | Single session (used when multi-session mode is off) |
| InpNbSessions | Number of sessions displayed (1 = current session only) |
| InpSkipWeekend | Skip Saturday/Sunday when counting sessions |
| InpBrokerOffsetHours | Broker offset: server time − local time |
| InpBrokerOffsetMin | Additional offset minutes |
Session hours (local time)
Start and end hour and minute for Daily, Tokyo, London, New York and Custom.
Calculation
| Parameter | Description |
|---|---|
| InpValueAreaPct | Percentage of volume defining the Value Area (standard: 70) |
| InpBinTicks | Height of a price bin, in points |
| InpUseVolumeReal | Real volume (true) or tick volume (false) |
| InpRecalcOnNewBarOnly | Recalculate on M1 close only |
| InpRecalcSeconds | Recalculation frequency when the option above is off |
Stepped mode
| Parameter | Description |
|---|---|
| InpSteppedMode | Developing steps (true) or fixed levels (false) |
| InpStepIntervalMin | Recalculation step, in minutes |
| InpShowStepRisers | Draw vertical risers between steps |
Display
Histogram, POC and VA lines, profile width, bin and line colours, line widths.
Multi-session
| Parameter | Description |
|---|---|
| InpMultiSession | Enable simultaneous display |
| InpShow...Sess | One toggle per session |
| InpColorPerSession | One colour per session, or global POC/VA colours |
| InpShowSessionName | Prefix labels with the session name |
Getting started
Choose the volume source. First check whether your symbol distributes real volume. If the histogram looks inconsistent or empty with InpUseVolumeReal = true , switch to tick volume.
Set the broker offset. Compare the server time shown by the terminal with your local time and enter the difference. An incorrect offset produces profiles computed over the wrong time window — this is the first thing to check if levels look wrong.
Tune the bin size. InpBinTicks sets the resolution of the profile. Too fine and the POC becomes unstable, jumping between levels; too coarse and the Value Area loses precision. The right value depends on the instrument and its volatility.
Balance the step interval. A short step shows every micro-shift but creates a large number of objects. A 5 to 15 minute step usually gives the most readable result.
Technical notes
- Data is read from M1 regardless of the chart timeframe, which keeps profile resolution constant.
- Each bar's volume is distributed evenly across the bins its range covers.
- The Value Area is built by symmetric expansion around the POC: at each step the heavier adjacent bin is added until the target percentage is reached.
- Available M1 history depends on the broker. If past sessions do not appear, force the download by scrolling an M1 chart to the left.
- Nothing is drawn while CopyRates returns no data for the requested range: sessions without quotes (holidays, weekends) are simply skipped.
Disclaimer
This indicator is an analysis and decision-support tool. It does not generate entry or exit signals and does not constitute investment advice. Past performance is not indicative of future results.