Wave Trend Oscilator

# Wave Trend Oscillator (WTO) User Guide

## Overview
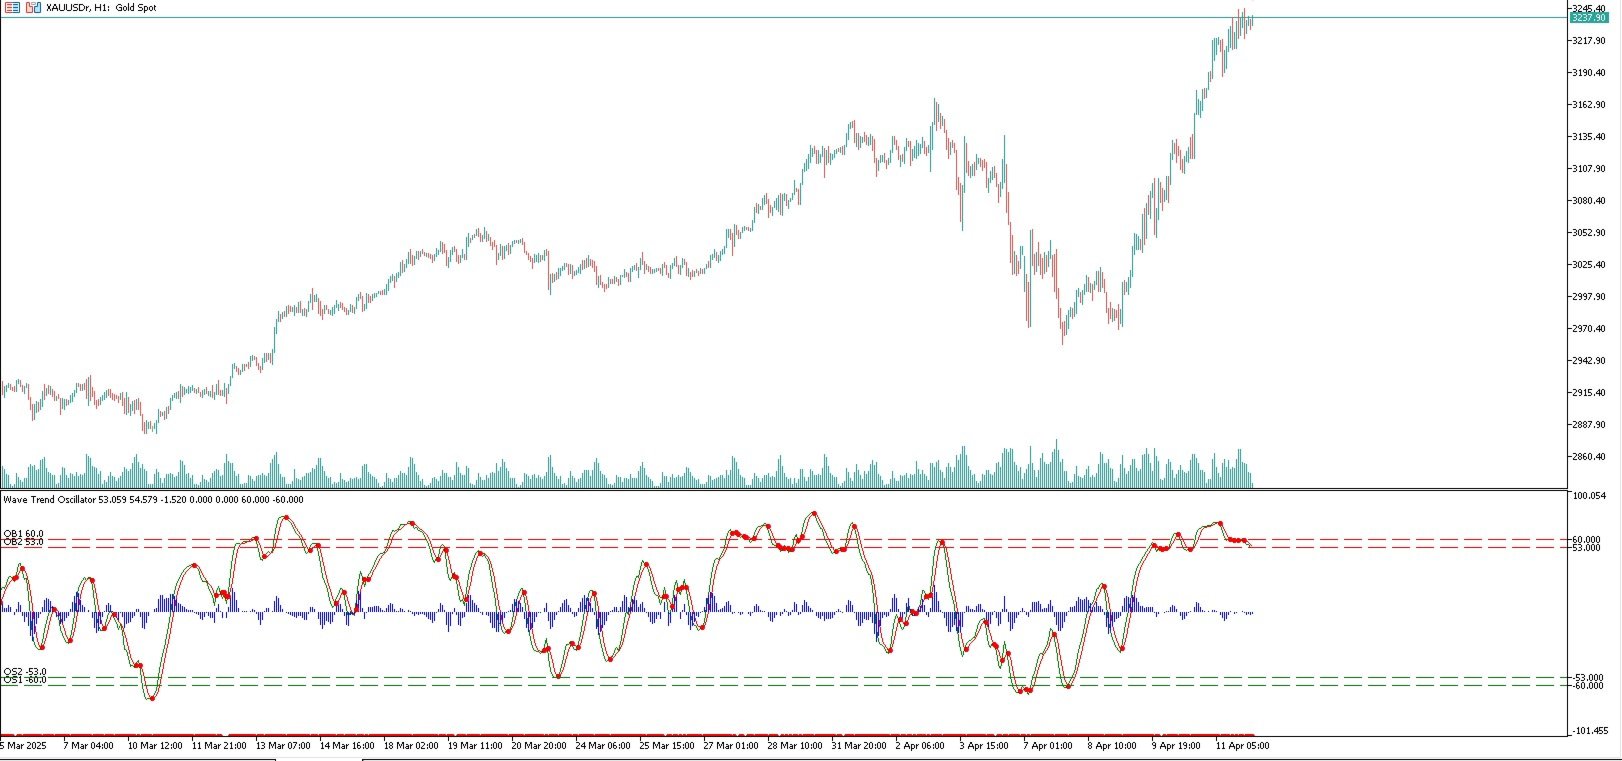
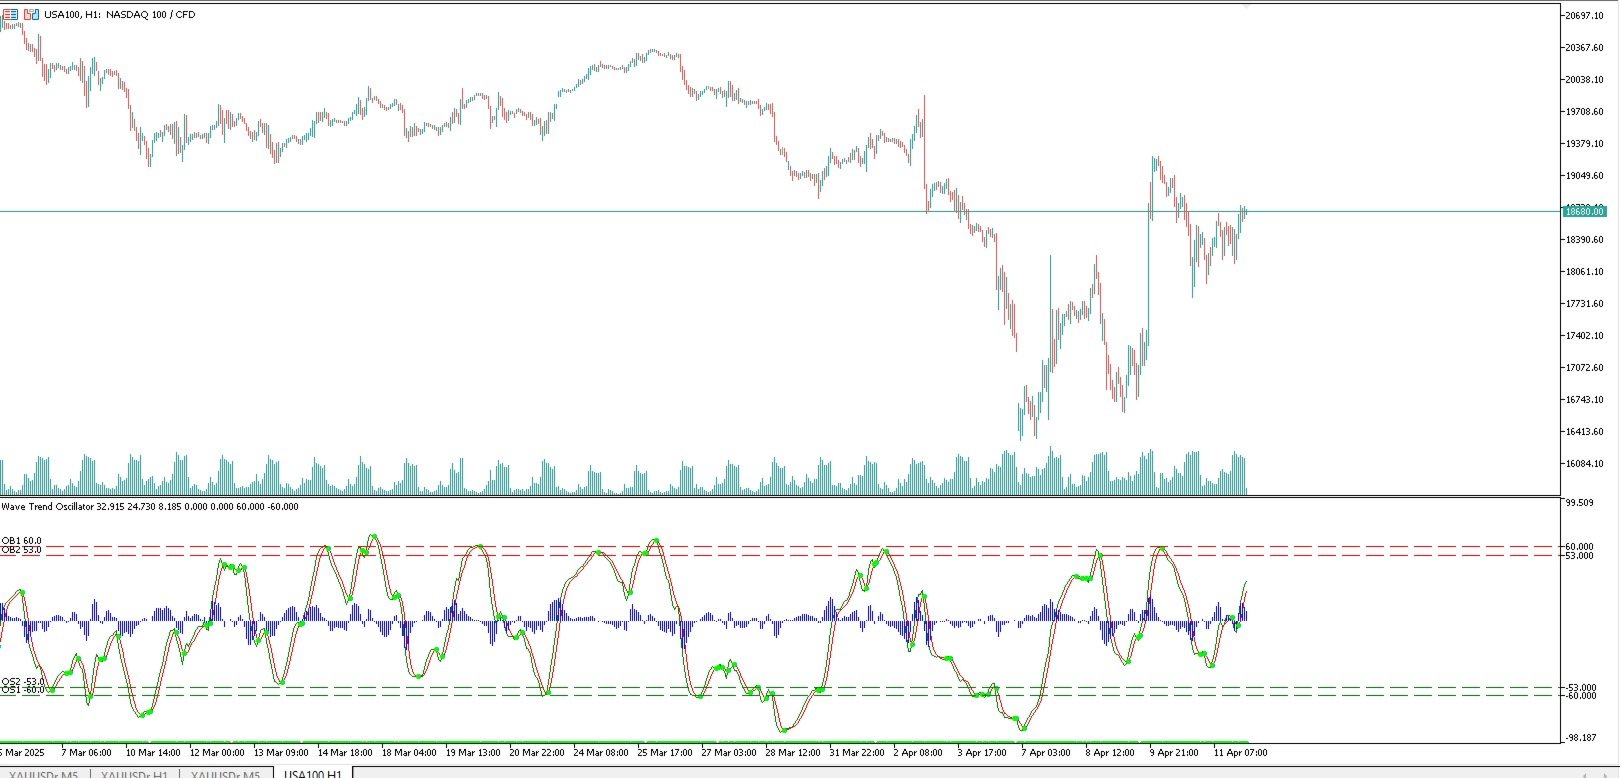
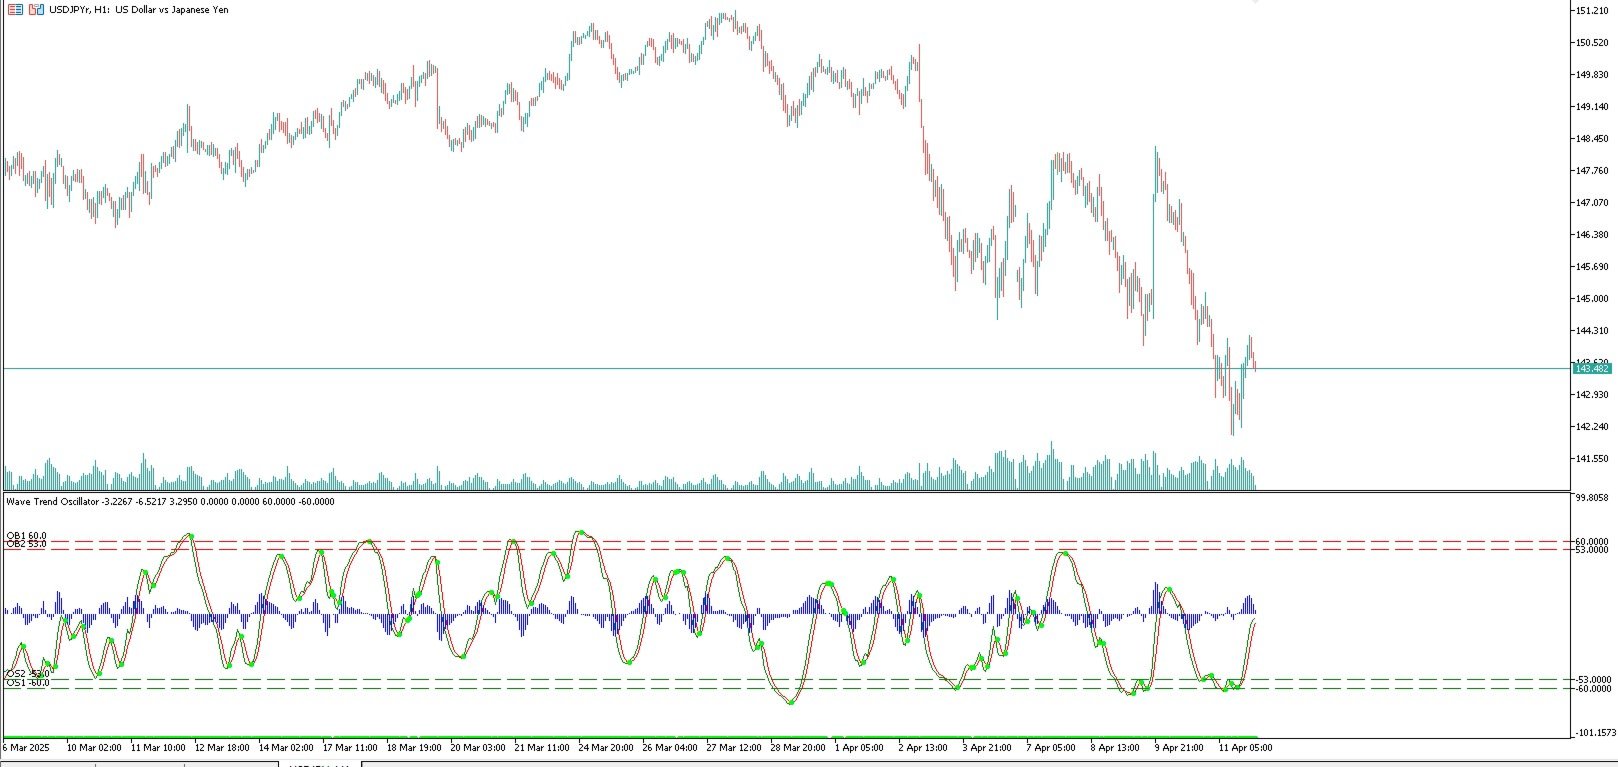
Wave Trend Oscillator is a powerful technical analysis tool used to analyze price momentum and trend direction. It visualizes market conditions using two main lines (WT1 and WT2) and a histogram.

## Components
1. **WT1 (Green Line)**: Main trend indicator
2. **WT2 (Red Line)**: Signal line
3. **Histogram (Blue)**: Shows the difference between WT1 and WT2
4. **Arrows**: Mark crossover points
   - Green Arrow: WT1 crosses above WT2 (Buy signal)
   - Red Arrow: WT1 crosses below WT2 (Sell signal)
5. **Overbought/Oversold Levels**:
   - OB1 (60): Overbought level 1
   - OB2 (53): Overbought level 2
   - OS1 (-60): Oversold level 1
   - OS2 (-53): Oversold level 2

## Parameters
- **n1 (10)**: Channel length
- **n2 (21)**: Average length
- **obLevel1 (60)**: Overbought level 1
- **obLevel2 (53)**: Overbought level 2
- **osLevel1 (-60)**: Oversold level 1
- **osLevel2 (-53)**: Oversold level 2
- **scaleMinimum (-100)**: Minimum scale value
- **scaleMaximum (100)**: Maximum scale value
- **autoScale (true)**: Auto scaling

## Signal Types

### 1. Crossover Signals
- **Buy Signal**: WT1 crosses above WT2 (green arrow)
- **Sell Signal**: WT1 crosses below WT2 (red arrow)

### 2. Overbought/Oversold Signals
- **Overbought**: WT1 exceeds OB1 level
- **Oversold**: WT1 falls below OS1 level

### 3. Momentum Signals
- **Strong Trend**: Histogram width increasing
- **Trend Weakening**: Histogram width decreasing

## Trading Strategies

### 1. Basic Crossover Strategy
- Buy when WT1 crosses above WT2
- Sell when WT1 crosses below WT2

### 2. Overbought/Oversold Strategy
- Consider selling when WT1 exceeds OB1 level
- Consider buying when WT1 falls below OS1 level

### 3. Momentum Confirmation
- Confirm crossover signals with histogram width
- Expanding histogram indicates strong trend

## Risk Management
- Set stop-loss levels for each signal
- Reduce position size in overbought/oversold areas
- Adjust position size according to trend direction

## Recommendations
1. Use this indicator in combination with other technical analysis tools
2. Test on different timeframes
3. Optimize parameters according to market conditions
4. Never neglect risk management rules

This guide explains the basic usage of the Wave Trend Oscillator. You can use this information to develop your own trading strategy.

Produits recommandés
Unlock instant clarity in your charts! This indicator automatically draws the key levels where price has reacted or broken recently, giving you objective support and resistance zones without manual lines. Just attach it to your chart and watch the previous highs and lows appear for each timeframe. What does each line mean? Previous Month High ‣ Highest price recorded in the previous monthly period. Previous Month Low ‣ Lowest price recorded in the previous monthly period. Previous Week High ‣
CChart
Rong Bin Su
Overview In the fast-paced world of forex and financial markets, quick reactions and precise decision-making are crucial. However, the standard MetaTrader 5 terminal only supports a minimum of 1-minute charts, limiting traders' sensitivity to market fluctuations. To address this issue, we introduce the Second-Level Chart Candlestick Indicator , allowing you to effortlessly view and analyze market dynamics from 1 second to 30 seconds on a sub-chart. Key Features Support for Multiple Second-Level
About indicator > The indicator is a function based on one value (open/high prices up to now) and then it is a mathematical representation of the whole function that is totally independent from any else values. So, if you ask yourself will the future be as it is on the graph... I can tell you - as it was the same as the trading function up to the moment "now"... In conclusion, the point of the indicator is  to try to show the future of the trading function into eternity. The graphic is sometime
Introduction This indicator detects volume spread patterns for buy and sell opportunity. The patterns include demand and supply patterns. You might use each pattern for trading. However, these patterns are best used to detect the demand zone (=accumulation area) and supply zone (=distribution area). Demand pattern indicates generally potential buying opportunity. Supply pattern indicates generally potential selling opportunity. These are the underlying patterns rather than direct price action. T
Timeless Charts
Samuel Manoel De Souza
Timeless Charts est une solution de graphiques avancée conçue pour les traders professionnels qui ont besoin de graphiques personnalisés / unités de temps personnalisées – y compris les graphiques en secondes / unités de temps en secondes, les graphiques Renko / barres Renko, les graphiques en clusters / footprints et des outils avancés similaires à ceux disponibles sur les plateformes les plus populaires. Contrairement aux graphiques hors ligne traditionnels ou aux simples indicateurs personnal
RSImaxmin
Carlos Andrés Moya Erazo
4.5 (10)
The indicator shows when there are overprice and divergences on the RSI. In addition, it has configurable alerts, dynamic overprice levels and a special “RSI cleaner” function. The indicator that automatically calculates the premium rates! RSImaxmin is an indicator based on the Relative Strength Index (RSI) oscillator that effectively identifies changes in price trends as it reflects the relative strength of bullish movements compared to bearish movements. It is widely used by traders to measur
Elliott Wave Helper
Siarhei Vashchylka
4.92 (13)
Elliott Wave Helper - a panel for making elliott wave and technical analysis. Includes all known wave patterns, support and resistance levels, trend lines and cluster zones. Manual (Be sure to read before purchasing) | Version for MT4 Advantages 1. Making wave analysis and technical analysis in a few clicks 2. All Elliott wave patterns available, including triangle and combinations 3. All nine wave display styles, including a special circle font 4. E lements of technical analysis : trend lines,
# SSL ST Strategy MT5 Indicator - French Version L'indicateur SSL ST Strategy MT5 est un outil d'analyse technique conçu pour aider les traders à identifier clairement les signaux d'achat et de vente sur le graphique commercial. Il offre des indicateurs visuels tels que des lignes et des flèches, ainsi que des notifications sonores, des alertes contextuelles et des notifications push pour alerter les traders rapidement lorsqu'une opportunité commerciale se présente. ## Avantages principaux -
HedgingMonitor: Visual Control for Hedging Operations HedgingMonitor: Professional Order Visualization for MT5 HedgingMonitor is a professional indicator for MetaTrader 5 that displays detailed information about all your open and pending orders in an organized and customizable visual panel. Ideal for traders who use hedging strategies or manage multiple orders simultaneously. Key Features: Intuitive Visual Interface: View all your orders in a single panel, with color coding to quickly identify b
This easy to setup indicator shows you the market volumes in a different way, with support and resistance as showed. You can setup: - Backdays volume to show - Heiken Ashi candle view It works for every kind of graph and every kind of period. The program shows the volumes based on the number of candles displayed in the chart: the more candles the more volumes. Enjoy this very useful indicator. Please feel free to message me to report any kind of improvements! :D
Sinaleiro Trader
Renato Takahashi
O Sinaleiro Trader é o robô de daytrade que usa multiníveis de acordo com a abertura do dia. Assim, a cada rompimento dos níveis, o robô emite ordens de compra ou venda, de acordo com a tendência. Os stops podem ser fixos ou dinâmicos de acordo com os níveis. É possível configurar a distância do sinaleiro, bem como horários de trades e dias da semana. Alterar o parâmetro BR1 para BR.
The professional browser of News and Trading Sessions is now available in MetaTrader 5. Now all the most important market information is collected on one dial! News located on the Time scale. Planning your working time has never been so easy and convenient ... The news scale can be switched a day, two, a week, a month forward or backward (see the details in the short video). All news updates in real time. Thanks to the built-in filters, you can configure the display of news by importance, cou
HFT Bot Builder
Thomas Bradley Butler
Build an HFT Bot with source code.  This specialized algorithm in the bot will build an HFT bot for you, to alter, enhance and optimize to trade by.  The algorithm in the bot is a special recipe to build an HFT program.  One that you can enhance upon creation. Just follow the steps: Load the bot on a chart Wait for it to load, could takes some time depending on computer, refresh chart if needed (USE DEMO SO IT WON'T MAKE REAL TRADES WHILE YOU BUILD).  THIS IS BEING USED AS A BUILDER NOT AN EA A
Harmonic Pro
Kambiz Shahriarynasab
Only 5 copies of the EA at $30! Next price --> $45 Find charts and signals based on harmonic patterns, which work great in 1-hour timeframes and up. Buy and sell signs based on different harmonic patterns as follows: 0: ABC_D 1: ABCD_E 2: 3Drive 3: 5_0 4: Gartley 5: Bat 6: Crab 7: Butterfly 8: Cypher 9: NenStar 10: Shark 11: AntiBat 12: AntiGartley 13: AntiCrab 14: AntiButterfly 15: AntiCypher 16: AntiNenStar 17: AntiShark How to use: When there is an opportunity to buy or sell, you have 5:
Trade Dashboard MT5
Fatemeh Ameri
4.96 (103)
Tired of complex order placement and manual calculations? Trade Dashboard is your solution. With its user-friendly interface, placing orders becomes effortless, by a single click, you can open trades, set stop loss and take profit levels, manage trade lot size, and calculate risk to reward ratios, allowing you to only focus on your strategy. Say goodbye to manual calculations and streamline your trading experience with Trade Dashboard. Download  Demo Version  right now. You can find  Details of
TradeMetrics Pro
Hussein Adnan Kadhim
The TradeMetrics Pro indicator enhances trade analysis and performance evaluation by presenting trade history and metrics directly on the chart. It accomplishes this through three key features: Summary Trade Panel: The Summary Trade Panel provides a concise overview of open and closed trades. It organizes trade summaries by symbol, lots traded, pips gained or lost, profit, and advanced statistics. This panel enables quick assessment and comparison of trade performance across different symbols.
The Linear Regression Channel is a powerful technical analysis tool that helps visually identify the prevailing trend and potential price zones. Essentially, the indicator performs two main functions: It draws a trendline through the center of price action over a specified period. This line is calculated using the linear regression method, which results in the best possible "line of best fit" for the price data. From this center line, the indicator plots two parallel lines above and below, creat
FREE
Trend Teller
Ian Nganga Comba
Trend Teller est un outil de tableau de bord puissant et intuitif conçu pour offrir une vue d’ensemble des tendances du marché sur toutes les paires de devises majeures et tous les horizons temporels — de M1 à MN1. Créé par des traders pour des traders, cet outil élimine les incertitudes de l’analyse des tendances et vous aide à rester aligné avec la direction générale du marché. Beaucoup de débutants ont du mal à identifier la direction du marché — et même les traders expérimentés se trompent p
FREE
Visual Adaptive Channel Indicator
AL MOOSAWI ABDULLAH JAFFER BAQER
Visual Adaptive Channel Indicator: Trade with the Market's True Rhythm Unlock a smarter way to trade. Stop relying on static, lagging indicators that fail in changing market conditions. The Visual Adaptive Channel Indicator is your new essential tool for identifying high-probability entry points with confidence. Priced at just $30, this indicator is engineered to give you a dynamic and intelligent view of the market, helping you make informed decisions whether you are a scalper, day trader, or
Découvrez les véritables motifs cachés du marché avec le système de trading PREDATOR AURORA — le boss final des indicateurs de trading hybrides. Voyez ce que les autres ne voient pas ! Le système de trading PREDATOR AURORA est une puissance conçue pour ceux qui refusent de se cacher dans l'ombre de la médiocrité. Ce n'est pas juste un autre indicateur ; c'est le code de triche ; c'est votre avantage déloyal, un système de chasse hybride sophistiqué qui suit les mouvements du marché avec une
CSV News File Generator MT5 is a script specifically designed for the MQL5 platform. It enables the automated generation of CSV files containing economic calendar news, making it ideal for use in strategy simulators or as data for training artificial intelligence models. How Does It Work? The script gathers economic news directly from the MQL5 calendar, organizes the data into arrays, and converts it into CSV files for later use. Steps to Generate News Identify Event Codes: Find the event code
FREE
LineaResultadoyEjecucion
Juan Luis De Frutos Blanco
Result and Execution line, which shows the net global position, the expected profit at a given price level, and its percentage of the account balance. Additionally, with the line unselected, it executes position and/or order closing actions. You can move the line from one price to another by selecting it, to obtain information on the closing result of positions at different price levels. If you wish to close trades and/or orders, select this option in the EA parameters and then deselect the li
FREE
OrderHelper script is super easy and trader friendly to use. It would boost your trading experience. Because it is designed to open one to multiple orders quickly with just one click. Besides using the OrderHelper script, traders can define various parameters for open orders such as the symbol, order type, lot size, stoploss, takeprofit and more. Basically, with this script traders can manage their open orders more efficiently and save their trading time. OrderHelper manages: Open the number of
Market View MT5
Kyra Nickaline Watson-gordon
Definition : Market View is a dashboard (scanner) to view price graphs of all symbols and all timeframes at a glance. The utility is designed user friendly and added a wide range of customization options. Main features of Market View : Visual settings window on the chart Customizable list of symbols and timeframes Different shapes : Real Candles, Schematic Candles, Arrows Customizable number of candles Changeable size of dashboard (scanner) Highlight timeframes with gaps on candles Open approp
CloseOrdersEa
Yusuf Watinani Umar
Overview: This utility serves as a tool to provide easy navigation for closing open positions. • Close all open buy positions at market price.  • Close all open sell positions at market price.  • Close all orders at market price based on predefined conditions for efficient trading management.  • Close orders for the current chart at market price, allowing focused control over specific trading instruments.
Prenez le contrôle de votre routine de trading sans effort avec le Trades Time Manager révolutionnaire. Cet outil puissant automatise l'exécution des ordres à des moments précis, transformant votre approche de trading. Créez des listes de tâches personnalisées pour diverses actions commerciales, de l'achat à la définition des commandes, le tout sans intervention manuelle. Guide d'installation et d'entrées de Trades Time Manager Si vous souhaitez recevoir des notifications sur l'EA, ajoutez notre
Rectangle Trading Custom is a powerful technical analysis tool designed for price action and range-based traders. It allows users to define consolidation zones and receive alerts when the price breaks out of these zones or approaches trendlines drawn on the chart. Rectangles and Trendlines will be extended into future with one click. Rectangle point size, name and prices will be displayed around rectangle. Key Features: Draw Trading Zones (Rectangle Zones) Users can manually draw rectangles to
Introducing the BlackWing Signal Provider—an advanced EA designed to enhance your trading experience by facilitating seamless communication between your MetaTrader 5 platform and Telegram channels, groups, or individual users. Key Features: 1. Real-Time Event Notifications: Receive instant alerts on new trades, modified orders, closed positions, and deleted orders. Stay informed and make well-timed decisions. 2. Interactive Chart Snapshots: Share chart snapshots along with new trades and ord
SuperTrendCCI
Volkan Mustafaoglu
The best quality application of the famous Super Trend indicator that requires no introduction. It is completely faithful to the original algorithm and powered by the CCI indicator. - easy to trade - It implements all kinds of warnings. - It implements a multi-timezone dashboard. - It cannot be repainted or backpainted. Input parameters - ATR Period – This is the average true range period. - ATR Multiplier - The ATR multiplier that defines the trend. - CCI - Makes trend following powerful. - M
Volume Flow Binance
Thalles Nascimento De Carvalho
Volume Flow Binance! Avez-vous déjà imaginé avoir accès aux times and trades de votre cryptomonnaie préférée, avec des détails sur les flux de volumes et l'analyse des mouvements de prix, même si votre courtier ne fournit pas un accès complet à l'historique des transactions ? Avec Volume Flow Binance , c'est désormais possible ! Ce script en MQL5 a été conçu pour les traders de cryptomonnaies qui recherchent une vue détaillée de la dynamique du marché en temps réel. Caractéristiqu
FREE
Les acheteurs de ce produit ont également acheté
Si vous achetez cet indicateur, vous recevrez mon Gestionnaire de Trading Professionnel + EA  GRATUITEMENT. Tout d'abord, il convient de souligner que ce système de trading est un indicateur non repeint, non redessiné et non retardé, ce qui le rend idéal pour le trading manuel et automatisé. Cours en ligne, manuel et téléchargement de préréglages. Le "Système de Trading Smart Trend MT5" est une solution de trading complète conçue pour les traders débutants et expérimentés. Il combine plus de 10
Divergence Bomber
Ihor Otkydach
4.99 (77)
Chaque acheteur de cet indicateur reçoit également gratuitement : L’outil exclusif « Bomber Utility », qui accompagne automatiquement chaque opération de trading, fixe les niveaux de Stop Loss et de Take Profit, et clôture les positions selon les règles de la stratégie Des fichiers de configuration (set files) pour adapter l’indicateur à différents actifs Des set files pour configurer le Bomber Utility selon différents modes : « Risque Minimum », « Risque Équilibré » et « Stratégie d’Attente » U
Gold Sniper Scalper Pro
Ich Khiem Nguyen
5 (4)
Gold Sniper Scalper Pro - Système de Trading d'Or (XAU/USD) sur MetaTrader 5 Pour le trader sérieux: Abordez le trading d'Or avec une méthodologie structurée et axée sur les données, combinant plusieurs facteurs d'analyse de marché. Cet outil est conçu pour soutenir votre analyse du trading d'Or. Opportunité de Prix Limitée C'est une chance de posséder Gold Sniper Scalper Pro avant que le prix n'augmente.  Le prix du produit augmentera de $50 après chaque série de 10 achats subséquents. Prix Fi
Entry In The Zone and SMC Multi Timeframe est un outil d’analyse de marché en temps réel développé sur la base des Smart Money Concepts (SMC). Il est conçu pour aider les traders à analyser la structure du marché de manière systématique et à obtenir une vision plus claire de la direction globale du marché. Le système analyse automatiquement les Points de Retournement, les Zones Clés et la Market Structure sur plusieurs unités de temps, tout en affichant les Points of Interest (POI), les signaux
Atomic Analyst MT5
Issam Kassas
4.31 (26)
Tout d'abord, il convient de souligner que cet indicateur de trading n'est ni repainting, ni redrawing et ne présente aucun délai, ce qui le rend idéal à la fois pour le trading manuel et automatisé. Manuel de l'utilisateur : réglages, entrées et stratégie. L'Analyste Atomique est un indicateur d'action sur les prix PA qui utilise la force et le momentum du prix pour trouver un meilleur avantage sur le marché. Équipé de filtres avancés qui aident à éliminer les bruits et les faux signaux, et à
FX Power MT5 NG
Daniel Stein
5 (28)
FX Power : Analysez la force des devises pour des décisions de trading plus intelligentes Aperçu FX Power est l'outil essentiel pour comprendre la force réelle des principales devises et de l'or, quelles que soient les conditions du marché. En identifiant les devises fortes à acheter et les faibles à vendre, FX Power simplifie vos décisions de trading et révèle des opportunités à forte probabilité. Que vous suiviez les tendances ou anticipiez les retournements à l'aide de valeurs extrêmes de D
SynaptixQuant Dominance Matrix
Devie Arevalo Montemayor
5 (1)
SynaptixQuant Dominance Matrix: Institutional-Grade Market State Extraction Engineered for traders who require a data-driven view of market behaviour beyond surface-level indicators. The Synaptix Quant (SQ) Dominance Matrix is not a conventional currency strength display. Behind its intentionally streamlined interface runs a sophisticated analytical architecture designed to quantify market conditions with precision. Every output is generated through layered signal processing built to identify d
Grabber System MT5
Ihor Otkydach
4.79 (19)
Je vous présente un excellent indicateur technique : Grabber, qui fonctionne comme une stratégie de trading "tout-en-un", prête à l'emploi. En un seul code sont intégrés des outils puissants d'analyse technique du marché, des signaux de trading (flèches), des fonctions d'alerte et des notifications push. Chaque acheteur de cet indicateur reçoit également gratuitement : L'utilitaire Grabber : pour la gestion automatique des ordres ouverts Un guide vidéo étape par étape : pour apprendre à installe
Quantum TrendPulse
Bogdan Ion Puscasu
5 (19)
Présentation de   Quantum TrendPulse   , l'outil de trading ultime qui combine la puissance de   SuperTrend   ,   RSI   et   Stochastic   dans un seul indicateur complet pour maximiser votre potentiel de trading. Conçu pour les traders qui recherchent précision et efficacité, cet indicateur vous aide à identifier les tendances du marché, les changements de dynamique et les points d'entrée et de sortie optimaux en toute confiance. Caractéristiques principales : Intégration SuperTrend :   suivez f
Tout d'abord, il convient de souligner que cet outil de trading est un indicateur non repeint, non redessiné et non retardé, ce qui le rend idéal pour le trading professionnel. Cours en ligne, manuel utilisateur et démonstration. L'indicateur Smart Price Action Concepts est un outil très puissant à la fois pour les nouveaux et les traders expérimentés. Il regroupe plus de 20 indicateurs utiles en un seul, combinant des idées de trading avancées telles que l'analyse du trader Inner Circle et le
Trend indicator AI mt5
Ramil Minniakhmetov
5 (12)
L'indicateur Trend Ai est un excellent outil qui améliorera l'analyse du marché d'un trader en combinant l'identification des tendances avec des points d'entrée exploitables et des alertes d'inversion. Cet indicateur permet aux utilisateurs de naviguer dans les complexités du marché forex avec confiance et précision Au-delà des signaux primaires, l'indicateur Trend Ai identifie les points d'entrée secondaires qui surviennent lors des retraits ou des retracements, permettant aux traders de capit
FX Volume MT5
Daniel Stein
4.79 (24)
FX Volume : Découvrez le Sentiment du Marché tel que perçu par un Courtier Présentation Rapide Vous souhaitez faire passer votre approche de trading au niveau supérieur ? FX Volume vous fournit, en temps réel, des informations sur la manière dont les traders particuliers et les courtiers sont positionnés—bien avant la publication de rapports retardés comme le COT. Que vous visiez des gains réguliers ou recherchiez simplement un avantage plus solide sur les marchés, FX Volume vous aide à repére
TPSproTREND PrO MT5
Roman Podpora
4.72 (18)
Achetez TREND PRO maintenant et obtenez gratuitement un autre indicateur de tendance avancé Pour recevoir, écrivez en messages privés. VERSION MT4        —        ИНСТРУКЦИЯ RUS           —        INSTRUCTIONS  ENG Fonctions principales : Signaux d'entrée précis SANS RENDU ! Si un signal apparaît, il reste d’actualité ! Il s'agit d'une différence importante par rapport aux indicateurs de redessinage, qui peuvent fournir un signal puis le modifier, ce qui peut entraîner une perte de fonds en d
Top indicator for MT5   providing accurate signals to enter a trade without repainting! It can be applied to any financial assets:   forex, cryptocurrencies, metals, stocks, indices .  Watch  the video  (6:22) with an example of processing only one signal that paid off the indicator! MT4 version is here It will provide pretty accurate trading signals and tell you when it's best to open a trade and close it. Most traders improve their trading results during the first trading week with the help of
Combien de fois avez-vous acheté un indicateur de trading avec d' excellents backtests, des preuves de performance sur compte réel avec des chiffres fantastiques et des statistiques partout , mais après l'avoir utilisé, vous finissez par faire sauter votre compte ? Vous ne devriez pas faire confiance à un signal seul, vous devez savoir pourquoi il est apparu en premier lieu, et c'est ce que RelicusRoad Pro fait de mieux ! Manuel d'utilisation + Stratégies + Vidéos de formation + Groupe privé ave
TrendLine PRO MT5
Evgenii Aksenov
4.67 (33)
L'indicateur   Trend Line PRO   est une stratégie de trading indépendante. Il montre le changement de tendance, le point d'entrée de la transaction, ainsi que le calcul automatique de trois niveaux de protection Take Profit et Stop Loss. Trend Line PRO   est parfait pour tous les symboles Meta Trader : devises, métaux, crypto-monnaies, actions et indices. L'indicateur est utilisé dans le trading sur des comptes réels, ce qui confirme la fiabilité de la stratégie. Pour le moment, l'indicateur
Market Structure Patterns
Samuel Manoel De Souza
4.47 (19)
Disponible pour   MT4   et   MT5 . Rejoignez le canal Market Structure Patterns pour télécharger des documents d'étude et/ou des informations supplémentaires. Articles connexes : Market Structure Patterns - Introduction Market Structure Patterns   est un indicateur basé sur les   Smart Money Concepts   qui affiche les   éléments SMC/ICT   pouvant améliorer vos décisions de trading. Profitez des   alertes ,   notifications push   et   emails   pour être informé lorsqu’un élément se forme sur le
Quantum Trend Sniper
Bogdan Ion Puscasu
4.74 (53)
Présentation       Quantum Trend Sniper Indicator   , l'indicateur révolutionnaire MQL5 qui transforme la façon dont vous identifiez et négociez les inversions de tendance ! Développé par une équipe de traders expérimentés avec une expérience commerciale de plus de 13 ans,       Indicateur Quantum Trend Sniper       est conçu pour propulser votre parcours de trading vers de nouveaux sommets grâce à sa manière innovante d'identifier les inversions de tendance avec une précision extrêmement élevée
Trend Forecaster
Alexey Minkov
5 (7)
The Trend Forecaster indicator utilizes a unique proprietary algorithm to determine entry points for a breakout trading strategy. The indicator identifies price clusters, analyzes price movement near levels, and provides a signal when the price breaks through a level. The Trend Forecaster indicator is suitable for all financial assets, including currencies (Forex), metals, stocks, indices, and cryptocurrencies. You can also adjust the indicator to work on any time frames, although it is recommen
ARIScalping
Temirlan Kdyrkhan
ARIScalp is a powerful trading companion designed to generate high-probability entry signals with dynamic TP/SL/DP levels based on volatility. Built-in performance tracking shows win/loss stats, PP1/PP2 hits, and success rates all updated live. Key Features: Buy/Sell signals with adaptive volatility bands Real-time TP/SL/DP levels based on ATR Built-in MA Filter with optional ATR/StdDev volatility Performance stats panel (Success, Profit/Loss, PP1/PP2) Alerts via popup, sound, push, or email Cus
La meilleure solution pour tout débutant ou trader expert ! Cet indicateur est un outil de trading unique, de haute qualité et abordable car nous avons incorporé un certain nombre de caractéristiques exclusives et une nouvelle formule. Avec seulement UN graphique, vous pouvez lire la force de la devise pour 28 paires Forex ! Imaginez comment votre trading va s'améliorer parce que vous êtes capable de repérer le point de déclenchement exact d'une nouvelle tendance ou d'une opportunité de scalpi
Was: $249  Now: $99   Market Profile defines a number of day types that can help the trader to determine market behaviour. A key feature is the Value Area, representing the range of price action where 70% of trading took place. Understanding the Value Area can give traders valuable insight into market direction and establish the higher odds trade. It is an excellent addition to any system you may be using. Inspired by Jim Dalton’s book “Mind Over Markets”, this indicator is designed to suit the
Blahtech Supply Demand MT5
Blahtech Limited
4.54 (13)
Was: $299  Now: $99  Supply Demand uses previous price action to identify potential imbalances between buyers and sellers. The key is to identify the better odds zones, not just the untouched ones. Blahtech Supply Demand indicator delivers functionality previously unavailable on any trading platform. This 4-in-1 indicator not only highlights the higher probability zones using a multi-criteria strength engine, but also combines it with multi-timeframe trend analysis, previously confirmed swings a
Shock Pullback
Suleiman Alhawamdah
5 (1)
Tout simplement, vous pouvez commencer à trader lorsque le mouvement des chiffres blancs — appelés « pips » — commence à apparaître à côté de la bougie actuelle. Les « pips » blancs indiquent qu’un ordre d’achat ou de vente est actuellement actif et évolue dans la bonne direction, comme le montre leur couleur blanche. Lorsque le mouvement des pips blancs s’arrête et devient vert statique, cela signale la fin de la dynamique en cours. La couleur verte des chiffres représente le profit total réal
Super Signals Channel Indicator Its channel is a non-repaint indicator that reacts more with recent price movements. For this reason, the Super Signals Channel Indicator is a better match for short-term or day trading strategy. The Super Signals Channel only plots swing trading opportunities. So most of its trade signals appear during consolidation or sidelined periods of the market. Super Signals Channel Indicator for MT5 Explanation The green band below the price shows the dynamic support lev
Volume Profile Pro Signals  Analyse précise du volume et génération automatique de signaux. Ce que fait l’outil Volume Profile Pro Signals construit une représentation en direct, fondée sur les données, des zones où le volume de trading se concentre réellement — révélant les zones où le prix est accepté ou rejeté. Il met en évidence POC, VAH, VAL et identifie avec précision les zones HVN/LVN. À partir de ces informations il génère des signaux de breakout en temps réel (VAH/VAL) et trace des ni
MACD Intraday Trend PRO est un indicateur développé grâce à une adaptation du MACD original créé par Gerald Appel dans les années 1960. Au fil des années de négociation, il a été observé qu'en modifiant les paramètres du MACD avec les proportions de Fibonacci, nous obtenons une meilleure présentation de la continuité des mouvements de tendance, ce qui permet de détecter plus efficacement le début et la fin d'une tendance de prix. En raison de son efficacité à détecter les tendances de prix, i
Matrix Arrow Indicator MT5
Juvenille Emperor Limited
5 (17)
Matrix Arrow Indicator MT5   est une tendance unique 10 en 1 suivant un indicateur multi-période   100% non repeint   qui peut être utilisé sur tous les symboles/instruments:   forex ,   matières premières ,   crypto-monnaies ,   indices ,  actions .  Matrix Arrow Indicator MT5  déterminera la tendance actuelle à ses débuts, en rassemblant des informations et des données à partir d'un maximum de 10 indicateurs standard, qui sont: Indice de mouvement directionnel moyen (ADX) Indice de canal de m
TPSpro RFI Levels MT5
Roman Podpora
4.5 (18)
INSTRUCTIONS RUS  /  INSTRUCTIONS   ENG  /  Version MT4 Fonctions principales : Affiche les zones actives des vendeurs et des acheteurs ! L'indicateur affiche tous les niveaux/zones de première impulsion corrects pour les achats et les ventes. Lorsque ces niveaux/zones sont activés, là où commence la recherche de points d'entrée, ils changent de couleur et se remplissent de certaines couleurs. Des flèches apparaissent également pour une perception plus intuitive de la situation. LOGIC AI - Affi
AriX
Temirlan Kdyrkhan
1 (4)
AriX Indicator for MT5 A powerful trend-following and signal-evaluation tool AriX is a custom MT5 indicator that combines Moving Averages and ATR-based risk/reward logic to generate clear buy/sell signals. It visualizes dynamic SL/TP levels, evaluates past trade outcomes, and displays win/loss statistics in a clean on-chart panel. Key features include: Buy/Sell signals based on MA crossovers ATR-based SL/TP1/TP2/TP3 levels with visual lines and labels Signal outcome tracking with real-time stat
Plus de l'auteur
Pmax
Celal Engin Baka
PMax is a brand new indicator developed by KivancOzbilgic in earlier 2020. It's a combination of two trailing stop loss indicators; One is Anıl Özekşi's MOST (Moving Stop Loss) Indicator and the other one is well known ATR based SuperTrend. Both MOST and SuperTrend Indicators are very good at trend following systems but conversely their performance is not bright in sideways market conditions like most of the other indicators. Profit Maximizer - PMax tries to solve this problem.   PMax combi
# Megathron Buttons EA User Guide ## 1. Overview Megathron Buttons EA is a helper tool designed for manual traders. It provides quick and easy trading through various buttons on the chart. ## 2. Installation 1. Install the EA on your MetaTrader 5 platform 2. Drag and drop it onto your desired chart 3. Configure the EA settings (detailed below) ## 3. Buttons and Their Functions ### Main Buttons 1. **BUY Button** (Green)    - Opens a buy position with specified lot size    - Automatically cal
# Weekly & Daily Stochastic Signal Indicator User Guide ## Overview This indicator combines the Stochastic oscillator on weekly and daily timeframes to generate strong trading signals. It aims to create more reliable signals by tracking momentum changes across different timeframes. ## Parameters - **ShortPeriod (14)**: Daily Stochastic period - **ShortPeriodSMA (3)**: Daily Stochastic SMA period - **LongPeriod (70)**: Weekly Stochastic period - **LongPeriodSMA (3)**: Weekly Stochastic SMA per
Filtrer:
Aucun avis
Répondre à l'avis