GS trend I

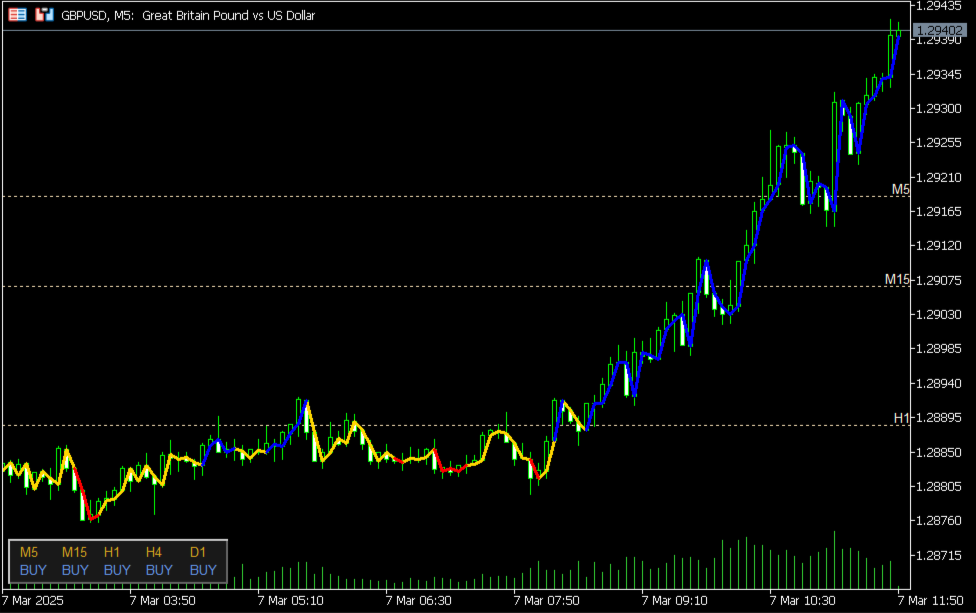
The trend indicator has the ability to adjust the viewing depth and sensitivity, does not repaint and does not lag.

In addition to the current trend, the chart displays trends for 5 more periods with zero trend levels for them.

This allows for a comprehensive assessment of the nature of the trend movement.

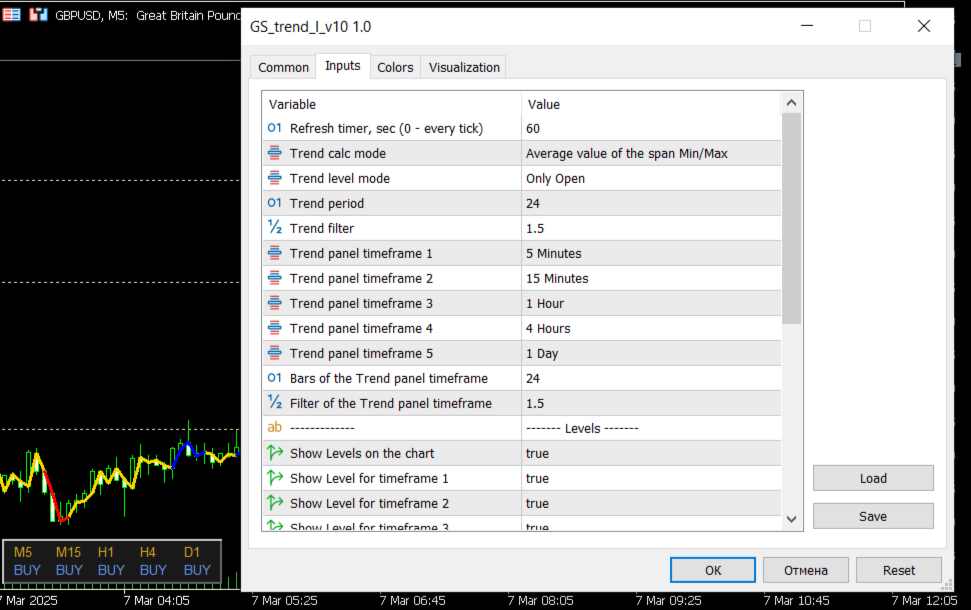
There is a possibility to choose the trend algorithm settings {Only Open, Average Open/Close, Average High/Low}

The trend indicator can be used for any Forex financial instruments.

The color shows the direction of the trend:

  • yellow - direction can be SELL or BUY
  • blue - uptrend BUY
  • red - downtrend SELL

The indicator panel displays the trend values of 5 timeframes for the current price level.

The trend value is recorded by the indicator when the next candle opens.

    GS smart5 Advisor uses an indicator algorithm to determine the trend direction.

      Usage

      1. For visual control of trends and adjustment of advisor parameters or decision making on opening orders manually.
      2. For use in your own advisors as one of the criteria for making a decision to open an order

      An example of an advisor accessing the value of a trend indicator:

      #property copyright "Copyright 2025, MetaQuotes Ltd."
      #property link      " https://www.mql5.com "
      #property version   "1.00"
      #resource "\\Indicators\\GS_trend_I_v12.ex5"
      int handle;
      //--- input parameters
      input int InpTimer=1;   //Timer,sec
      input int NN=5;         //Limit
      //+------------------------------------------------------------------+
      //| Expert initialization function                                   |
      //+------------------------------------------------------------------+
      int OnInit()
       {
         handle=iCustom(NULL,0,"::Indicators\\GS_trend_I_v12.ex5");
         if(handle==INVALID_HANDLE)
              {
               PrintFormat("Error getting the indicator handle GS trend I. Error code = %d",GetLastError());
               return(INIT_FAILED);
              }
      //--- create timer
         EventSetTimer(InpTimer);
         
      //---
         return(INIT_SUCCEEDED);
        }
      //+------------------------------------------------------------------+
      //| Expert deinitialization function                                 |
      //+------------------------------------------------------------------+
      void OnDeinit(const int reason)
        {
      //--- destroy timer
         EventKillTimer();
         
        }
      //------------------------------
      double iCustomGet(const int ind_handle,const int buffer,int start_pos)
        {
         double Custom[1];
         ResetLastError();
         if(CopyBuffer(ind_handle,buffer,start_pos,1,Custom)<0)
           {
            PrintFormat("Failed to copy data from the indicator, error code %d",GetLastError());
            return(0.0);
           }
         return(Custom[0]);
        }
      //+------------------------------------------------------------------+
      //| Timer function                                                   |
      //+------------------------------------------------------------------+
      void OnTimer()
      { static int i=0;
        if (i>NN) return;
        double r=iCustomGet(handle,1,i);
        Alert("i="+(string)i+": GS trend Signal = "+DoubleToString(r,5)+((r==0)?" (SELL_BUY)":(r==1)?" (BUY)":(r==2)?" (SELL)":" (No data)"));
        i++;
       }


      おすすめのプロダクト
      Leave a review for this product, and receive another "Free" product that you choose. You can see my other products here: https://www.mql5.com/en/users/zakri/seller Trend Detective is an advanced trend detection indicator which shows accurate entry points in direction of trend. It uses smart technology in order to detect entry points, trend changing points, and TP points. It also shows hit rate for current chart using selected parameters. Hit rate for this indicator on different charts can be 8
      Terra Infinity is a flat indicator. This improved version of the CalcFlat indicator has three additional lines that significantly increase its effectiveness. Unlike its predecessor with two static levels, Terra Infinity adds three dynamic lines above the main histogram, which are interpreted as follows: base signal line, minimum signal line, maximum signal line. These lines are formed using the additional parameter Avg, which is the average value of the histogram. Averaging produces a line cl
      TRI Visualizer Enhanced - 熱力学的市場分析の革命 概要 TRI(Thermal Range Indicator)Visualizer Enhanced は、従来のテクニカル分析を超越した、物理学の熱力学理論を応用した革新的なマーケット分析インジケーターです。市場の価格変動を「熱力学的エネルギー」として捉え、これまで見落とされていた市場の微細な変化を高精度で検出します。 革新的な仕組み 1. デュアル計算エンジン クラシックTRIモード 基本公式: |終値-始値| + (高値-安値) ローソク足の実体とヒゲを統合した純粋なボラティリティ測定 シンプルで直感的、あらゆる市場環境で安定動作 熱力学的TRIモード(独自開発) 価格加速度 :2次微分による価格変化の勢いを測定 出来高変化率 :相対的な出来高の変化を動的に評価 ポジションエネルギー :正規化された価格変動エネルギーを計算 熱力学的係数 :物理学の熱力学法則を市場分析に応用 2. 高度な平滑化システム SMA(単純移動平均) :基本的なノイズ除去 EMA(指数移動平均) :最新データ重視の平滑化
      The indicator detects divergence signals - the divergences between the price peaks and the MACD oscillator values. The signals are displayed as arrows in the additional window and are maintained by the messages in a pop-up window, e-mails and push-notifications. The conditions which formed the signal are displayed by lines on the chart and in the indicator window. The indicator parameters MacdFast - fast MACD line period MacdSlow - slow MACD line period MacdSignal - MACD signal line period Macd
      RBreaker Gold Indicatorsは、金先物の短期日内取引戦略であり、トレンドフォローと日内反転の2つの取引手法を組み合わせたものです。トレンド相場での利益を捉えるだけでなく、相場が反転した際には迅速に利確し、その流れに沿ってポジションを反転させることができます。 この戦略は、アメリカの雑誌『Futures Truth』において、15年連続で最も収益性の高い取引戦略トップ10に選ばれた実績を持ち、非常に長いライフサイクルを誇り、現在も国内外で広く使用・研究されています。 本インディケーターは、2026年の金先物の値動きに対応し、14日間のATR指標に基づいて、ブレイクアウト係数A、観察係数B、リバーサル係数Rをより合理的な値で定義しています。非常に優れたインディケーターであり、安定的な年間収益を実現しています。ぜひおすすめします〜
      Divergence Hunter - Professional Multi-Oscillator Divergence Detection System Overview Divergence Hunter is a professional-grade technical indicator designed to automatically detect and visualize price-oscillator divergences across multiple timeframes. Built for serious traders who understand the power of divergence trading, this indicator combines precision detection algorithms with an intuitive visual interface. Key Features Multiple Oscillator Support: RSI (Relative Strength Index) MACD (Mo
      FREE
      Elite Harmony Signals Pro Panoramica Elite Harmony Signals è un indicatore sofisticato di analisi tecnica che visualizza rettangoli dinamici che forniscono zone di trading chiare e segnali di conferma per decisioni migliorate. Caratteristiche Principali Zone Rettangolo Dinamiche Estensione in Tempo Reale : I rettangoli si estendono automaticamente all'azione corrente del prezzo Chiusura Intelligente : I rettangoli si chiudono solo quando appaiono segnali opposti Conferma Visiva : Zone di trading
      Trade Today
      Gayathiri Gopalakrishnan
      TRADE TODAY — Advanced Pattern Recognition Indicator for MetaTrader 5 TRADE TODAY is a chart pattern recognition indicator that detects price structures in real time, scores each signal using trend and momentum filters, and displays entry, stop-loss, and take-profit levels directly on the chart. Push notifications, email, and sound alerts are supported. How It Works The indicator scans recent price action for swing points at multiple depths and identifies the following structures: Double Top, Do
      The RSI Divergence + FVG Signal indicator combines Relative Strength Index (RSI) Divergence with Fair Value Gap (FVG) detection to generate high-probability buy and sell signals based on both momentum shifts and institutional imbalance zones. Core Features: RSI Divergence Detection : Identifies both regular and hidden bullish/bearish divergences between price and RSI. Divergences indicate potential trend reversals or continuation. FVG Zone Recognition : Detects Fair Value Gaps (imbalances caused
      Separating Lines Trading System for MetaTrader 5 Separating Lines Trading System is a price action indicator for MT5 designed to detect 2-bar continuation patterns where both candles share the same opening level and the second candle resumes the prevailing trend. A detailed user guide is available on the author’s MQL5 Blog . Additional updates are available through the author’s   MQL5 Channel . Depending on the current support policy, buyers may receive additional access to selected companion t
      Signal Strike
      Murtadha Majid Jeyad Al-Khuzaie
      Signal Strike is a professional trading indicator designed for MetaTrader 5 that delivers clear, high‑confidence entry signals directly on your chart. Built with advanced logic that combines trend, momentum, volatility, and volume confirmation, this tool helps traders identify precise BUY and SELL opportunities with confidence. Unlike generic indicators, Signal Strike is engineered to filter out indecision candles and weak setups. When conditions align, the indicator plots entry, stop loss, an
      The indicator - "ATR Line" determines the current trend and gives signals to buy (green arrow to the top) or sell (red arrow to the bottom). The indicator calculation is based on the deviation of the average price of the instrument from its average true range - ATR. The moving average of prices is used to reduce "market noise". If the main line of the indicator - "ATR Line" is lower the instrument price chart, then the market is in a "bullish" trend. If the main line of the indicator is higher t
      WPRV2 指標の詳細説明 WPRV2は、ウィリアムズ・パーセントレンジ(%R)という古典的なテクニカル分析ツールをベースにした強化版です。この指標は、株式取引所やフォレックス、暗号通貨プラットフォームなどのファイナンスマーケットで利用されており、市場動向の分析や取引ポイントの把握に役立ちます。 指標の目的 WPRV2の主たる目的は、現在価格が最近の高値と安値に対してどの程度近づいているかを測定することです。これによってトレーダーは以下のような情報を獲得できます。 現在の価格は歴史的高値に近いのか? または歴史的安値に近付きつつあるのか? これらの情報から、市場の変動や既存の傾向継続性を素早く察知し、適切な判断を下すことが可能になります。 WPRV2指標の特徴 1. グラフィカル表現 WPRV2はメイン資産チャートから別枠で表示され、次の2本の線で構成されています。 メインライン( WPR ):指定された期間内の%R値の変化を表します。 追加赤ライン( Current ):現在値と一つ前のデータポイントだけを描画し、移動方向を視覚的に追跡します。 2. 横軸レベルと通知機能 ユーザー
      This indicator shows the ratio of the number of buyers'/sellers' orders for the Russian FORTS futures market. Now, you can receive this information in real time in your МetaТrader 5 terminal. This allows you to develop brand new trading strategies or improve the existing ones. The data on the ratio of the orders number is received from the database (text CSV or binary one at user's discretion). Thus, upon completion of a trading session and disabling the terminal (or PC), the data is saved and u
      SMC Pattern Detector  is a technical analysis tool based on  Smart Money Concepts (SMC) . This indicator automates the identification of market structure, supply/demand zones, and SMC patterns. Built on a  No-Repaint  architecture, all signals are confirmed on closed bars.  CORE SMC FOUNDATIONS BOS / CHoCH Detection : Tracking of Break of Structure and Change of Character to identify trend transitions. Order Blocks (OB) : Identifies supply and demand zones with mitigation tracking. Fair Value Ga
      RangeZone  Indicator General Overview: Global Exchange Trading from East to West World financial markets operate on the principle of continuous trading sessions, where activity moves with the sun from one financial center to another. Understanding this dynamic is key to successful trading! How Trading Moves Around the World: Asian Session   (Sydney, Tokyo): Opens first, sets the tone for daily volatility Japanese yen, Australian dollar, Asian indices Often forms key support/resistance level
      Developed by MMQ —  Market Profile Suite   Was: $79 Now: $59 A comprehensive Market Profile indicator for MetaTrader 5 that visualizes price distribution through TPO (Time Price Opportunity) analysis. The implementation draws from concepts presented in Jim Dalton's "Mind Over Markets," providing traders with tools to understand market structure, value areas, and volume distribution across multiple timeframes and session configurations. Links [ Documentation  |  Video  | More ] Feature Highlight
      FourAverageは、トレンド検出の新しい単語です。 情報技術の発展と多数の参加者に伴い、金融市場は時代遅れの指標による分析にあまり適していなくなっています。 移動平均や確率などの従来のテクニカル分析ツールは、純粋な形でトレンドの方向やその反転を決定することはできません。 1つの指標は、14年の歴史に基づいて、そのパラメータを変更することなく、将来の価格の正しい方向を示すことができますか? 同時に、横向きの市場の動きで妥当性を失うことはありませんか? 答え:はい、それはできます。 私たちのチームは、変化する市場の状況に適応するためのかなり強力で効果的なメカニズムを持つ指標を開発しました。 2025年には、主要なトレンド指標"Four平均"は開発の新しい段階に入っています。 現代の暗号通貨と株式市場は、この指標のために作成されたようです。 独自の平滑化式を使用すると、通貨ペアまたは他の楽器の任意の機能のための指標を調整(パターンを識別)することができます。 さて、利益を上げるためには、1つの指標で十分であり、これはほんの始まりに過ぎません。 他のツールと組み合わせて、または信号フィル
      SlopeChannelB – 価格の傾斜チャネルを構築するテクニカル分析ツールで、市場の現状を評価し、取引シグナルを見つけるためのユニークな機会を提供します。 インジケーターの主な特徴: 価格の傾斜チャネル : このインジケーターは、サポートとレジスタンスのレベルを視覚化するのに役立ち、トレンドの逆転または継続の可能性を示すことができます。 ラインの色と背景の強調表示が異なる : 傾斜したサポートとレジスタンスのレベルは異なる色で表示され、チャネル自体はさらに背景で強調され、チャートの視覚的分析を簡素化します。 ライン計算のための3つのオプション : このインジケーターは回帰分析を使用してチャネルラインを構築します。3つの方法から選択できます: Robust(デフォルト) – 外れ値に強い方法。 OLS(最小二乗法) . Median(中央値計算) . 最適なモデル選択 : SlopeChannelBは5つの品質基準の分析に基づいて最も適切なチャネルラインのバリエーションを自動的に選択します。 品質パラメータはチャートに直接表示され、結果の評価に役立ちます。また、ボタンを使
      Crash 900 Precision Spike Detector The Crash 900 Precision Spike Detector is your ultimate tool for trading the Crash 900 market with precision and confidence. Equipped with advanced features, this indicator helps you identify potential sell opportunities and reversals, making it an essential tool for traders aiming to capture spikes with minimal effort. Key Features: Non-Repainting Signals: Accurate, non-repainting signals that you can trust for reliable trading decisions. Audible Alerts: Stay
      An indicator of pattern #31 ("Long Island") from Encyclopedia of Chart Patterns by Thomas N. Bulkowski. The second gap is in the opposite direction. Parameters: Alerts - show alert when an arrow appears   Push - send a push notification when an arrow appears (requires configuration in the terminal) GapSize - minimum gap size in points ArrowType - a symbol from 1 to 17 ArrowVShift - vertical shift of arrows in points   ShowLevels - show levels ColUp - color of an upward line ColDn - color of a d
      DAILY OH/OL SDEV QUANT MODEL - STATISTICAL TRADING WITH PRECISION RISK MANAGEMENT TRADE WITH MATHEMATICAL CERTAINTY - KNOW YOUR EXACT STOP-LOSS AND TAKE-PROFIT BEFORE YOU ENTER This indicator analyzes 5,000+ days of price history to give you: Exact entry levels (sigma bands locked at daily open) Exact stop-loss distance (from M
      Japanese このインジケーターは、チャートパターンでのトレードを好むトレーダーにとって、高度なチャート分析アシスタントとして機能します。目視での分析負担を軽減し、利益を上げるための精度を高めるように設計されています。 実際の使用においての、このインジケーターの主な利点と特徴は以下の通りです: 1. 自動パターン検出 (Automated Pattern Detection) 時間の節約とバイアスの軽減: 手動でトレンドラインを引く必要はありません。価格のスイングポイント(Pivot High/Low)を検索し、価格構造が条件を満たすと、ライジングウェッジ(上昇楔形)とフォーリングウェッジ(下降楔形)を自動的に描画します。 あらゆる状況を網羅: パターン形成中、ブレイクアウト、さらにはパターン失敗(Failed)まで検出でき、市場の全体像を明確に把握できます。 2. ターゲットとフィボナッチTPの内蔵 (Built-in Targets & Fibonacci TP) ターゲットを自動計算: ブレイクアウトが発生すると、システムはウェッジの開き幅に基づいてメインターゲットの距離を即
      Crash 600 Precision Spike Detector The Crash 600 Precision Spike Detector is an essential tool designed to help traders navigate the Crash 600 market with accuracy and efficiency. Packed with advanced features, this indicator provides precise alerts that allow traders to capture spikes and reversals with confidence. Key Features: Non-Repainting Signals: Dependable, non-repainting signals that ensure your trading decisions are based on real-time, accurate data. Audible Alerts: Receive sound notif
      I really like this indicator. But I made it, so of course I would.. NOW FREE. But please consider supporting me by buying my 2 for sale indicators. You can multiply the weight of each indicator used to give more emphasis on it's value when averaging between the 3. Boost fast TEMA and it can move the indicator faster. Boost slow FrAMA and watch it smooth out. I like to use them as open/close lines and set them up so they move quick, but have the FrAMA smooth it out more.  Check out my other indi
      The   Trendlines Oscillator   helps traders identify trends and momentum based on the normalized distances between the current price and the most recently detected bullish and bearish trend lines. The indicator features bullish and bearish momentum, a signal line with crossings, and multiple smoothing options. USAGE The   Trendlines Oscillator   works by systematically: Identifying pivot highs and lows. Connecting pivots to form bullish (support) and bearish (resistance) trendlines. Measuring
      ゴールド市場は、単に価格だけで動いているわけではありません。市場は売買の攻防、需給の不均衡、そして注文フローによって動いています。Delta Indicator は、それらを可視化するために開発されました。 RBM Trader の XAUUSD Delta Indicator は、積極的な買い手と売り手の差を分析し、価格変動が明確に現れる前に市場の本当の圧力を把握することを可能にします。 多くのトレーダーがローソク足だけを見ている中、Delta は価格の裏側で実際に何が起きているかを示します。 このインジケーターは、XAUUSD専用に開発されており、米国市場、アジア市場、欧州市場におけるゴールド特有のボラティリティと値動きを考慮しています。 主な機能: * 買い圧力・売り圧力の検出   * トレンドの勢い減少を識別   * 反転の可能性を確認   * ブレイクアウトの有効性を検証   * フローとモメンタムをより正確に分析   * シンプルで見やすいインターフェース   * スキャルピング、デイトレード、短期売買向けに最適化   Delta Indicator はランダ
      プレミアムレベルは、正しい予測の精度が80%を超える独自の指標です。 この指標は、最高のトレーディングスペシャリストによって2か月以上テストされています。 あなたが他のどこにも見つけられない作者の指標! スクリーンショットから、このツールの正確さを自分で確認できます。 1は、1キャンドルの有効期限を持つバイナリーオプションの取引に最適です。 2はすべての通貨ペア、株式、商品、暗号通貨で機能します 手順: 赤い矢印が表示されたらすぐにダウントレードを開き、青い矢印が表示されたら閉じます。青い矢印の後に開くこともできます。 試してテストしてください!推奨設定はデフォルトです! 日足チャートで最高の精度を示します! インディケータは、2600 Pipsの収益性に対して、約10Pipsという非常に小さなマージンを使用します。
      Ichimoku Aiko MTF
      Michael Jonah Randriamampionontsoa
      Ichimoku Aiko MTF is a collection of technical indicators that show support and resistance levels, as well as momentum and trend direction. It is a multi-timeframe indicator so you don't need to change the chart timeframe when you want to see the ichimoku clouds on a higher timeframe.  eg. The chart timeframe is M15 and you want to see on the M15 timeframe chart the H1 ichimoku indicators (the ichimoku in Metatrader can't do that) that's why you need to use Ichimoku Aiko MTF.
      インディケータは現在のクオートを作成し、これを過去のものと比較して、これに基づいて価格変動予測を行います。インジケータには、目的の日付にすばやく移動するためのテキスト フィールドがあります。 オプション: シンボル - インジケーターが表示するシンボルの選択; SymbolPeriod - 指標がデータを取る期間の選択; IndicatorColor - インジケータの色; HorisontalShift - 指定されたバー数だけインディケータによって描画されたクオートのシフト; Inverse - true は引用符を逆にします。false - 元のビュー。 ChartVerticalShiftStep - チャートを垂直方向にシフトします (キーボードの上下矢印)。 次は日付を入力できるテキストフィールドの設定で、「Enter」を押すとすぐにジャンプできます。
      このプロダクトを購入した人は以下も購入しています
      ARIPoint is a powerful trading companion designed to generate high-probability entry signals with dynamic TP/SL/DP levels based on volatility. Built-in performance tracking shows win/loss stats, PP1/PP2 hits, and success rates all updated live. Key Features: Buy/Sell signals with adaptive volatility bands Real-time TP/SL/DP levels based on ATR Built-in MA Filter with optional ATR/StdDev volatility Performance stats panel (Success, Profit/Loss, PP1/PP2) Alerts via popup, sound, push, or email Cu
      SuperScalp Pro
      Van Minh Nguyen
      4.63 (24)
      SuperScalp Pro – 高度なマルチフィルタースキャルピングインジケーターシステム SuperScalp Pro は、クラシックな Supertrend と複数のインテリジェント確認フィルターを組み合わせた高度なスキャルピングインジケーターです。M1 から H4 まで複数の時間足で効率的に動作し、XAUUSD、BTCUSD、主要 Forex 通貨ペア向けに最適化されています。 このインジケーターは明確な Buy / Sell シグナルを提供し、ATR に基づいてエントリー価格、Stop Loss、Take Profit を自動計算します。Fibonacci Take Profit 機能により、重要な価格帯で早期決済し、到達時に通知を送信します。 初期設定では Fibonacci Take Profit が有効化されており、より安定した取引体験を重視しています。チャートに適用するだけですぐ利用可能です。上級者向けに、すべてのパラメータは自由にカスタマイズできます。 EMA、RSI、ADX、Volume、VWAP、Bollinger Bands、MACD Divergence な
      Entry In The Zone and SMC Multi Timeframe is a real-time 2-in-1 market analysis tool that combines market structure analysis and a No Repaint BUY / SELL signal system into a single indicator, built on Smart Money Concepts (SMC) — a widely adopted framework used by professional traders to understand market structure. This indicator helps you see the market more clearly, make decisions based on structure rather than guesswork, and focus on high-probability zones where price is more likely to react
      このインジケーターを購入された方には、以下の特典を 無料 で提供しています: 各トレードを自動で管理し、ストップロスとテイクプロフィットを設定し、戦略ルールに基づいてポジションを決済する補助ツール 「Bomber Utility」 様々な銘柄に合わせたインジケーターの設定ファイル(セットファイル) 「最小リスク」、「バランスリスク」、「待機戦略」 の3つのモードで使用できる Bomber Utility 用の設定ファイル このトレーディング戦略をすぐに導入・設定・開始できる ステップバイステップのビデオマニュアル ご注意: 上記の特典を受け取るには、MQL5のプライベートメッセージシステムを通じて販売者にご連絡ください。 オリジナルのカスタムインジケーター 「Divergence Bomber(ダイバージェンス・ボンバー)」 をご紹介します。これは、MACDのダイバージェンス(乖離)戦略に基づいた 「オールインワン」型のトレーディングシステム です。 このテクニカルインジケーターの主な目的は、価格とMACDインジケーターの間に発生するダイバージェンスを検出 し、将来の価格の動きを示す
      Power Candles V3 - 自己最適化型強弱インジケーター Power Candles V3は 、通貨や銘柄の強さを、適用されたすべてのチャート上で実行可能なトレードプランに変換します。単にローソク足を色分けするだけでなく、バックグラウンドでリアルタイムの自動最適化を実行し、目の前の銘柄に対して最適なストップロス、テイクプロフィット、およびシグナルの閾値を提示します。ワンクリックで実取引に適用でき、エントリーポイント、ストップロス、テイクプロフィットのラインが正確な価格位置にチャート上に表示され、方向性を示すアラートがリアルタイムで発動します。 このツールは、Stein Investmentsのエコシステムの一部です。  18種類以上のツールをすべて閲覧し、AIを活用したセットアップの推奨事項を入手し、  https://stein.investments でコミュニティに参加しましょう クローズしたバーごとに3,000回以上のトレードシミュレーション。9つの強さの状態。2つの戦略を並行してテスト。勝率の高い設定をワンクリックで適用。 なぜこれが必要なのか ほとんどの強
      SignalTech MT5 is a fully rule based trading system for EURUSD, USDCHF, USDJPY, AUDUSD, NZDUSD, EURJPY, AUDJPY, NZDJPY, CADJPY.  All the winning trades with chart setups are published on the comments page. 2025-12 1174 Pips 2026-01 2624 Pips 2026-02 2937 Pips 2026-03 2165 Pips 2026-04 2243 Pips It can generate signals with Buy/Sell Arrows and Pop-Up/Sound Alerts. Each signal has clear Entry and Stop Loss levels, which should be automatically flagged on the chart, as well as potential Targets 1,
      ご紹介     Quantum Breakout PRO は 、ブレイクアウト ゾーンの取引方法を変革する画期的な MQL5 インジケーターです。 13年以上の取引経験を持つ経験豊富なトレーダーのチームによって開発されました。     クォンタム ブレイクアウト プロ   は、革新的でダイナミックなブレイクアウト ゾーン戦略により、あなたのトレーディングの旅を新たな高みに押し上げるように設計されています。 クォンタム ブレイクアウト インジケーターは、5 つの利益ターゲット ゾーンを備えたブレイクアウト ゾーン上のシグナル矢印と、ブレイクアウト ボックスに基づいたストップロスの提案を提供します。 初心者トレーダーにもプロのトレーダーにも適しています。 量子EAチャネル:       ここをクリック 重要!購入後、インストールマニュアルを受け取るためにプライベートメッセージを送ってください。 推奨事項: 時間枠: M15 通貨ペア: GBPJPY、EURJPY、USDJPY、NZDUSD、XAUUSD アカウントの種類: ECN、Raw、またはスプレッドが非常に低い R
      Azimuth Pro
      Ottaviano De Cicco
      5 (7)
      Azimuth Pro V2:MT5向けシンセティック・フラクタル構造分析と確認済みエントリー 概要 Azimuth Pro は Merkava Labs によるマルチレベルスイング構造インジケーターです。4つのネストされたスイングレイヤー、スイングアンカーVWAP、ABCパターン検出、3タイムフレーム構造フィルタリング、そして確定バーでの確認済みエントリー — 1つのチャートで、ミクロスイングからマクロサイクルまでを網羅するワークフロー。 これはブラインドシグナル製品ではありません。ロケーション、コンテキスト、タイミングを重視するトレーダーのための構造ファーストワークフローです。 V2発売記念オファー — Azimuth Pro V2をUSD 399で(次の100本)。最終価格:USD 499。 1. V2での変更点 シンセティック・マルチタイムフレームエンジン 上位タイムフレーム分析をMeridian Proと同じ独自のシンセティックアーキテクチャで一から再構築。よりクリーンなHTFコンテキスト、安定したライブ動作、従来のMTF同期問題なし。シンセティックエンジンは 固定比率タ
      Gann Made Easy   は、ミスター・ギャンの理論を使用した取引の最良の原則に基づいた、プロフェッショナルで使いやすい外国為替取引システムです。 W・D・ガン。このインジケーターは、ストップロスとテイクプロフィットレベルを含む正確な買いと売りのシグナルを提供します。 PUSH通知を利用して外出先でも取引可能です。 ご購入後、取引方法の説明と優れた追加インジケーターを無料で入手するには、私にご連絡ください! おそらく、ギャンの取引手法についてはすでに何度も聞いたことがあるでしょう。通常、ギャンの理論は初心者のトレーダーだけでなく、すでにある程度の取引経験がある人にとっても非常に複雑なものです。なぜなら、ギャンの取引手法は理論的にはそれほど簡単に適用できるものではないからです。私はその知識を磨き、最良の原則を私の外国為替インジケーターに組み込むために数年を費やしました。 このインジケーターは非常に簡単に適用できます。必要なのは、それをチャートに添付し、簡単な取引推奨事項に従うだけです。このインジケーターは常に市場分析の仕事を行い、取引の機会を探します。適切なエントリーポイントを検
      RelicusRoad Pro: 定量的市場オペレーティングシステム 【期間限定】無制限アクセス 70% OFF - 2,000人超のトレーダーと共に なぜ多くのトレーダーは「完璧な」インジケーターを使っても失敗するのでしょうか? それは、文脈を無視して 単一の概念 だけでトレードしているからです。文脈のないシグナルは単なるギャンブルです。勝ち続けるには、 根拠の重なり(コンフルエンス) が必要です。 RelicusRoad Proは単なる矢印インジケーターではありません。完全な 定量的市場エコシステム です。独自のボラティリティモデリングを用いて、価格が推移する「適正価値の道(Fair Value Road)」をマッピングし、ノイズと真の構造的ブレイクを判別します。 推測はやめましょう。機関投資家レベルの「ロード・ロジック」でトレードを。 コアエンジン:「Road」アルゴリズム システムの中心となる Road Algo は、市場環境にリアルタイムで適応するダイナミックなボラティリティチャネルです。 安全ライン(平衡点) と、価格が数学的に反転しやすい 拡張レベル を投影します。 Si
      MetaTrader 5 向けスマート多層ブレイクアウト&プルバック検出器 「スマート・シンプル・ファスト!」 高確率のブレイクアウトエントリーを見逃すことにうんざりしていませんか? 複数のチャートを何時間もスキャンし、ブレイクアウトをトレンド方向と通貨のモメンタムに合わせようとして、それでも動きを逃してしまうことはありませんか? Break Pullback は、1つのインジケーターでそのすべてを解決します。 Break Pullback とは何ですか? Break Pullback は、マーケットストラクチャー、ブレイクアウト、トレンド継続のセットアップを取引するトレーダー向けに特別に設計されたプロフェッショナルグレードの MetaTrader 5 インジケーターです。 リアルタイムで複数の通貨ペアにわたるブレイクとプルバックの形成を自動的に検出し、3層の確認を通じてすべてのシグナルをフィルタリングします: ストラクチャラルブレイクアウト検出 — チャート上の主要なブレイクレベルを特定 HTF 日足バイアス — エントリーを支配的な日足トレンド方向に合わせる 通貨強弱指数 —
      このインジケーターを購入すると、プロ仕様のトレードマネージャーを無料で差し上げます。 まず第一に、このトレーディングシステムがノンリペイント、ノンリドロー、ノンラグのインジケーターであることを強調する価値がある。これにより、手動取引とロボット取引の両方に理想的なものになっています。 オンラインコース、マニュアル、プリセットのダウンロード。 「スマートトレンドトレーディングシステム MT5」は、新規および経験豊富なトレーダー向けにカスタマイズされた包括的なトレーディングソリューションです。10以上のプレミアムインジケーターを組み合わせ、7つ以上の堅実なトレーディング戦略を備えており、多様な市場状況に対応する多目的な選択肢となっています。 トレンドフォロー戦略:トレンドを効果的に乗り越えるための正確なエントリーとストップロス管理を提供します。 リバーサル戦略:潜在的なトレンドの反転を特定し、トレーダーがレンジ相場を活用できるようにします。 スキャルピング戦略:高速で正確なデイトレードおよび短期取引のために設計されています。 安定性:すべてのインジケーターはノンリペイント、ノンリドロー、ノ
      まず第一に、この取引インジケーターは再描画されず、再描画されず、遅延しないことを強調する価値があります。これにより、手動取引とロボット取引の両方に理想的なものになります。 ユーザーマニュアル:設定、入力、戦略。 アトミックアナリストは、価格の強さとモメンタムを利用して市場でより良いエッジを見つけるためのPA価格アクションインジケーターです。ノイズや誤ったシグナルを除去し、取引ポテンシャルを高めるための高度なフィルターを備えています。複雑なインジケーターの複数のレイヤーを使用して、アトミックアナリストはチャートをスキャンし、複雑な数学的計算をシンプルなシグナルと色に変換します。これにより、どのような初心者トレーダーでも理解して使用し、一貫した取引の決定を行うことができます。 「アトミックアナリスト」は、新規および経験豊富なトレーダー向けにカスタマイズされた包括的な取引ソリューションです。プレミアムインジケーターとトップノッチの機能を1つの取引戦略に組み合わせ、すべてのタイプのトレーダーにとって汎用性のある選択肢にします。 デイリートレーディングとスキャルピング戦略:高速で正確なデイ
      Quantum TrendPulse を ご紹介します。これは、   SuperTrend   、   RSI   、および Stochastic のパワーを 1 つの包括的なインジケーターに組み合わせて、取引の可能性を最大限に引き出す究極の取引ツールです。精度と効率を求めるトレーダー向けに設計されたこのインジケーターは、市場のトレンド、勢いの変化、最適なエントリー ポイントとエグジット ポイントを自信を持って特定するのに役立ちます。 主な特徴: SuperTrend 統合: 現在の市場動向に簡単に追従し、収益性の波に乗ることができます。 RSI精度: 買われすぎと売られすぎのレベルを検出し、市場の反転のタイミングに最適で、SuperTrendのフィルターとして使用されます。 確率的精度: 確率的振動を活用して、変動の激しい市場で隠れたチャンスを見つけます。SuperTrend のフィルターとして使用されます。 マルチタイムフレーム分析:   M5 から H1 または H4 まで、さまざまなタイムフレームで市場を常に把握します。 カスタマイズ可能なアラート: カスタム取引条件が満たされ
      FX Trend NG:次世代マルチマーケット・トレンドインテリジェンス 概要 FX Trend NG は、複数の時間足に対応したプロフェッショナル向けトレンド分析およびマーケット監視ツールです。 市場全体の構造を数秒で把握することができます。 複数のチャートを切り替える必要はありません。どの銘柄がトレンド中なのか、どこでモメンタムが弱まっているのか、そしてどの時間足で強い整合性があるのかを瞬時に確認できます。 ローンチ特別オファー – FX Trend NG を $30(6ヶ月) または $80 永久ライセンス でご利用いただけます。 すでに Stein Investments のユーザーですか? -> メッセージを送信 して、プライベートグループへアクセスしてください。 セットアップや詳細情報が必要ですか? -> Stein Investments 公式ページ をご覧ください。 1. FX Trend NG が他と異なる理由 3ステート・トレンドロジック ― Buy と Sell だけではない • 多くのインジケーターは Buy または Sell の2状態のみを表示します。
      BTMM State Engine Pro is a MetaTrader 5 indicator for traders who use the Beat The Market Maker approach: Asian session context, kill zone timing, level progression, peak formation detection, and a multi-pair scanner from a single chart. It combines cycle state logic with a built-in scanner dashboard so you do not need the same tool on many charts at once. What it does Draws the Asian session range; session times can follow broker server offset or be set in inputs. Tracks level progression (L
      Market Structure Order Block Dashboard MT5 は、市場構造と主要な価格反応ゾーンをチャート上で直接読み取りたいトレーダー向けに設計された MT5 インジケーターです。BOS、ChoCH、オーダーブロック、Fair Value Gap (FVG)、流動性、Kill Zones、Volume Profile、そして素早い分析のためのコンパクトなダッシュボードを組み合わせています。 本インジケーターは、市場構造、ICT、Smart Money の概念を意思決定の枠組みとして使用するトレーダーを対象としています。トレンド継続、反転の可能性、価格の不均衡、流動性ターゲット、注目ゾーンをより構造的に特定する助けとなります。 購入者向けの付属リソース 購入後、MQL5 のプライベートメッセージにてご依頼いただくと、完全な PDF ユーザーガイドとパラメータ設定のヒントを提供いたします。MQL5 のプライベートメッセージによる直接的な技術サポート。 バージョン 1.20 では 2 つの重要な追加機能があります: Pending BOS / Pending Cho
      まず第一に、この取引ツールはノンリペイント、ノンリドロー、ノンラグの指標であり、プロの取引に理想的ですことを強調する価値があります。 オンラインコース、ユーザーマニュアル、デモ。 スマートプライスアクションコンセプトインジケーターは、新米から経験豊富なトレーダーまで、非常 に強力なツールです。Inner Circle Trader AnalysisやSmart Money Concepts Trading Strategiesなど、20以上の有用な指標を1つに組み合わせています。このインジケーターはスマートマネーコンセプトに焦点を当て、大手機関の取引方法を提供し、彼らの動きを予測するのに役立ちます。 特に、流動性分析に優れており、機関がどのように取引しているかを理解しやすくしています。市場のトレンドを予測し、価格の動きを慎重に分析するのに優れています。機関の戦略とトレードを合わせることで、市場の動向についてより正確な予測ができます。このインジケーターは多目的であり、市場構造を分析し、重要な注文ブロックを特定し、さまざまなパターンを認識するのに優れています。 このインジケーター
      OrderFlux | MetaTrader 5 用フットプリント・オーダーフロー バージョン 2.0 – アクティブトレーダー向けのリアルタイム Bid/Ask 可視化 OrderFlux は MT5 用のフットプリントおよびオーダーフローインジケーターです。価格がどこに動いたかだけでなく、その動きの中で何が起きているか(各価格レベルの Bid/Ask ボリューム、デルタ、インバランス、ボリューム分布)を表示します。 多くのチャートはローソク足の最終結果しか表示しません。OrderFlux はそこに至るまでの過程を表示します。ローソク足の形状だけでなく、市場参加者の動向を読み取りたい場合にまさに役立ちます。 ライブチャートにおいて、OrderFlux は主に次の3つの質問に答えます: 現在、どこで積極的な買いまたは売りの圧力が市場に参入しているか? どの価格レベルでボリュームが吸収、または拒否されているか? 現在の動きはセッションのコンテキスト(背景)にどう適合しているか? インターフェースで得られるもの メインチャートは、Canvas ベースでフットプリントを直接レンダリングします
      優れたテクニカルインジケーター「Grabber」をご紹介します。これは、すぐに使える「オールインワン」トレーディング戦略として機能します。 ひとつのコードに、市場のテクニカル分析ツール、取引シグナル(矢印)、アラート機能、プッシュ通知が強力に統合されています。 このインジケーターを購入された方には、以下の特典を無料で提供します: Grabberユーティリティ:オープンポジションを自動で管理するツール ステップバイステップのビデオマニュアル:インジケーターのインストール、設定、取引方法を解説 カスタムセットファイル:インジケーターをすばやく自動設定し、最大限の成果を出すための設定ファイル 他の戦略はもう忘れてください!Grabberだけが、あなたを新たなトレードの高みへと導いてくれるのです。 Grabber戦略の主な特徴: 推奨タイムフレーム:M5〜H4 対応通貨ペア・資産:どれでも使用可能ですが、私が実際に検証した以下を推奨します(GBPUSD、GBPCAD、GBPCHF、AUDCAD、AUDUSD、AUDSGD、AUDCHF、NZDUSD、NZDCAD、EURCAD、EURUSD、E
      Crystal Heikin Ashi Signals - Professional Trend & Signal Detection Indicator Advanced Heikin Ashi Visualization with Intelligent Signal System for Manual & Automated Trading Final Price: $149 ---------> Price goes up $10 after every 10 sales . Limited slots available — act fast . Overview Crystal Heikin Ashi Signals is a professional-grade MetaTrader 5 indicator that combines pure Heikin Ashi candle visualization with an advanced momentum-shift detection system. Designed for both manual traders
      まず正直に言いましょう。 どんなインジケーターも、それ単体であなたを利益化させることはできません。もしそう言う人がいるなら、それは夢を売っているだけです。完璧な売買シグナル(矢印)を表示するインジケーターは、いくらでも“完璧に見せる”ことができます。正しい過去の区間を拡大して、勝ちトレードだけを切り取ればいいだけです。私たちはそれをしません。 SMC Intraday Formula はツールです。 市場構造を読み取り、最も高い確率の価格ゾーンを特定し、今この瞬間のスマートマネーの痕跡をシンプルな言葉で正確に示します。最終判断はあなたが行います。トレードを実行するのもあなたです。しかし今は「希望」ではなく「精度」でエントリーできます。 私たちはこのインジケーターを、ゴールド(XAUUSD)および主要FX通貨ペアで約3年間、日々のスキャルピングに使用してきました。M1、M5、M15、M30の主要ツールです。これは未来を予測しようとするのではなく、今まさに形成されている高確率セットアップを示し、その理由を説明します。 他のすべてのインジケーターと何が違うのか? ほとんどのトレーディングイ
      「 Dynamic Scalper System MT5 」インジケーターは、トレンド波の中でスキャルピング取引を行う手法のために設計されています。 主要通貨ペアと金でテスト済みで、他の取引商品との互換性があります。 トレンドに沿った短期的なポジションオープンのシグナルを提供し、追加の価格変動サポートも提供します。 インジケーターの原理 大きな矢印はトレンドの方向を決定します。 トレンド波の中では、小さな矢印の形でスキャルピングシグナルを生成するアルゴリズムが機能します。 赤い矢印は強気方向、青い矢印は弱気方向です。 トレンドの方向には敏感な価格変動ラインが描かれ、小さな矢印のシグナルと連動します。 シグナルは次のように機能します。適切なタイミングでラインが現れるとエントリーシグナルが形成され、ラインが開いている間はポジションが保持され、完了すると取引が終了します。 推奨される動作時間枠はM1~H4です。 矢印は現在のローソク足に形成され、次のローソク足が開いている場合は、前のローソク足の矢印は再描画されません。 入力パラメータ Trend Wave Period - トレ
      このダッシュボードは、選択されたシンボルの最新の利用可能なハーモニックパターンを表示するので、時間を節約し、より効率的に /   MT4バージョン 。 無料インジケーター:   Basic Harmonic Pattern インジケーター列 Symbol : 選択したシンボルが表示されます。 Trend :   強気または弱気 Pattern : パターンの種類(ガートレー、バタフライ、バット、カニ、サメ、サイファー、ABCD) Entry : エントリー価格 SL: ストップロス価格 TP1: 1回目の利食い価格 TP2: 2回目の利食い価格 TP3:   3回目の利食い価格 Current price :   現在値 Age (in bars):    最後に描画されたパターンの年齢 主な入力項目 Symbols:   "28 Major Currency Pairs "または "Selected Symbols "から選択。 Selected Symbols:   カンマで区切られた監視したいシンボル("EURUSD,GBPUSD,XAUUSD")。ブローカーがペアに接
      Meridian Pro
      Ottaviano De Cicco
      5 (2)
      Meridian Pro 2.00:MT5向けプロ仕様マルチタイムフレーム・トレンドマトリクス Meridian Pro 2.00 は、MetaTrader 5 向けのプロ仕様の適応型トレンドマトリクスです。オリジナルの Meridian トレンドエンジン、クリーンなチャート ribbon、確定足ベースのシグナル矢印、8時間足 dashboard、Fuel momentum、weighted consensus、synthetic HTF processing、そしてチャート上に直接表示される上位足コンテキストラインを統合します。 目的はシンプルです。現在のトレンド、マルチタイムフレーム構造、強度、momentum、EA-ready 状態を、複数チャートに無関係なインジケータを重ねるのではなく、1つの整理された workflow で読むことです。 Meridian Pro の違い 1つの適応型エンジン - 同じ volatility-aware Meridian ロジックを M1 から W1 まで適用します。 Synthetic HTF architecture - 上位足行は下位足デ
      OmniSync Projection
      Antonio-alin Teculescu
      5 (1)
      Chronos Fractal Engine is an innovative price projection indicator for MetaTrader 5, designed to transform your technical analysis by intelligently identifying and projecting historical price patterns. Built upon an advanced correlation algorithm and the fractal principles of the market, this powerful tool visualizes potential future price movements, giving you a unique edge in your trading decisions. What is Chronos Fractal Engine? At its core, the Chronos Fractal Engine employs a sophisticat
      FX Power: 通貨の強弱を分析して、より賢い取引を実現 概要 FX Power は主要通貨と金の実際の強弱をあらゆる市場状況で理解するための必須ツールです。強い通貨を買い、弱い通貨を売ることで、 FX Power は取引の意思決定を簡素化し、高い確率の取引機会を見出します。トレンドを追従する場合でも、極端なデルタ値を使用して反転を予測する場合でも、このツールはあなたの取引スタイルに完全に適応します。ただ取引するだけではなく、 FX Power で賢く取引をしましょう。 1. なぜ FX Power がトレーダーにとって非常に有益なのか 通貨と金のリアルタイム強弱分析 • FX Power は主要通貨と金の相対的な強弱を計算し、マーケットダイナミクスに関する明確な洞察を提供します。 • どの資産がリードしているか、または後れを取っているかを監視して、取引するペアを賢く選びましょう。 マルチタイムフレームの包括的なビュー • 短期、中期、長期のタイムフレームで通貨と金の強弱を追跡し、マーケットトレンドに基づいて取引戦略を調整できます。 • スキャルピングからスイングトレード
      FX Levels: あらゆる市場における非常に高精度なサポート&レジスタンス 概要 通貨ペア、株式指数、個別銘柄やコモディティなど、どのような市場でも信頼できるサポートとレジスタンスを特定したいですか? FX Levels は伝統的な “Lighthouse” メソッドと先進的な動的アプローチを融合し、ほぼ汎用的な精度を実現します。ブローカーの実務経験を活かし、自動化されたデイリー更新とリアルタイム更新を組み合わせることで、 FX Levels は反転ポイントを見つけ、利益目標を設定し、自信をもってトレードを管理するための手助けをします。今すぐ試してみて、サポート/レジスタンス分析の正確性がどれほどトレードを向上させるかを実感してください! 1. FX Levels がトレーダーにとって非常に有用な理由 非常に正確なサポート&レジスタンスゾーン • FX Levels は異なるブローカー環境でもほぼ同一のゾーンを生成するよう設計されており、データフィードの差異や時刻設定のずれによる不一致を解消します。 • つまり、どのブローカーを利用していても一貫したレベルが得られるため、戦
      Market Structure Patterns
      Samuel Manoel De Souza
      4.47 (19)
      Market Structure Patterns   is an indicator based on   smart money concepts   that displays   SMC/ICT   elements that can take your trading decisions to the next level. Take advantage of the   alerts ,   push notifications   and   email messages   to keep informed from when an element is formed on the chart, the price crosses a level and/or enters in a box/zone. Developers can access the values of the elements of the indicator using the   global variables  what allows the automation of trading
      トレンドラインプロ   市場の真の方向転換点を理解するのに役立ちます。この指標は、真のトレンド反転と主要プレーヤーが再び参入するポイントを示します。 分かりますか     BOSライン   複雑な設定や不要なノイズなしに、より長い時間足でのトレンドの変化と重要なレベルを把握できます。シグナルは再描画されず、バーが閉じた後もチャート上に残ります。 MT4バージョン   -   RFI LEVELS PRO インジケーター と組み合わせることで、その最大限の能力を発揮します インジケーターが示す内容: 本当の変化   トレンド(BOSライン) 一度シグナルが現れたら、それは有効です!これは、リペイント機能を持つインジケーターとの重要な違いです。リペイント機能を持つインジケーターは、シグナルを発した後、それを変更し、資金の損失につながる可能性があります。これにより、より高い確率と精度で市場に参入できます。また、矢印が現れた後、目標値(利益確定)に達するか、反転シグナルが現れるまで、ローソク足の色を変更する機能もあります。 繰り返しエントリ   主要プレーヤーの補充 エントリーポイントを探す
      作者のその他のプロダクト
      GS smart5
      Aleksander Gladkov
      5 (6)
      Best price Advanced grid algorithm,includes trend accounting, news, hedging and Risk manager. Can close the loss in case of market reversal and wait for the trend. For hedging, the following are used: Limit drawdown for Hedge zone parameter, pending orders and/or opening a position opposite to the loss. Can take into account not only the moment of news publication, but also the current accumulated index of the impact of news of a currency pair. Traders who purchase GS smart5 receive a persona
      Get news
      Aleksander Gladkov
      5 (1)
      Utility for reading news from investing.com To access the site, you need to add WebRequest in the Options terminal menu on the Expert Advisors tab: https://sslecal2.investing.com If reading is successful, a message about writing the file is displayed. The INV_week_this.txt file is written to the MQL4\Files folder of the terminal and is kept up to date, updating data according to its own timer. The  INV_week_last.txt   file is recorded on Saturday and saves the news data of the previous week .
      FREE
      The indicator calculates the current spread for each tick using the formula Spread=(ASK-BID)/Point. Schedule of changes in the boundaries spread over the timeframe displayed in a separate window from the date of accession of the indicator. Two lines corresponding to the minimum and maximum spread values are displayed. The indicator window is self-adjusted according to the minimum and maximum values from the moment of launch. The minimum and maximum values for the entire period of the indicator o
      FREE
      GS grid
      Aleksander Gladkov
      5 (4)
      Uses an advanced grid algorithm with no martingale or limited Martingale (default) (version for MT5: GS grid5 ) . Defines and control the current trend; It switches himself its parameters in accordance with the current market conditions ; Flexible customizable grid algorithm with or without martingale; Drawdown reduction algorithm (DD Reduction Algoritm); Hedge algorithm; Interactive trade control buttons; The ability to open / close orders manually; News filter to prevent trading during news
      GS target
      Aleksander Gladkov
      5 (2)
      The automatic adviser of the new generation with parameters: Target profit per month (10%, 25%, 50%, 75%, 100%) - choice of strategy Stop Loss Limit, USD Filter News Forex Factory (true, false) Parameters for setting the lot size Uses the news feed from Forex Factory to prevent trading during news releases. Set up to work on EURUSD timeframe M15. Works on USD accounts with a leverage from 1:500 and a Deposit from 500USD.   Enough for work: Decide on the size of the deposit that you can trust h
      GS smart
      Aleksander Gladkov
      5 (1)
      Best price, read GS smart channel ! Sale! Advanced grid algorithm,includes news and trend accounting and hedging. Can close the loss in case of market reversal and wait for the trend. For hedging, the following are used: Limit drawdown for Hedge zone parameter, pending orders and/or opening a position opposite to the loss. Can take into account not only the moment of news publication, but also the current accumulated index of the impact of news of a currency pair. Traders who purchase GS smar
      GS trendS is a trend indicator that can be used for any Forex financial instrument. The indicator does not redraw and does not lag. Recommended timeframe H1. It is possible to select the trend algorithm settings {Only Open, Average Open/Close, Average High/Low} The color indicates the direction of the trend: yellow - direction can be SELL or BUY (S_B) blue - uptrend (BUY) red - downward trend (SELL) The indicator panel displays trend values of 5 timeframes for the current price level. The va
      Composition of ATR and RSI indicators. The ATR RSI indicator compares two calculations of the ATR indicator with the Fast and Slow periods on one chart, plus the line of the average and the overbought and oversold zones of the RSI indicator. ATR shows the values of the volatility change in the currency pair in points, taking into account the period specified as a parameter. The entry points provided by the RSI indicator show a very good risk-reward ratio in volatile and trending markets. ATR RS
      ATR RSI x4
      Aleksander Gladkov
      The Expert Advisor implements a trading strategy based on overbought and oversold zones of ATR RSI i4 indicator signals, which is included in the code . Trend Following, Counter Trend system , DD reduction Algoritm and Level Trading algoritm are used. To start trading, simply attach the EA to the chart, preferably EURUSD H1 timeframe. Live results can be viewed here . To trade with the new Forex instrument (EURUSD H1 by default), it is recommended to set up the parameter values by testing, initi
      It will perfectly complement your working Expert Advisor or manual trading with up-to-date information. There is a sound notification of exceeding the established profit and loss limits of open SELL and BUY orders. Moreover, for each currency pair EURUSD, GBPUSD, XAUUSD, and others, various sound alerts are activated in English. Results are displayed on a special panel on the chart from the moment the indicator is activated: Elapsed time Fixed profit Current profit SELL Current profit BUY Maximu
      Trends and News
      Aleksander Gladkov
      5 (1)
      With the Trend and News indicator you will always be up to date : News + Trends + Forecast News Displayed on the chart as vertical lines with a description in the form of a tooltip The text displays two news: the previous published and the next expected They have filters: by importance (High, Medium, Low) and time period (Day, 4 days, Week) Full table of news for a given period (T button) Controlling the display of vertical lines on the chart and the sound signal before and after the publicati
      GS Trend5
      Aleksander Gladkov
      The advisor is designed for autonomous automatic round-the-clock trading on the EUR/USD pair, timeframe M15. There is a protection of the deposit from significant drawdown and a mode for saving a profitable transaction. Trades one deal. With the set parameters, it turns out to be one per day on average. How it works Uses the author's algorithm for analyzing three indicators and the direction of market movement to make a decision to open a deal. RSI Stochastic Bands market direction Opens an orde
      GS grid5
      Aleksander Gladkov
      F ully automated Expert Advisor using the advanced grid algorithm and constrained Martingale (MT4 version: GS grid ). Set up to work on EURUSD timeframe M15. Test 2021 shows a high percentage of winning orders: more than 98%. Works on HEDGING accounts with a leverage of 1:500 and a Deposit from 1000USD. Can use the news feed from Forex Factory to prevent trading during news release (Filter News Forex Factory=true;). To access the options terminal menu on the Expert Advisors tab, you must enable
      GS target5
      Aleksander Gladkov
      The revolutionary automatic adviser of the new generation with three parameters: Target profit per month (from 10% to 100%) Degree of risk (SuperLow, Low, Medium, High) Stop Loss Limit, USD Set up to work on EURUSD timeframe M15. Works on HEDGING accounts with a leverage of 1:500 and a Deposit from 500USD.   Enough for work: Decide on the size of the deposit that you can trust him Set the value of the desired profit per month (from 10 to 100 percent) Select the degree of risk (Low, Medium,
      It will perfectly complement your working Expert Advisor or manual trading with up-to-date information. There is a sound notification of exceeding the established profit and loss limits of open SELL and BUY orders. Moreover, for each currency pair EURUSD, GBPUSD, XAUUSD, and others, various sound alerts are activated in English. Indicators are displayed on a special panel on the chart from the moment the indicator is activated: Elapsed time Fixed profit Current profit Maximum drawdown Current d
      GS trade report
      Aleksander Gladkov
      5 (1)
      3 in 1 : Report + monitoring + sending messages (Telegram, ...) to optimize trading and use of advisors. Monitoring: Panel on the chart Sending messages to Telegram Sending messages to Email Sending Notifications Sending pop-up messages Sound notifications when the established Profit/Loss levels are exceeded Monitoring is activated by pressing the Start button. Profit for the period by currency pairs, hours and Magic number for the current account. Forms four tables: by symbols, by magic number
      A professional tool for real-time monitoring of the account status and the work of Expert Advisors. Information about the account status can be sent to Telegram chats automatically at a specified interval or upon request. From the screenshots of the open charts of the terminal, you receive upon request from your Telegram bot. Account information includes: 13:02 Trade monitoring by Telegram v.1.0 (headline) Account : 6802ххх RoboForex-Pro (account information) Profit start: 2661 USD (profit earne
      Uses the built-in news calendar of the MT5 terminal or the Investing.com website (in the latter case, the Get news5 utility is required) Has the Scale parameter={100%, 110%, 125%, ...} to adjust the comfortable size of the text and control elements Tells you in which direction it is safer to open positions 3 in 1: News + Trends + Forecast News for the selected period: current and in tabular form Actual trends for 5 customizable timeframes and trend reversal levels Forecast of exchange rate mo
      Multi-currency trading on one chart! Creation and management of positions with trailing and breakeven, risk management and other useful functions. To fix profits, the Target profit parameter is provided; if it is greater than zero, all positions will be closed if the set value is exceeded. All positions and orders have set Stop Loss and Take profit. For multi-currency trading, taking into account the impact of news and switching symbols on the chart, it is useful to use the News impact indicato
      Indicator of news linked to a bar. The published current value of the news has a characteristic impact on the currency it relates to: positive, negative, neutral . The indicator summarizes all these values for the selected period, taking into account the importance of the news: high, medium, low . As a result, a percentage is calculated for the currency pair, which shows the news of which currency is dominant. If the value is positive, then the pair has news pressure towards BUY, if negative - S
      Utility for reading news from investing.com To access the site, you need to add WebRequest in the Options terminal menu on the Expert Advisors tab: https://sslecal2.investing.com If reading is successful, a message about writing the file is displayed. The INV_week_this.txt file is written to the MQL5\Files folder of the terminal and is kept up to date, updating data according to its own timer. The  INV_week_last.txt   file is recorded on Saturday and saves the news data of the previous week .
      フィルタ:
      レビューなし
      レビューに返信