Key Level Analyzer

5

Key Level Analyzer – Know Better, Trade Smarter

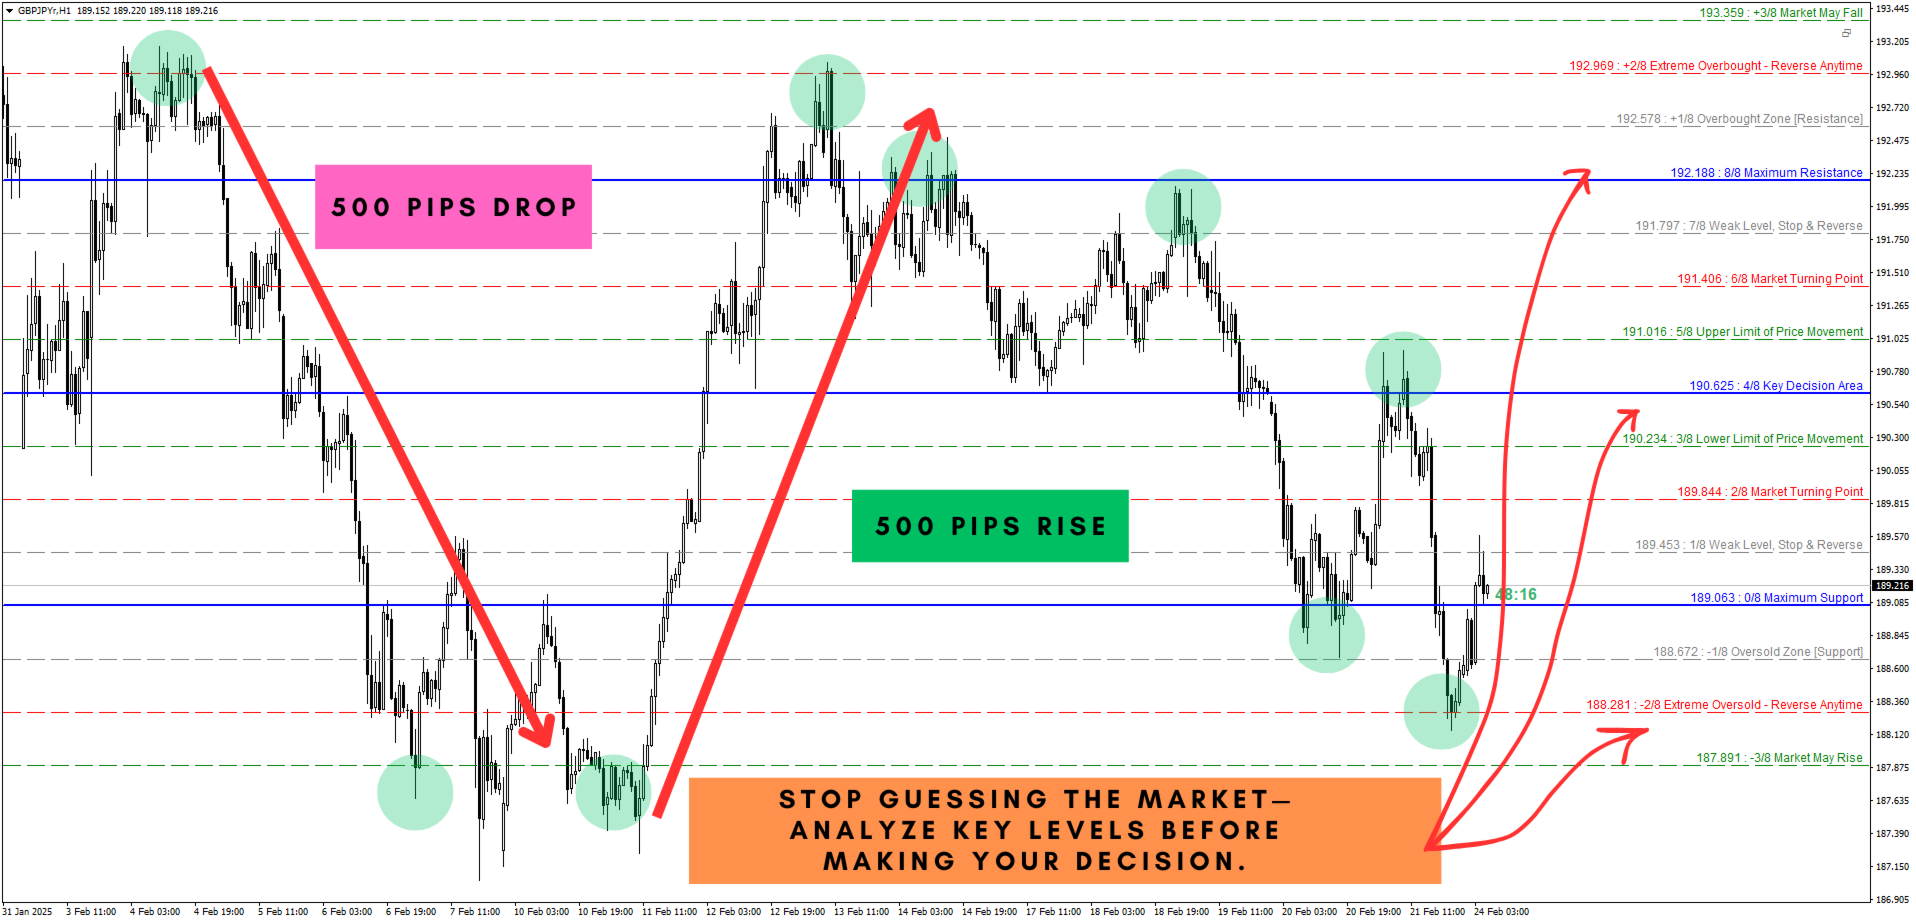
Key Level Analyzer is a powerful trading tool designed to provide precise market insights by identifying high-probability price zones, market turning points, and key decision areas. Unlike traditional indicators, it uses a smart algorithm to dynamically calculate support, resistance, and balance zones, helping traders make informed, data-driven decisions.

With real-time updates, multi-timeframe analysis, and a customizable alert system, Key Level Analyzer ensures traders stay ahead of the market without relying on guesswork.

1. Why Key Level Analyzer is Essential for Traders

  • Algorithm-Based Key Levels – Detects critical price zones where the market is most likely to reverse or continue its trend.
  • No Guesswork – Provides clear entry and exit points based on structured market data.
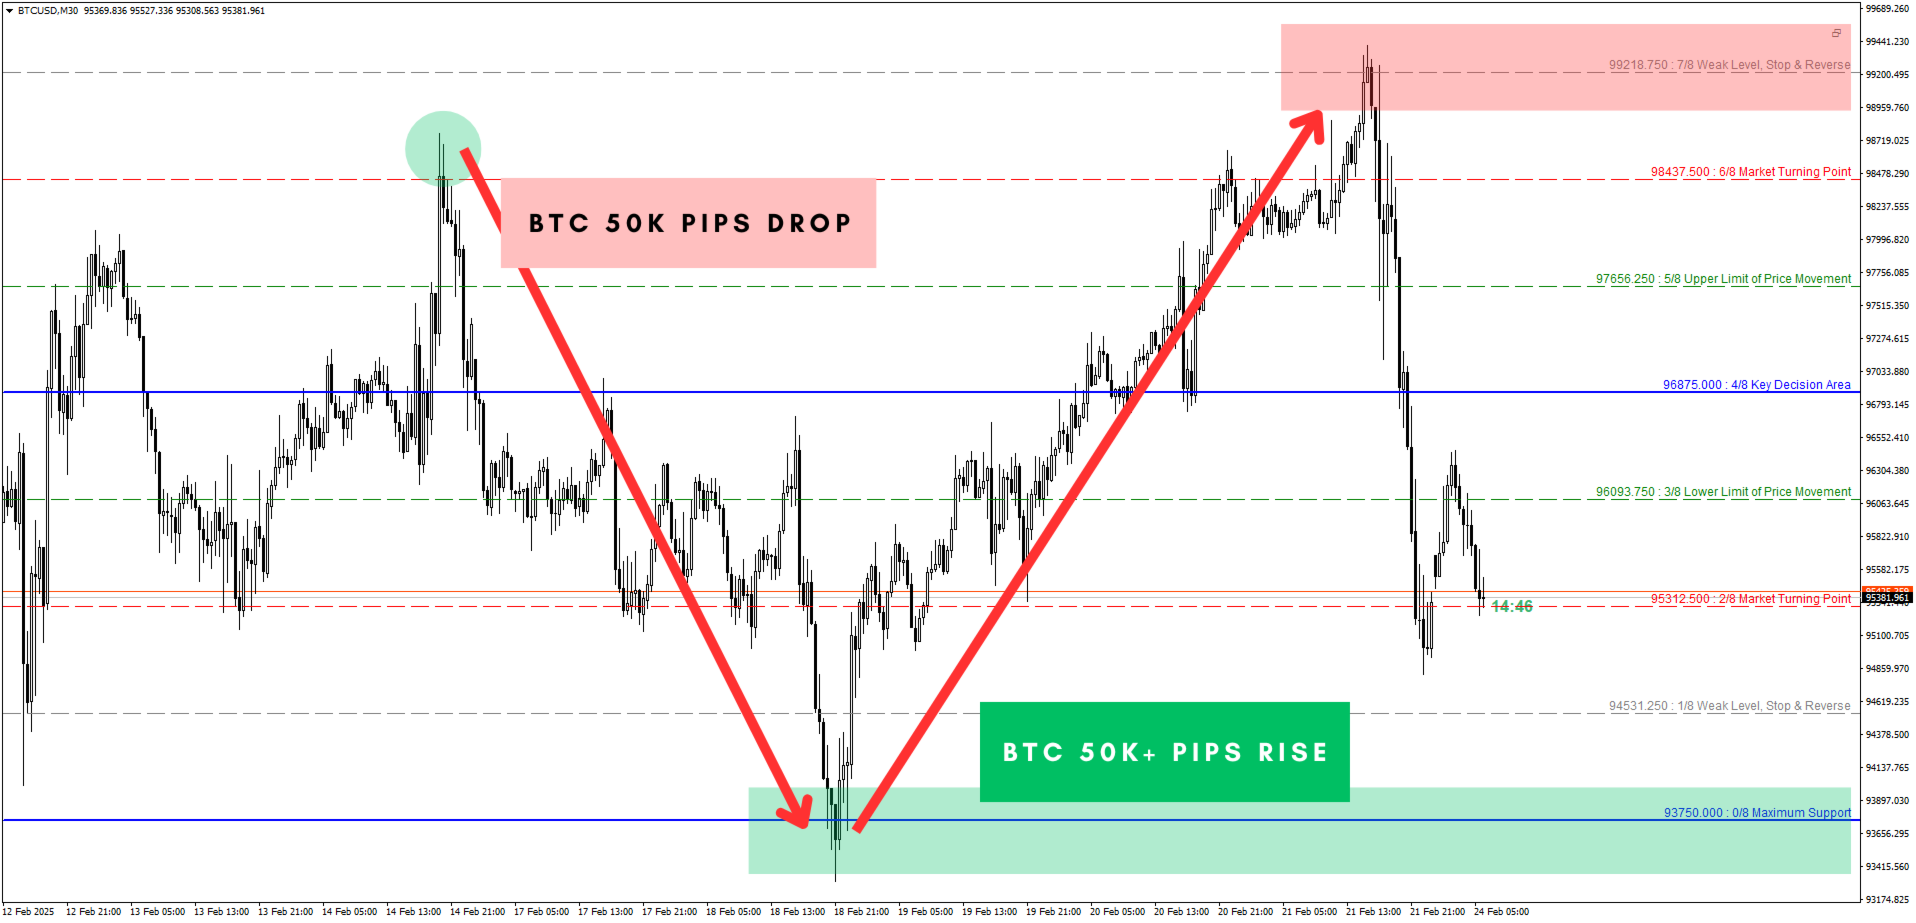
  • Works on Any Market – Effective for Forex, Stocks, Crypto, Commodities, and Indices.

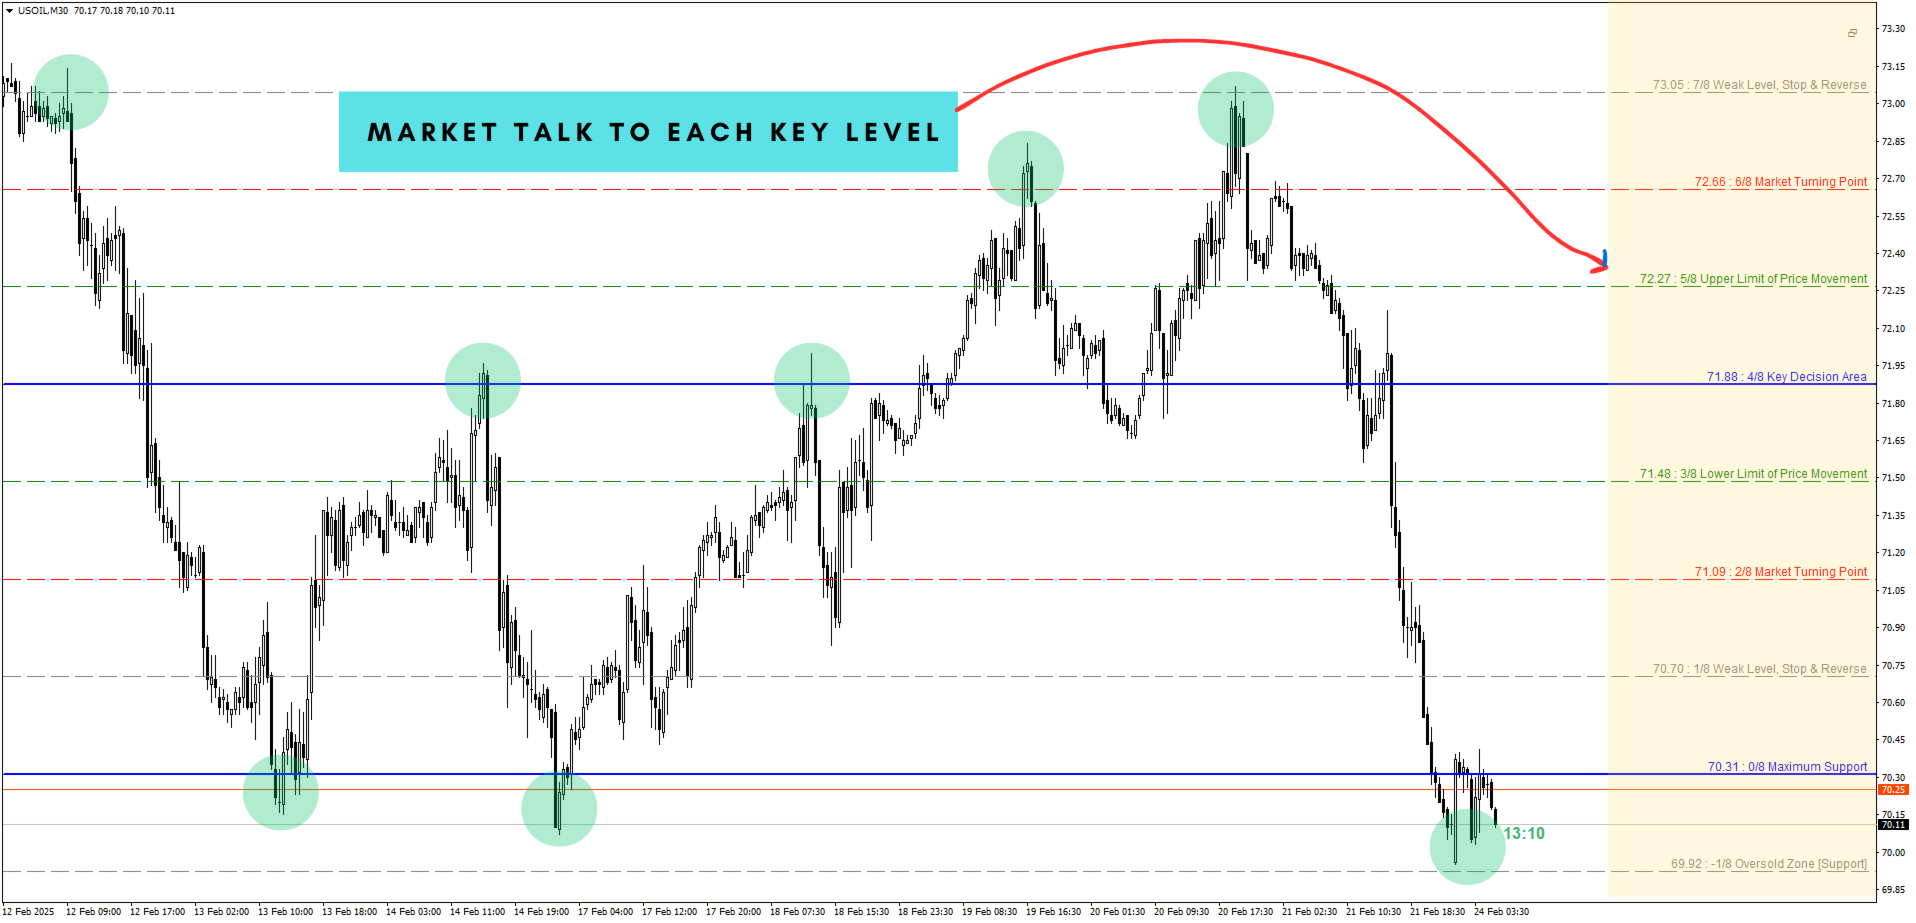
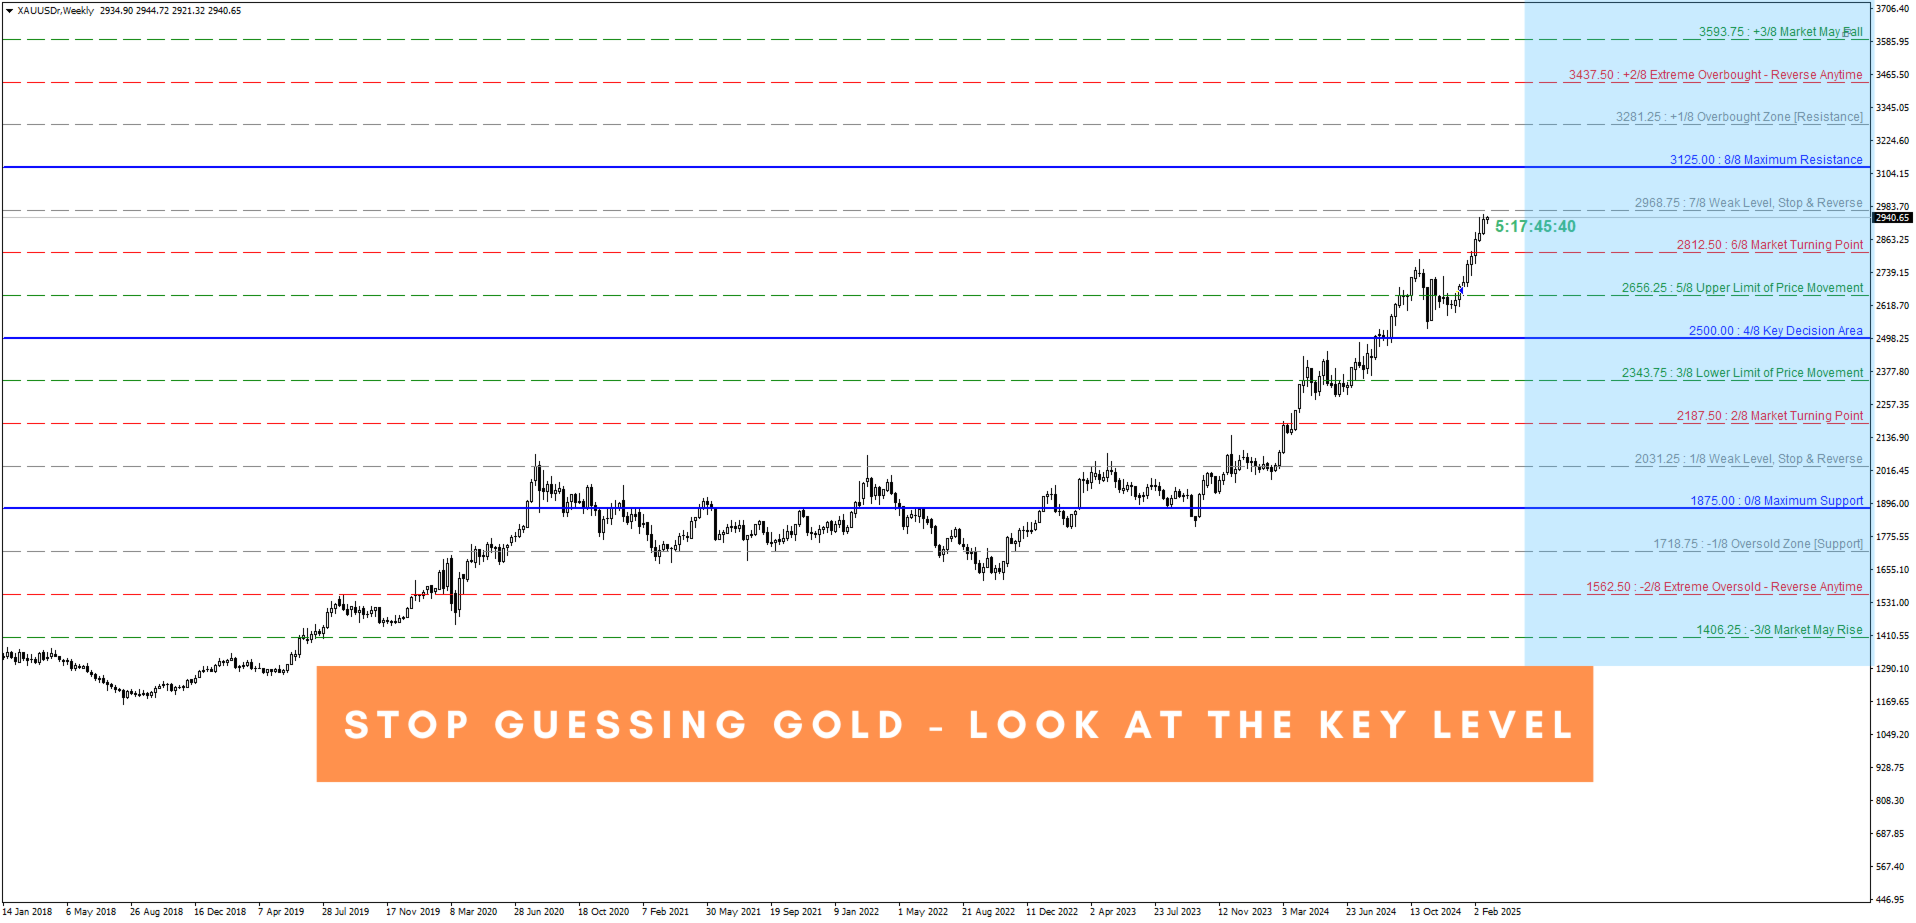
2. How Key Level Analyzer Works

Three Market Zones for Maximum Clarity

Key Level Analyzer categorizes the market into three zones, each covered by three key levels:

  1. Resistance Zone (Top Area)

    • Maximum Resistance
    • Overbought Conditions
    • Market Turning Points
  2. Balance Zone (Middle Area)

    • Key Decision Area
    • Upper & Lower Price Movement Limits
    • Weak Levels for Stop & Reverse
  3. Support Zone (Bottom Area)

    • Maximum Support
    • Oversold Conditions
    • Extreme Reversal Points

Each of these key levels helps traders determine whether price is likely to hold, reverse, or break through, making trade decisions more structured.

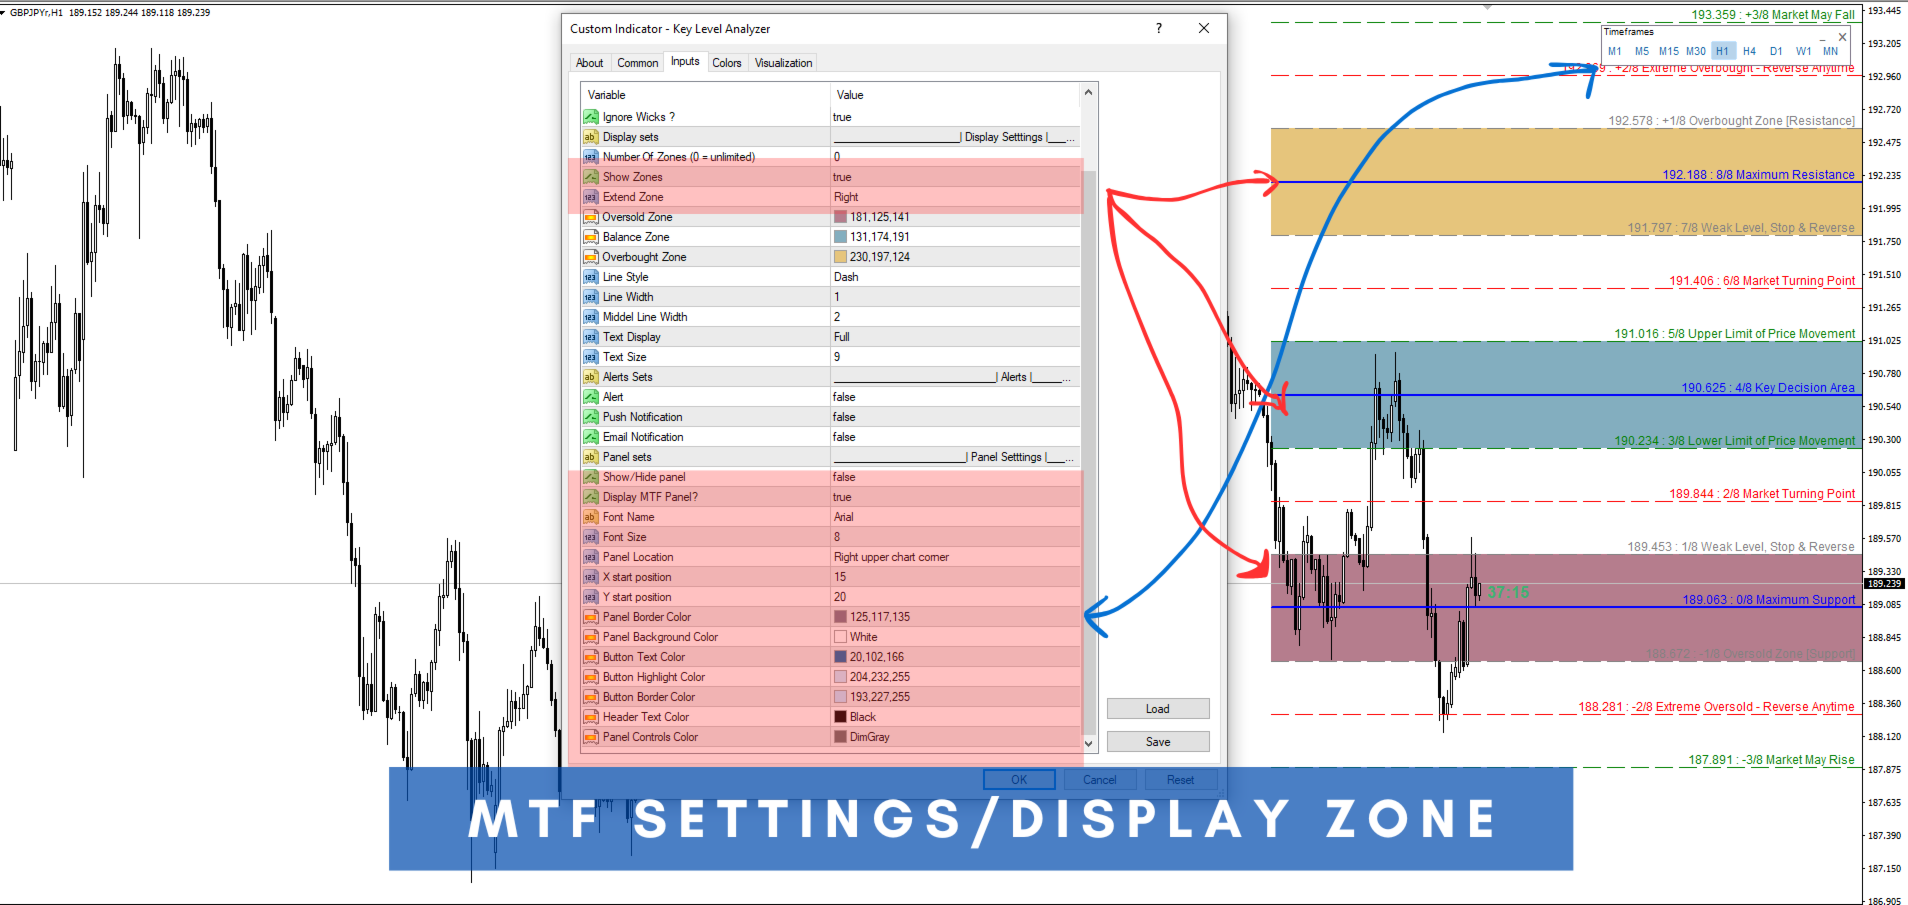
3. Multi-Timeframe Support & Real-Time Alerts

  • Multi-Timeframe Levels – Analyze key support and resistance zones across different timeframes (M1, M5, M15, M30, H1, H4, D1, W1).
  • Crossunder Alert System – Get notified when the price crosses under a key level, allowing you to react quickly to market shifts.
  • Adjustable Sensitivity – Fine-tune the indicator’s responsiveness to different market conditions.

4. Practical Trading Applications

Identify High-Probability Trades

  • Use the Resistance Zone to look for selling opportunities.
  • Use the Support Zone to find potential buy setups.
  • The Balance Zone acts as a decision area—confirm breakouts or trend continuation.

Enhance Risk Management

  • Align stop-loss and take-profit levels with precisely defined key zones.
  • Avoid entering trades at weak levels with low probability of success.

Adapt to Market Conditions

  • Spot trend reversals when price reaches extreme overbought or oversold conditions.
  • Confirm trend continuation using the upper and lower price movement limits.

5. How to Get Started

  1. Add Key Level Analyzer to Your Chart

    • Drag and drop the indicator onto any Forex, Stock, or Crypto chart.
  2. Customize the Indicator

    • Adjust settings for sensitivity, timeframe filters, and alerts to match your trading style.
  3. Follow Key Market Zones

    • Use the three-zone structure to guide trade entries and exits.
    • Enable alerts to track price movements in real-time.

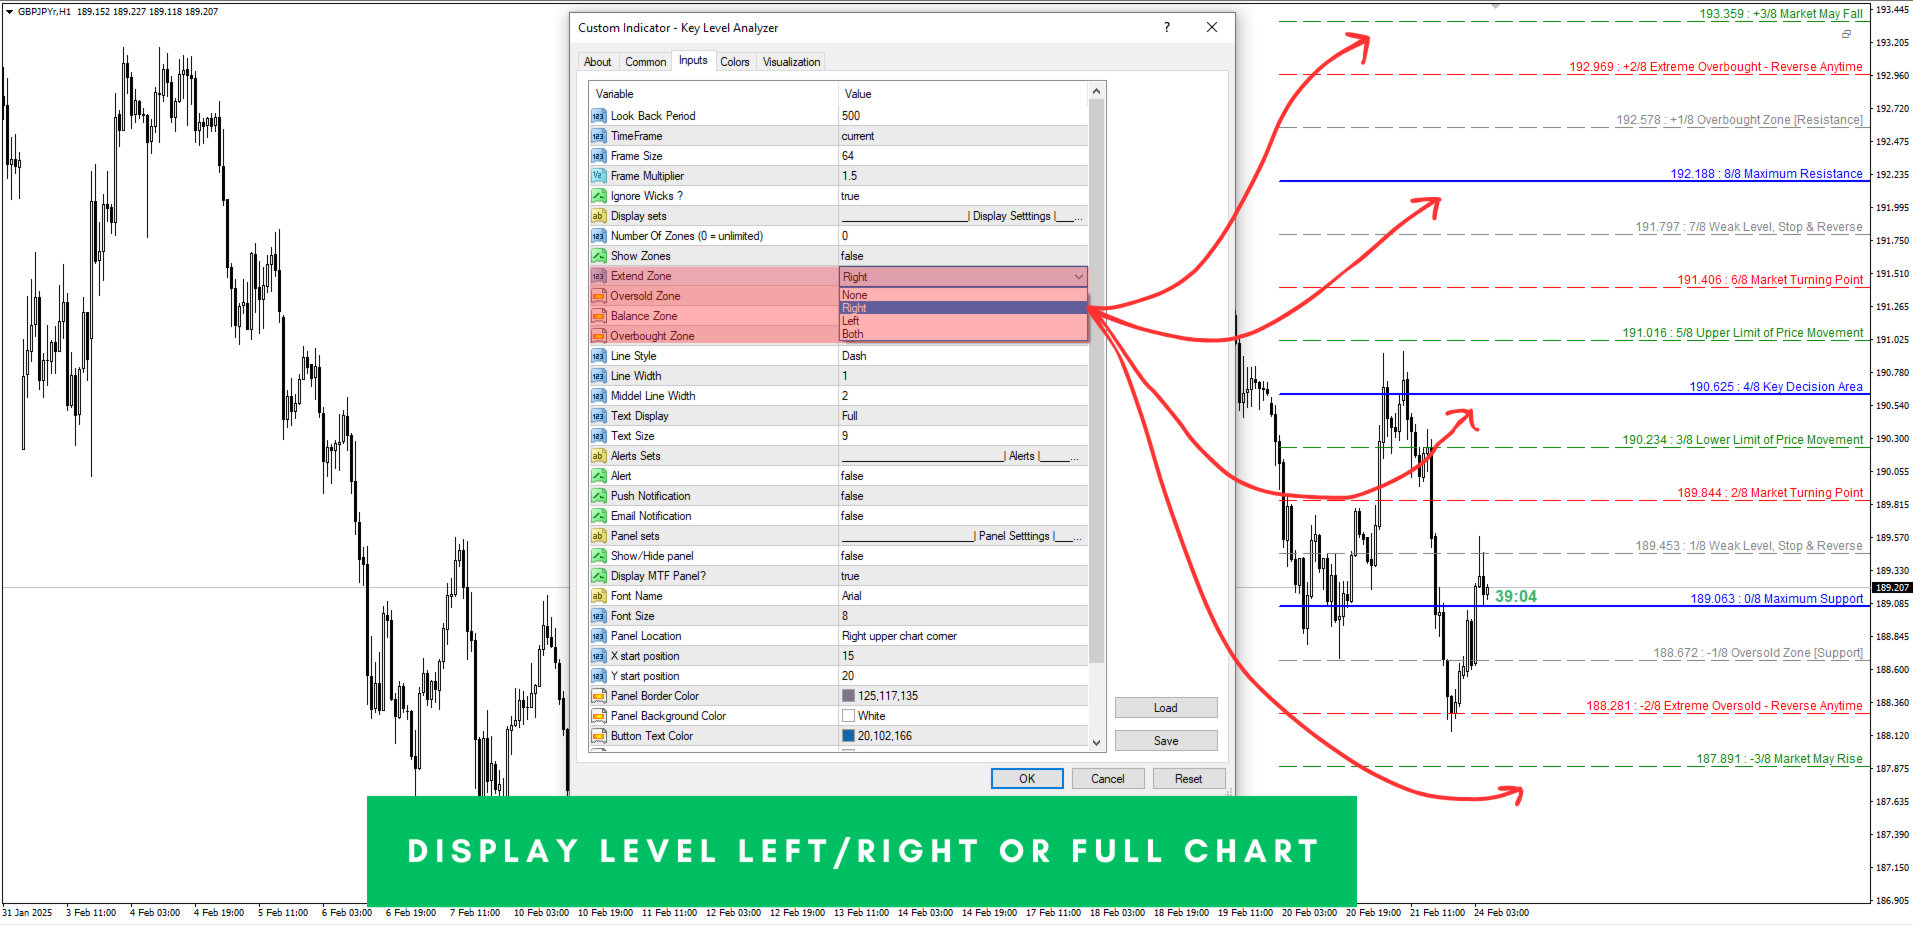
6. Key Level Analyzer Indicator Settings

  • Customizable Key Levels – Modify settings for resistance, balance, and support zones.
  • Multi-Timeframe Analysis – Select which timeframes to analyze simultaneously.
  • Crossunder Alert System – Set notifications for key level breaches.
  • Graphical Customization – Adjust colors and display options to match your trading preferences.

7. Support & Additional Resources

  • Dedicated Support – Assistance is available if you need help with installation or settings.

Upgrade Your Trading Strategy Today

  • Gain precise insights into key market levels.
  • Trade with data-driven confidence, not emotions.
  • Stay ahead with real-time alerts and multi-timeframe analysis.

Start using Key Level Analyzer now and take control of your trading decisions.


レビュー 2
Heiner G.
710
Heiner G. 2025.02.26 13:28 
 

This powerful indicator marks key price levels directly on the chart, providing valuable guidance for traders. I trade using the Smart Money Concept (SMC), and these levels are extremely helpful in clearly identifying potential entry points and target zones. By precisely visualizing important market areas, the indicator supports a structured trading strategy and helps make well-informed decisions. Additionally, the author is extremely helpful and clearly knows what he's talking about, making it even easier to understand and apply the indicator effectively.

おすすめのプロダクト
Quantum Falcon Signal Free is a smart visual trading indicator for MetaTrader 4 designed for Forex and Gold traders. The indicator combines: • Trend analysis • RSI momentum confirmation • MACD momentum filtering • ATR volatility filtering • Higher timeframe confirmation • Smart exit signal detection Main Features: • Smart Buy and Sell signals • Exit Buy / Exit Sell alerts • Real-time dashboard on chart • Professional candle arrows • Multi-timeframe trend confirmation • ATR market volatility filt
FREE
The Binary Profit Maker,  This indicator works on MT4 and is very easy to use. When you receive a signal from it, you wait for that candle with the signal to close and you enter your trade at the beginning of the next new candle . A Up Purple arrow means Buy and a Down Purple arrow means Sell. All arrows comes with Alert  like for easy identification of trade signal. Are you okay with that? How To Enter Trade? 1 minute candle 1 minute expire
The indicator shows the potential trend direction by cyclical-wave dependence. Thus, all the rays of the intersection will be optimal rays, in the direction of which the price is expected to move, taking into account the indicator period. Rays can be used as a direction for potential market movement. But we must not forget that the approach must be comprehensive, the indicator signals require additional information to enter the market.
Advanced Stochastic Scalper - is a professional indicator based on the popular Stochastic Oscillator. Advanced Stochastic Scalper is an oscillator with dynamic overbought and oversold levels, while in the standard Stochastic Oscillator, these levels are static and do not change. This allows Advanced Stochastic Scalper to adapt to the ever-changing market. When a buy or a sell signal appears, an arrow is drawn on the chart and an alert is triggered allowing you to open a position in a timely mann
Introducing the "Magic Trades" for MetaTrader 4 – your ultimate tool for precision trading in dynamic markets. This innovative indicator revolutionizes the way you perceive market trends by harnessing the power of advanced analysis to detect subtle changes in character, paving the way for optimal trading opportunities. The Magic Trades Indicator is designed to empower traders with insightful entry points and well-defined risk management levels. Through its sophisticated algorithm, this indicato
EARLY REMINDER: The Starting price is 65 price will rise soon up to 365$ and then 750$ after first 10 copies of sales. Grab this offer now! Introduction Hello, traders! Welcome to the demonstration of the Forex Beast Indicator , a comprehensive tool designed to assist aspiring traders in navigating the complexities of the forex market. This indicator incorporates seven essential components to provide a well-rounded trading experience: Moving Averages Colored Zones Support and Resistance Levels
The   Advanced Trend Scalper  indicator is designed to help both novices and professional traders. The indicator analyses the market and gives you buy and sell signals. It does not use any other indicators, it works only with the market actions. The signal appears right after the candle close and it does not repaint. The efficient algorithm provides a high degree of reliability of such signals.  Advanced Trend Scalpe r  for the MetaTrader 5 terminal :  https://www.mql5.com/en/market/product/3334
Trend PA
Mikhail Nazarenko
5 (3)
The Trend PA indicator uses   Price Action   and its own filtering algorithm to determine the trend. This approach helps to accurately determine entry points and the current trend on any timeframe. The indicator uses its own algorithm for analyzing price changes and Price Action. Which gives you the advantage of recognizing, without delay, a new nascent trend with fewer false positives. Trend filtering conditions can be selected in the settings individually for your trading style. The indicator
「Auto FIBO Pro」Crypto_Forex インジケーターは、取引の補助ツールとして最適です。 - インジケーターは、フィボナッチ レベルとローカル トレンド ライン (赤色) を自動的に計算してチャート上に配置します。 - フィボナッチ レベルは、価格が反転する可能性のある重要な領域を示します。 - 最も重要なレベルは、23.6%、38.2%、50%、61.8% です。 - リバーサル スキャルピングやゾーン グリッド取引に使用できます。 - Auto FIBO Pro インジケーターを使用して、現在のシステムを改善する機会も多数あります。 - Info Spread Swap Display があり、接続されている外国為替ペアの現在のスプレッドとスワップを表示します。 - ディスプレイには、アカウントの残高、エクイティ、マージンも表示されます。 - Info Spread Swap Display は、チャートのどのコーナーにも配置できます。 高品質のトレーディングロボットとインジケーターをご覧になるにはここをクリックしてください! これは、この MQL5 ウェブサイ
Lord Auto Fibonnaci is a free indicator for Meta Trader, in order to show the most famous chart in the financial market known as "Fibonnaci". As we can see in the images below, the fibonnaci table will automatically analyze the graph for you, with trend factors through percentage, almost infallible use, you can always work when the percentage is low or high, start shopping and sales on time, great for analyzing entries! In the images below we can see an example in gold in H4, where we are at
FREE
Order Block Tracker is here to solve one of the biggest challenges traders face: identifying order blocks. Many traders fail to spot these critical zones, often missing out on key market entries. But with Order Block Tracker , you no longer have to worry about that. This advanced indicator automatically highlights these crucial zones for you, giving you the confidence to enter the market at the right time. MT5 Version -  https://www.mql5.com/en/market/product/123362/ Key Features of Order Block
"Pattern 123" is an indicator-a trading system built on a popular pattern, pattern 123. This is the moment when we expect a reversal on the older trend and enter the continuation of the small trend, its 3rd impulse. The indicator displays signals and markings on an open chart. You can enable/disable graphical constructions in the settings. The indicator has a built-in notification system (email, mobile terminal, standard terminal alert). "Pattern 123" has a table that displays signals from sele
Noize Absorption Index - is the manual trading system that measures the difference of pressure between bears forces and bulls forces. Green line - is a noize free index that showing curent situation. Zero value of index shows totally choppy/flat market.Values above zero level shows how powerfull bullish wave is and values below zero measures bearish forces.Up arrow appears on bearish market when it's ready to reverse, dn arrow appears on weak bullish market, as a result of reverse expectation. S
Reliable Scalping Indicator
Oliver Gideon Amofa Appiah
4 (1)
RELIABLE SCALPING INDICATOR ( RSI ) As the name implies, this indicator gives reliable BUY and SELL signals on your chart. NO FANCY INDICATORS, NO MESSING WITH YOUR CHARTS. IT DOES NOTHING TO YOUR CHARTS EXCEPT TO SHOW ARROWS FOR BUYS AND SELLS. It DOES NOT repaint and has alerts and notifications which you can allow. It has chart notifications, mobile and email notifications and alerts. THIS INDICATOR PRODUCES ABOUT 85% ACCURATE SIGNALS WHICH IS VERY ENOUGH TO MAKE YOU PROFITABLE. RECOMMENDED
Introducing Order Blocks Breaker , a brand-new way to identify and leverage order blocks in your trading strategy. After developing multiple order block tools with unique concepts, I’m proud to present this tool that takes things to the next level. Unlike previous tools, Order Blocks Breaker not only identifies order blocks but also highlights Breaker Order Blocks —key areas where the price is likely to retest after a breakout. MT5 -  https://www.mql5.com/en/market/product/124102/ This tool inco
Your Good Friends — this is not just an indicator, but your reliable trading assistant, designed for traders who value simplicity, clarity, and stability. It combines the best classic methods of technical analysis — support and resistance levels, reversal signals, visual cues — and presents them in the clearest, most user-friendly format possible. Suitable for both beginners and experienced traders — especially those who want to eliminate chaos, reduce stress, and trade based on clear signals.
VR Cub
Vladimir Pastushak
VR Cub は、質の高いエントリーポイントを獲得するためのインジケーターです。このインジケーターは、数学的計算を容易にし、ポジションへのエントリーポイントの検索を簡素化するために開発されました。このインジケーターが作成されたトレーディング戦略は、長年にわたってその有効性が証明されてきました。取引戦略のシンプルさはその大きな利点であり、初心者のトレーダーでもうまく取引することができます。 VR Cub はポジション開始ポイントとテイクプロフィットとストップロスのターゲットレベルを計算し、効率と使いやすさを大幅に向上させます。取引の簡単なルールを理解するには、以下の戦略を使用した取引のスクリーンショットを見てください。 設定、設定ファイル、デモ版、説明書、問題解決方法は、以下から入手できます。 [ブログ] レビューを読んだり書いたりすることができます。 [リンク] のバージョン [MetaTrader 5] エントリーポイントの計算ルール ポジションをオープンする エントリーポイントを計算するには、VR Cub ツールを最後の高値から最後の安値までストレッチする必要があります。 最初
Super Reversal Pattern Indicator Unlock the power of advanced pattern recognition with our Super Reversal Pattern Indicator. Designed for traders seeking precision and reliability, this indicator identifies one of the most effective reversal patterns in technical analysis, offering a significant edge in your trading strategy. Key Features: Non-Repainting Accuracy: Enjoy the confidence of non-repainting technology. Once a Super Reversal Pattern is detected, it remains static, providing consiste
「ダイナミック・スキャルピング・オシレーター」は、MT4向けの高度なカスタムCrypto_Forexインジケーターです。効率的な取引ツールです! - 新世代のオシレーター - 使い方は画像をご覧ください。 - ダイナミック・スキャルピング・オシレーターは、適応型の売られ過ぎ/買われ過ぎゾーンを備えています。 - オシレーターは、動的な売られ過ぎ/買われ過ぎエリアから正確なエントリーポイントを見つけるための補助ツールです。 - 売られ過ぎ値:グリーンラインより下、買われ過ぎ値:オレンジラインより上。 - このインジケーターは、プライスアクションパターンと組み合わせるのに最適です。 - 標準的なオシレーターよりもはるかに正確です。対応時間枠:M30、H1、H4、D1、W1。 - PCとモバイルの両方でアラート機能付き。 高品質のトレーディングロボットとインジケーターをご覧になるにはここをクリックしてください! これは、このMQL5ウェブサイトでのみ提供されるオリジナル製品です。
Price Magnet — Price Density and Attraction Levels Indicator Price Magnet is a professional analytical tool designed to identify key support and resistance levels based on statistical Price Density. The indicator analyzes a specified historical period and detects price levels where the market spent the most time. These zones act as “magnets,” attracting price action or forming a structural base for potential reversals. Unlike traditional Volume Profile tools, Price Magnet focuses on price-time d
[ZhiBiCCI]インディケータは全てのサイクル使用に適しており、そして全ての市場品種にも適しています。 [ZhiBiCCI]緑色の実線は強気の発散の逆転です。緑色の点線は古典的な強気の発散です。 [ZhiBiCCI]赤への実線は逆弱気の発散である。赤い点線は古典的な弱気の発散です。 [ZhiBiCCI]はパラメータ(アラート、メール送信、通知送信)で設定でき、(true)に設定するとインスタント信号をアラームウィンドウに送信し、Eメール、インスタントメッセージを送信できます。 パラメータ設定の説明 [displayAlert]:これはアラームスイッチで、trueに設定され、矢印が表示されればプロンプトに自動的に警告され、falseに設定されれば警告されません。 [sendmail_NO_OFF]:これはメールを送信するためのスイッチで、trueに設定します。矢印が表示されていればMT4で設定したメールボックスにメールを送信し、falseに設定されていればメールを送信しません。 [sendnotification_NO_OFF]:これはインスタントメッセージを送信するた
Golding Trend: 100% does not repaint its signals. Designed specifically for Gold GOLD/XAUUSD Golding Trend is designed to identify the most relevant trends in the financial market. If you are looking for a tool that accurately predicts movements, Golding Trend is your ally. Trading with this indicator is very easy. We wait for a signal from the indicator and enter the transaction according to the arrow (Blue arrow - Buy, Red - Sell). No delays or redrawing: all signals are delivered in real t
Binary Options Support Resistance Indicator This indicator is designed for binary options trading and effectively shows retracements from support and resistance levels. Signals appear on the current candle. A red arrow pointing downwards indicates a potential selling opportunity, while a blue arrow pointing upwards suggests buying opportunities. All that needs adjustment is the color of the signal arrows. It is recommended to use it on the M1-M5 timeframes as signals are frequent on these timef
Credible Cross System   indicator is designed for signal trading. This indicator generates trend signals. It uses many algorithms and indicators to generate this signal. It tries to generate a signal from the points with the highest trend potential. The indicator works based on instant price movements. This indicator is a complete trading product. This indicator does not need any additional indicators. The indicator certainly does not repaint. The point at which the signal is given does not c
「調整可能なフラクタル」はフラクタル インジケーターの高度なバージョンで、非常に便利なトレーディング ツールです。 - ご存知のとおり、標準フラクタル MT4   インジケーターには設定がまったくありません。これはトレーダーにとって非常に不便です。 - 調整可能なフラクタルは、この問題を解決しました。必要な設定がすべて揃っています。 - インジケーターの調整可能な期間 (推奨値 - 7 以上)。 - 価格の高値/安値からの距離を調整可能。 - フラクタル矢印のデザインを調整可能。 - インジケーターにはモバイルおよび PC アラートが組み込まれています。 高品質のトレーディングロボットとインジケーターをご覧になるにはここをクリックしてください! これは、この MQL5 Web サイトでのみ提供されるオリジナル製品です。
Heiken Ashi candle chart is an improved version of The Japanese candle chart, which can effectively filter the market "noise" of the Japanese candle chart. It is favored by many traders for its simplicity and intuition. For trend traders, the HA candle chart is a magic tool. Unlike the traditional Japanese candle chart, Heikenashi does not reflect the opening price, high price, low price and closing price of the market. Instead, Heikenashi calculates the value of a single K line in the dominant
SMC Venom Model BPR インジケーターは、スマート マネー (SMC) コンセプトで取引するトレーダー向けのプロフェッショナル ツールです。価格チャート上の 2 つの主要なパターンを自動的に識別します。 FVG   (フェアバリューギャップ) は、3 本のローソク足の組み合わせで、最初のローソク足と 3 番目のローソク足の間にギャップがあります。ボリュームサポートのないレベル間のゾーンを形成し、価格修正につながることがよくあります。 BPR   (バランス価格範囲) は、2 つの FVG パターンの組み合わせで、「ブリッジ」を形成します。これは、価格がボリュームアクティビティの少ない動きで動くときに、ブレイクアウトしてレベルに戻るゾーンで、ローソク足の間にギャップを作成します。 これらのパターンは、大規模な市場プレーヤーと一般参加者の相互作用が発生するチャート上のボリュームと価格動向の分析に基づいて、トレーダーが主要なサポート/レジスタンス レベル、ブレイクアウト ゾーン、エントリ ポイントを識別するのに役立ちます。 インジケーターは、長方形と矢印の形でパターンを視
Indicateur Crypto_Forex « HTF Moving Averages Cross » pour MT4. - Améliorez vos méthodes de trading avec le puissant indicateur HTF Moving Averages Cross pour MT4. HTF signifie « période de temps supérieure ». - Cet indicateur est idéal pour les traders de tendance avec des entrées d'action de prix. - Il vous permet d'associer des moyennes mobiles rapides et lentes d'une période de temps supérieure à votre graphique actuel - une méthode professionnelle. - HTF Moving Averages Cross intègre des
Embark on the pinnacle of Binary Options evolution. Our indicator isn't just adaptive—it's relentless. Picture a ninja riding a serpent, shadowing its every move; that's how this tool trails the market trend, unwavering till the end. Built upon the foundational prowess of the Ichimoku indicator and honed with an array of fine-tuned oscillators, it epitomizes accuracy and precision. Dive deep without getting lost in the Ichimoku's intricacies—our indicator simplifies the process for you. Perhaps
M5 タイムフレームのロボット スカルパー。 GBPUSD 通貨ペアでの取引。このロボットは、英ポンドの取引のためにプロのトレーダーの会社によって特別に開発されました。ロボットは、毎日約 5 ~ 15 の取引を開始します。 GBPUSD のスプレッドが最大 10 ピップスまでの低いブローカーと取引するのが最善です。開始するための推奨最低入金額は $500 以上です。 利点: マーチンゲールは使いません。 ネットではありません。 すべての取引にはストップロスがあります。 GBPUSDペア専用のプロボット。 ロボットスキャルパー、M5 期間の日中取引。 このロボットはどのように取引しますか? 市場を分析するために、ロボットは 2 つの指標の価格モデルと戦略的な市場パターンを使用します: パラボリック ストップとリバース システムとボリンジャー バンド。ロボットは最初に、価格エントラポレーション統計を使用して価格の動きについて市場を分析します。次に、ロボットはこれらの指標を読み取り、現在と過去の動きの傾向を比較します。市場の反転またはロールバックを示すパターンが一致した場合、ロボットは取
このプロダクトを購入した人は以下も購入しています
Neuro Poseidon is a new indicator by Daria Rezueva. It combines precise trading signals with adaptive TP/SL levels - creating best possible trades as a result! Message me and get  Neuro Poseidon Assistant  as a gift to automize your trading process! What makes it stand out? 1. Proven profitability on all assets and timeframes 2. Only confirmed BUY and SELL signals present on the chart 3. Adaptive TP & SL levels generated by the software for each trade 4. Easy to understand - suitable for all
Gann Made Easy は、ミスター・ギャンの理論を使用した取引の最良の原則に基づいた、プロフェッショナルで使いやすい外国為替取引システムです。 W・D・ガン。このインジケーターは、ストップロスとテイクプロフィットレベルを含む正確な買いと売りのシグナルを提供します。 PUSH通知を利用して外出先でも取引可能です。 ご購入後、取引方法の説明と優れた追加インジケーターを無料で入手するには、私にご連絡ください! おそらく、ギャンの取引手法についてはすでに何度も聞いたことがあるでしょう。通常、ギャンの理論は初心者のトレーダーだけでなく、すでにある程度の取引経験がある人にとっても非常に複雑なものです。なぜなら、ギャンの取引手法は理論的にはそれほど簡単に適用できるものではないからです。私はその知識を磨き、最良の原則を私の外国為替インジケーターに組み込むために数年を費やしました。 このインジケーターは非常に簡単に適用できます。必要なのは、それをチャートに添付し、簡単な取引推奨事項に従うだけです。このインジケーターは常に市場分析の仕事を行い、取引の機会を探します。適切なエントリーポイントを検出す
Scalper Inside PRO Scalper Inside PRO は、MetaTrader 4 向けの短期トレンドおよびスキャルピング用インジケーターです。独自アルゴリズムを用いて、市場の方向性と主要なターゲットレベルを素早く検出します。エントリー、イグジット、複数の利確ターゲットを自動計算し、詳細なパフォーマンス統計を表示することで、さまざまな銘柄やストラテジーがどのように機能してきたかを確認できます。これにより、現在のマーケットコンディションに最も適した取引銘柄を選択するのに役立ちます。さらに、Scalper Inside PRO には、お使いの矢印インジケーターを簡単に接続でき、その統計と過去のパフォーマンスを素早く評価できます。 本インジケーターは、あらゆる銘柄と時間足で動作し(短期トレードには M5 を推奨)、複数の内蔵ストラテジーを備えています。そのため、単体のスキャルピングツールとしても、トレーディングシステム内の強力な分析コンポーネントとしても活用できます。 主な機能 独自アルゴリズム(Next‑Generation Trend Detection Algor
Dynamic Forex28 Navigator - 次世代の Forex 取引ツール。 現在 49% オフ。 Dynamic Forex28 Navigator は、長年人気のインジケーターを進化させたもので、3 つの機能を 1 つにまとめています。 Advanced Currency Strength28 インジケーター (レビュー 695 件)  + Advanced Currency IMPULSE with ALERT (レビュー 520 件) + CS28 コンボ シグナル (ボーナス)。 インジケーターの詳細 https://www.mql5.com/en/blogs/post/758844 次世代の Strength インジケーターが提供するもの  オリジナルで気に入っていたすべての機能が、新機能と精度の向上によって強化されました。 主な機能: 独自の通貨強度計算式。 すべての時間枠でスムーズかつ正確な強度ライン。 トレンドの特定と正確なエントリーに最適です。 ダイナミックマーケットフィボナッチレベル (マーケットフィボナッチ)。 このインジケーターに固有
PRO Renko Systemは、特別にRENKOチャートを取引するために設計された高精度の取引システムです。 これは、様々な取引商品に適用することができる普遍的なシステムです。 システムは効果的に正確な逆転信号へのアクセスを与えるいわゆる市場の騒音を中和する。 表示器は非常に使いやすく、信号の生成に責任がある1つの変数だけがあります。 あなたは簡単にお好みの任意の取引ツールとレンコバーのサイズにツールを適応させることができます。 私はいつもあなたが私のソフトウェアで収益性の高い取引を支援するために余分なサポートを提供する準備ができています! 私はあなたに幸せで収益性の高い取引をしたいです! ご購入後にご連絡ください! 私はあなたに私のレンコチャートジェネレータを送信します。 私はまた、私の個人的な推奨事項やシステムの他のモジュールを無料で共有します!
Enigmera
Ivan Stefanov
5 (8)
ENIGMERA: 市場の中心 重要:MQL5.comのデモはStrategy Testerで実行されており、Enigmeraの機能を完全には反映していない場合があります。詳細については、説明、スクリーンショット、ビデオをご確認ください。質問があれば、遠慮なくメッセージを送ってください! インジケーターのコードは完全に書き直されました。バージョン3.0は新機能を追加し、インジケーターの開始以来蓄積されたバグを修正しました。 紹介 このインジケーターとトレーディングシステムは、金融市場への注目すべきアプローチです。ENIGMERAはフラクタルサイクルを使用して、サポートとレジスタンスのレベルを正確に計算します。真の蓄積フェーズを示し、方向と目標を提供します。トレンドでも修正でも機能するシステムです。 動作方法 インジケーターのほとんどの機能は、チャートの左側にあるボタンで制御され、市場の状況に迅速に対応できるようになっています。 ボタン ON/OFF – インジケーター全体を表示または非表示にします。 Channel – サポートチャネルを有効にし、許容範囲の偏差を示します。 Dev
トレンドラインプロ   市場の真の方向転換点を理解するのに役立ちます。この指標は、真のトレンド反転と主要プレーヤーが再び参入するポイントを示します。 分かりますか     BOSライン   複雑な設定や不要なノイズなしに、より長い時間足でのトレンドの変化と重要なレベルを把握できます。シグナルは再描画されず、バーが閉じた後もチャート上に残ります。 VERSION MT 5     -     RFI LEVELS PRO インジケーター と組み合わせることで、その潜在能力を最大限に発揮します。 インジケーターが示す内容: 本当の変化   トレンド(BOSライン) 一度シグナルが現れたら、それは有効です!これは、リペイント機能を持つインジケーターとの重要な違いです。リペイント機能を持つインジケーターは、シグナルを発した後、それを変更し、資金の損失につながる可能性があります。これにより、より高い確率と精度で市場に参入できます。また、矢印が現れた後、目標値(利益確定)に達するか、反転シグナルが現れるまで、ローソク足の色を変更する機能もあります。 繰り返しエントリ       主要プレーヤーの
多くの矢印インジケーターは、シグナルだけを表示して、その後の判断はすべてトレーダー任せです。KT Alpha Hunter Arrows は、最初から完成されたトレードプランを提供します。 各シグナル矢印が表示されると、エントリーライン、ストップロス、4つのテイクプロフィット水準、そして現在の銘柄と時間足を今トレードする価値があるかを示すリアルタイムのエッジ判定が、チャート上にまとめて描画されます。付属の Trade Manager EA は、手動でエントリーした後の管理をサポートし、相場が荒れて感情が揺れやすい場面でも、トレードの規律を保ちやすくします。リペイントなし。確定足のみでシグナルを表示。Forex、ゴールド、指数、その他あなたが取引するあらゆる銘柄向けに設計されています。 主な機能 リペイントしない買い・売り矢印。シグナルは足が確定した後にのみ表示されます。 各シグナルにエントリーライン、構造的なストップロス、4つのテイクプロフィット水準を表示。 Edge Dashboard が、現在のチャート上で買いと売りのセットアップを個別に評価。 判定システム:No Edge、Ma
Trend Catcher ind
Ramil Minniakhmetov
5 (1)
トレンドキャッチャーインジケーター トレンドキャッチャーインジケーターは、開発者独自の適応型トレンド分析指標を組み合わせることで、市場価格の動きを分析します。短期的なノイズを除去し、根底にあるモメンタムの強さ、ボラティリティの拡大、価格構造の挙動に焦点を当てることで、真の市場方向性を特定します。また、移動平均線、RSI、ボラティリティフィルターなどの平滑化およびトレンドフィルタリング機能を備えたカスタマイズ指標も使用します。 実際の運用状況のモニタリングやその他の製品については、こちらをご覧ください: https://www.mql5.com/en/users/mechanic/seller ご注意ください。私はTelegramでEAや設定を販売していません。詐欺です。すべての設定はブログで無料で公開しています。 重要!ご購入後すぐにご連絡ください。手順とボーナスをお送りします!
このインジケーターは実践的なトレードに最適な自動波動分析のインジケーターです! 場合... 注:   Tang Lun (Tang Zhong Shuo Zen) の命名規則の影響で、私は波のグレーディングに西洋の名前を使用することに慣れていません。基本的な波を ペン 、二次波のバンドを セグメント と名付けました。同時に、 セグメント にはトレンドの方向が指定されます (この命名方法は将来のノートで使用されます。最初に言っておきます)。ただし、アルゴリズムは曲がりくねった理論とはほとんど関係がないため、付けるべきではありません。これは、私の市場分析 によって要約された、絶えず変化する複雑な運用ルール を反映しています。 バンドは標準化され、人によって異なることがないよう定義されており、市場参入を厳密に分析する上で重要な役割を果たす人為的な干渉の描画方法が排除されています。 このインジケーターを使用することは、取引インターフェイスの美しさを改善することと同等であり、元の K ライン取引を放棄し、取引の新しいレベルに連れて行きます。また、宣伝の観点から顧客の認識も向上します。 イ
Genesis Matrix Pro is a professional multi-timeframe trend detection indicator designed to help traders identify high-quality market alignment with clarity and structure. It combines 12 different technical indicators into one visual alignment matrix, allowing traders to quickly see when market conditions are bullish, bearish, or neutral. A signal is generated only when the selected strategies are aligned, helping reduce noise and improve decision-making. PLEASE CONTACT ME AFTER PURCHASE TO GET
この製品は 2026 年の市場向けに更新され、最新の MT5 ビルドに最適化されています。 価格更新のお知らせ: Smart Trend Trading System は現在 $99 で提供されています。 次の 30 件の購入 後、価格は $199 に上がります。 特別オファー: Smart Trend Trading System を購入後、私にプライベートメッセージを送ることで、 Smart Universal EA を無料 で受け取り、Smart Trend のシグナルを自動売買に変えることができます。 Smart Trend Trading System は、リペイントなし、再描画なし、遅延なしの完全なトレーディングシステムです。よりクリーンなシグナル、より明確なトレンド方向、そしてより整理された取引方法を求めるトレーダー向けに作られています。 Online course , manual and download presets . このシステムは、トレンド検出、反転ゾーン、Smart Cloud、トレーリングストップロジック、サポートとレジスタンス、ローソク足の色分け、ア
トレンドトレーディング は、タイミングのプルバックとブレイクアウトにより、市場で起こっているトレンドから可能な限り利益を得るように設計された指標です。確立されたトレンドの中で価格が何をしているかを分析することにより、取引の機会を見つけます。 [ インストールガイド | 更新ガイド | トラブルシューティング | よくある質問 | すべての製品 ] 自信を持って効率的に金融市場を取引する むち打ちにならずに確立されたトレンドから利益を得る 収益性の高いプルバック、ブレイクアウト、早期の逆転を認識する この指標は、独自の品質とパフォーマンスを分析します 複数時間枠のダッシュボードを実装します インジケーターは再描画されていません 電子メール/音声/視覚アラートを実装します 確立されたトレンドは多くの取引機会を提供しますが、ほとんどのトレンド指標はそれらを完全に無視しています。インジケーターの解釈はかなり簡単です: (1) トレンドの変化 (2) トレンドの方向への後退 (3) トレンドの方向へのブレイクアウト 赤いダッシュ は下降トレンド中の修正です 青いダッシュ は上昇トレンド中
Step into the world of Forex trading with confidence, clarity, and precision using   Gold Indicator   a next-generation tool engineered to take your trading performance to the next level. Whether you’re a seasoned professional or just beginning your journey in the currency markets, Gold Indicator equips you with powerful insights and help you trade smarter, not harder. Built on the proven synergy of three advanced indicators, Gold Indicator focuses exclusively on medium and long-term trends eli
MetaBands M4
Vahidreza Heidar Gholami
3.5 (6)
MetaBandsは、強力でユニークなアルゴリズムを使用してチャンネルを描画し、トレンドを検出して、トレーダーに取引の入出ポイントを提供することができます。チャンネル指標に加えて、強力なトレンド指標でもあります。入力パラメータを使用して新しいチャンネルを作成するために、異なるタイプのチャンネルを統合することができます。MetaBandsは、市場のイベントについてユーザーに通知するために、すべてのタイプのアラートを使用します。 特徴 ほとんどのチャンネルアルゴリズムをサポート 強力なトレンド検出アルゴリズム 異なるタイプのチャンネルを統合する能力 マルチタイムフレームおよびマルチカレンシー(シグナルマトリックス) すべてのタイプのアラート機能(サウンド、画面フラッシャー、プッシュ通知、メール、ポップアップ、矢印) 再描画しない トレンド検出 MetaBandsは、チャネル内を振動する青いラインを使用してトレンドを検出します。ラインがチャネルの上部バンドに達すると、下降トレンドの開始を示し、下部バンドに達すると上昇トレンドの開始を示します。青いラインが中心ラインに近づくと、市場はコンソリ
スイングトレーディング は、トレンドの方向のスイングと可能な反転スイングを検出するように設計された最初のインジケーターです。トレーディングの文献で広く説明されているベースラインスイングトレーディングアプローチを使用します。インディケータは、いくつかの価格と時間のベクトルを調査して、全体的なトレンドの方向を追跡し、市場が売られ過ぎまたは買われ過ぎて修正の準備ができている状況を検出します。 [ インストールガイド | 更新ガイド | トラブルシューティング | よくある質問 | すべての製品 ] むち打ちを起こさずに市場スイングの利益 インジケーターは常にトレンドの方向を表示します 色付きの価格帯は機会のベースラインを表します 色付きのダッシュは、可能な反転スイングを表します この指標は、独自の品質とパフォーマンスを分析します 複数時間枠のダッシュボードを実装します カスタマイズ可能なトレンドおよびスイング期間 電子メール/サウンド/プッシュアラートを実装します インジケータは再描画またはバックペインティングではありません Swing Tradingとは Swing Tradingは
Current event:  https://c.mql5.com/1/326/A2SR2025_NoMusic.gif A. A2SR とは何ですか ?   * 先行テクニカル指標です (塗り直しなし、ラグなし)。 -- ガイダンス : -- https://www.mql5.com/en/blogs/post/734748/page4#comment_16532516 -- そして https://www.mql5.com/en/users/yohana/blog A2SR には、サポート (需要) とレジスタンス (供給) のレベルを決定する特別な手法があります。 ネットで見かける通常の方法とは異なり、A2SR は実際の SR レベルを決定する独自のコンセプトを持っています。 元の手法はインターネットから取得されたものではなく、インターネット上で公開されたこともありません。 A2SR は、取引スタイルに応じて SR レベルを自動選択します。 時間枠を変更しても、SR レベルはその位置にとどまります。 実際のSRは、使用する時間枠から取得されるわけではないため. A2SR
M30/H1/H4スイング版もあります M5/M15では取りきれない大きな波を狙いたい方へ。 Gold Signal Swing Pro(M30/H1/H4対応)を販売中。 1トレードで$20〜$80+の値幅を狙う。 https://www.mql5.com/en/market/product/177643 KURAMA GOLD SIGNAL PRO(MT4版)— 7層フィルター・自動TP/SL・品質スコア搭載 XAUUSD完全トレードシステム リペイントなし。リドローなし。ラグなし。すべてのサインは確定後に変わりません。見たままが結果です。 特典:買い切りライセンスをご購入いただいた方に、AI Zone Radar($59相当)+PDFマニュアルを無料プレゼント。購入後にMQL5でメッセージをお送りください。 AI Zone Radar: https://www.mql5.com/en/market/product/175834 トレーダーから信頼されています:ゴールドトレーダーのコミュニ
BTMM State Engine Pro is a MetaTrader 4 indicator for traders who use the Beat The Market Maker approach: Asian session context, kill zone timing, level progression, peak formation detection, and a multi-pair scanner from a single chart. It combines cycle state logic with a built-in scanner dashboard so you do not need the same tool on many charts at once. What it does Draws the Asian session range; session times can follow broker server offset or be set in inputs. Tracks level progression (L
「 Dynamic Scalper System 」インジケーターは、トレンド波の中でスキャルピング取引を行う手法のために設計されています。 主要通貨ペアと金でテスト済みで、他の取引商品との互換性があります。 トレンドに沿った短期的なポジションオープンのシグナルを提供し、追加の価格変動サポートも提供します。 インジケーターの原理 大きな矢印はトレンドの方向を決定します。 トレンド波の中では、小さな矢印の形でスキャルピングシグナルを生成するアルゴリズムが機能します。 赤い矢印は強気方向、青い矢印は弱気方向です。 トレンドの方向には敏感な価格変動ラインが描かれ、小さな矢印のシグナルと連動します。 シグナルは次のように機能します。適切なタイミングでラインが現れるとエントリーシグナルが形成され、ラインが開いている間はポジションが保持され、完了すると取引が終了します。 推奨される動作時間枠はM1~H4です。 矢印は現在のローソク足に形成され、次のローソク足が開いている場合は、前のローソク足の矢印は再描画されません。 入力パラメータ Trend Wave Period - トレンド方向
Price & Time Market Structure Indicator A professional market structure tool that analyzes waves through both price and time — not price alone. Main Description NeoWave PRO is a professional market structure indicator for MetaTrader 4 designed for traders who want to move beyond traditional one-dimensional wave tools such as ZigZag, swing indicators, and basic high/low systems. Most wave indicators analyze only one thing: Price. But a real market wave is not only a price movement. A true wave de
Quant Direction
Georgios Kalomoiropoulos
Quant Direction は、3次元の市場分析ツールです。完全に客観的なアルゴリズムベースの市場分析を提供し、様々なパラメータにわたる正確なパーセンテージ偏差を同時に算出します。高度なAI搭載モデリングツールで開発され、厳密なテストを経て開発されたこのアルゴリズムは、かつてない精度で市場を分析するように設計されています。プラットフォーム上では、あらゆる通貨ペアや金融商品を分析できます。 短期取引、デイトレード、スイングトレードなど、どのような取引スタイルに も、Quant Directionは最適な選択肢です。 オペレーターの本当の利点 Quant Directionの真の利点は、感情、眼精疲労、過剰分析を完全に排除できる点にあります。方向性を探るために何十ものチャートを手作業で精査したり、自分の好みを常に疑ったりする必要がなくなります。このシステムは、8つの時間間隔(5ヶ月から月単位まで)をミリ秒単位で処理します。あらゆる瞬間に市場を支配している主体を正確に明らかにし、常に成功確率が最も高い方向で取引できるようにします。 市場分析の3つの側面 このアルゴリズムは市場を3つの
MonsterDash Harmonic Indicator is a harmonic pattern dashboard. It recognizes all major patterns. MonsterDash is a dashboard that displays all detected patterns for all symbols and (almost) all timeframes in sortable and scrollable format. Users can add their own user defined patterns . MonsterDash can open and update charts with the pattern found. Settings MonsterDash's default settings are good enough most of the time. Feel free to fine tune them to your needs. The color settings are for thos
このインジケーターは、反転ポイントと価格戻りゾーンを正確に表示します。     主要プレーヤー 。新たなトレンドが形成される場所を把握し、最大限の精度で意思決定を行い、すべての取引をコントロールします。 TREND LINES PRO インジケーターと組み合わせることで、その潜在能力を最大限に発揮します。 VERSION MT5 インジケーターが示す内容: 新しいトレンドの始まりに活性化する反転構造と反転レベル。 リスクと報酬の比率を最小限に抑えた利益 確定 と 損失停止の レベルの表示     RR 1:2   。 インテリジェントな削減ロジックによるストップロス。 指定されたインジケーターから 2 つのトレンド タイプの反転パターンを表示します。 指標: トレンドを追う   TREND LINES PRO   (世界的なトレンドの変化) TREND PRO   (クイックトレンド変更) シンプルで効果的   スキャナー   リアルタイムトレンド(新機能)。 マルチタイムフレームのインストゥルメント フィルタリング。 画面   利益     LOGIC AI信号の後。 当日プラス方
現在40%オフ 初心者やエキスパートトレーダーに最適なソリューション! このインジケーターは、独自の機能と新しい計算式を取り入れた、ユニークで高品質、かつ手頃な価格のトレーディングツールです。たった1枚のチャートで28の為替ペアの通貨強度を読み取ることができます。新しいトレンドやスキャルピングチャンスの引き金となるポイントを正確に特定することができるので、あなたのトレードがどのように改善されるか想像してみてください。 ユーザーマニュアルはこちら  https://www.mql5.com/en/blogs/post/697384 これが最初の1本、オリジナルだ! 価値のないクローンを買わないでください。 特別な サブウィンドウの矢印で強い通貨の勢いを表示 GAPがあなたのトレードを導く! 基準通貨や気配値が売られすぎ・買われすぎのゾーン(外相フィボナッチレベル)にあるとき、個別チャートのメインウィンドウに警告表示。 通貨がレンジの外側から反落した場合、プルバック/リバーサルのアラート。 クロスパターンの特別なアラート 複数の時間枠を選択可能で、トレンドを素早く確認できます
Advanced Supply Demand
Bernhard Schweigert
4.91 (300)
現在40%オフ 初心者にもエキスパートトレーダーにも最適なソリューション このインジケーターは独自の機能と新しい公式を多数内蔵しており、ユニークで高品質かつ手頃な取引ツールです。このアップデートでは、2つの時間枠ゾーンを表示できるようになります。より長いTFだけでなく、チャートTFとより長いTF(ネストゾーンを表示)の両方を表示できます。すべてのSupply Demandトレーダーの皆さんのお気に召すはずです。:) 重要情報の公開 Advanced Supply Demandの可能性を最大化するには、 https://www.mql5.com/ja/blogs/post/720245 にアクセスしてください。   エントリーまたはターゲットの正確なトリガーポイントを正確に特定できれば取引がどのように改善されるか想像してみてください。新しい基盤となるアルゴリズムに基づいて構築されているため、買い手と売り手の間の潜在的な不均衡をさらに簡単に特定できます。これは、最も強い需要と供給のゾーンと、過去のパフォーマンス(古いゾーンを表示)がグラフィカルに表現されるためです。これらの機能は、最適な
Send us a message after your purchase to receive more information on how to get your  BONUS  for FREE  that works in great combination with Bull vs Bear ! Bull versus Bear is an easy-to-use Forex indicator that gives traders clear and accurate signals based on clear trend retests . Forget about lagging indicators or staring at charts for hours because  Bull vs Bear provides real-time entries with no lag and no repaint, so you can trade with confidence. Bull vs Bear  helps you enter trades during
The Propfolio Master Suite is the ultimate all-in-one analytical workstation for professional traders. Combining the power of the Beat The Market Maker (BTMM) methodology, Smart Money Concepts (SND/Liquidity), and Advanced Volume Profile, this suite replaces multiple different indicators with one optimized engine. Monitor up to 14 pairs simultaneously from a single chart, instantly identify market cycles, and seamlessly map institutional footprints with the click of a button. The Command Center
Introduction Harmonic Patterns are best used to predict potential turning point. Traditionally, Harmonic Pattern was identified manually connecting peaks and troughs points in the chart. Manual harmonic pattern detection is painfully tedious and not suitable for everyone. You are often exposed under subjective pattern identification with manual pattern detection. To avoid these limitations, Harmonic Pattern Plus was designed to automate your harmonic pattern detection process. The functionality
The indicator is built on a non-standard Zig Zag, it draws accumulations after which if the price leaves this zone and a test of this zone occurs, then a sound signal is given and an arrow appears - after the test candle closes.The indicator does not redraw its signals, it is very easy to use, there are only three settings 1- this is the zig zag parameter 2- this is the minimum price exit from the zone 3- this is the maximum price exit from the zone. The lower the parameter for Zig Zag, the more
作者のその他のプロダクト
The   Area of Interest (AOI) Indicator   is a powerful tool designed to help traders identify key market zones where price reactions are highly probable. This indicator specifically highlights two critical zones: Seller AOI (Area of Interest) : This zone represents areas where sellers are likely to enter the market, often acting as resistance. When the price approaches or touches this zone, it signals that a potential sell-off could occur. Buyer  A OI (Area of Interest) : The BOI zone identifie
FREE
This is the best Support and Resistance Indicator on the market, and it shows both confirmed Support and Resistance as well as Retests. Support & Resistance: Support marks where buying demand halts price declines, acting as a safety net. Resistance caps price surges, driven by selling pressure. Traders leverage these levels to predict reversals, plan entries, exits, and manage risks, making them trading's fundamental guideposts. Join To Learn Market Depth -   https://www.mql5.com/en/channels/su
FREE
Price Retest MT5
Suvashish Halder
4.83 (6)
Introducing our exciting new Price Retest indicator! Get instant alerts when the price retests, giving you a powerful edge in your trading strategy. Remember to do your own analysis before making any moves in the market. MT4 Version -  https://www.mql5.com/en/market/product/118031 Join To Learn Market Depth -   https://www.mql5.com/en/channels/suvashishfx Here’s a detailed explanation of how the Price Retest indicator works, its components, and how you can incorporate it into your trading strat
FREE
The "Power of Three" (PO3) is a concept developed by the Inner Circle Trader (ICT) to illustrate a three-stage approach used by smart money in the markets:   Accumulation, Manipulation, and Distribution . ICT traders view this as a foundational pattern that can explain the formation of any candle on a price chart. In simple terms, this concept is effective for any time frame, as long as there's a defined start, highest point, lowest point, and end. MT4 -  https://www.mql5.com/en/market/product/1
FREE
Consolidation Zone   Indicator is a powerful tool designed for traders to identify and capitalize on consolidation patterns in the market. This innovative indicator detects consolidation areas and provides timely alerts when the price breaks above or below these zones, enabling traders to make informed trading decisions. MT4 Version :  https://www.mql5.com/en/market/product/118734 Join To Learn Market Depth -   https://www.mql5.com/en/channels/suvashishfx Key Features: 1.   Consolidation Det
FREE
Area of Interest
Suvashish Halder
4.78 (9)
The Area of Interest (AOI) Indicator is a powerful tool designed to help traders identify key market zones where price reactions are highly probable. This indicator specifically highlights two critical zones: Seller AOI (Area of Interest) : This zone represents areas where sellers are likely to enter the market, often acting as resistance. When the price approaches or touches this zone, it signals that a potential sell-off could occur. Buyer  A OI (Area of Interest) : The BOI zone identifies re
FREE
Introducing   Order Blocks Breaker , a brand-new way to identify and leverage order blocks in your trading strategy. After developing multiple order block tools with unique concepts, I’m proud to present this tool that takes things to the next level. Unlike previous tools,   Order Blocks Breaker   not only identifies order blocks but also highlights   Breaker Order Blocks —key areas where the price is likely to retest after a breakout. MT4 -  https://www.mql5.com/en/market/product/124101/ This t
Higher Timeframe Chart Overlay will display higher timeframe candles, including the number of candles high/low you specify. You no longer need to switch timeframes to check the candles. Everything can be shown in one chart. MT5 Version :  https://www.mql5.com/en/market/product/115682 Almost everything can be change as you want. You can change/set: - Choose different colors for the body and top/bottom wicks. - Panel's height and width. - The width of the body and wicks - Change background a
Consolidation Zone Indicator is a powerful tool designed for traders to identify and capitalize on consolidation patterns in the market. This innovative indicator detects consolidation areas and provides timely alerts when the price breaks above or below these zones, enabling traders to make informed trading decisions. MT5 Version :  https://www.mql5.com/en/market/product/118748 Join To Learn Market Depth -   https://www.mql5.com/en/channels/suvashishfx Key Features: 1. Consolidation Detecti
FREE
Live Trading Results   MT4 Version Contact for Manual Guide   Next Price $125 Free Scanner   Dashboard  (Contact me)   Strategy -   Breakout  /   Retest   /   Aggressive Hello Everyone, We are excited to introduce one of the most reliable and high win rate patterns in trading: the Cup and Handle . This is the first time we are releasing this meticulously crafted indicator, boasting an impressive 95% success rate . It is versatile and effective across all types of pairs, stocks
Price Retest
Suvashish Halder
4.88 (8)
Introducing our exciting new Price Retest indicator! Get instant alerts when the price retests, giving you a powerful edge in your trading strategy. Remember to do your own analysis before making any moves in the market. MT5 Version -  https://www.mql5.com/en/market/product/118159/ Join To Learn Market Depth -   https://www.mql5.com/en/channels/suvashishfx Here’s a detailed explanation of how the Price Retest indicator works, its components, and how you can incorporate it into your trading str
FREE
Smart Fibo Zones   are powerful, auto-generated Fibonacci Retracements that are anchored to key   market structure shifts . These zones serve as critical   Supply and Demand   levels, guiding you to identify potential price reactions and confirm market direction.  Fibonacci  calculations, widely used by professional traders, can be complex when it comes to identifying highs and lows. However,  Smart Fibo Zones  simplify this process by automatically highlighting order blocks and key zones, compl
This is the best Support and Resistance Indicator on the market, and it shows both confirmed Support and Resistance as well as Retests. Support & Resistance: Support marks where buying demand halts price declines, acting as a safety net. Resistance caps price surges, driven by selling pressure. Traders leverage these levels to predict reversals, plan entries, exits, and manage risks, making them trading's fundamental guideposts. Join To Learn Market Depth -   https://www.mql5.com/en/channels/suv
FREE
Introducing   Volume Orderflow Profile , a versatile tool designed to help traders visualize and understand the dynamics of buying and selling pressure within a specified lookback period. Perfect for those looking to gain deeper insights into volume-based market behavior! MT4 Version -  https://www.mql5.com/en/market/product/122656/ The indicator gathers data on high and low prices, along with buy and sell volumes, over a user-defined period. It calculates the maximum and minimum prices during t
This is one of the most popular and highly rated   volatility index (VIX)   indicators on the market. It provides the same readings as the VIX does for stock indexes. However, this indicator works across all asset classes.  VIX Fix Finds Market Bottoms.  This indicator is not for inexperienced traders. Use it for day and swing trading. MT4 Version -  https://www.mql5.com/en/market/product/112238 Join To Learn Market Depth -   https://www.mql5.com/en/channels/suvashishfx Bernard Baruch summe
FREE
Trading Notes   is an innovative tool designed for traders to streamline their decision-making process by allowing them to write and display important reminders or short details directly over their trading charts. This essential feature ensures that traders have quick access to their personalized checklist before opening any positions, enhancing their trading efficiency and accuracy. MT4 Version -  https://www.mql5.com/en/market/product/120613 Join To Learn Market Depth -  https://www.mql5.co
FREE
Volume Delta Candles offer a straightforward way to analyze trading activity within each candle, making it easier to see what's happening without needing an extra volume indicator. This tool uses lower timeframe or real-time data to show the percentage of buying and selling volume within a candle as a colored bar. Make sure you understand Volume and Volume Delta before jumping in. If you’re not sure, reach out to me first for a quick rundown. But if you're already familiar, you're good to go! Ke
Smart Fibo Zones are powerful, auto-generated Fibonacci Retracements that are anchored to key market structure shifts . These zones serve as critical Supply and Demand levels, guiding you to identify potential price reactions and confirm market direction.  Fibonacci calculations, widely used by professional traders, can be complex when it comes to identifying highs and lows. However, Smart Fibo Zones simplify this process by automatically highlighting order blocks and key zones, complete with St
Introducing the   Volume Order Blocks  indicator, a game-changing tool designed for traders who demand precision and clarity in their market analysis. This advanced indicator not only identifies order blocks but also integrates crucial volumetric data, allowing you to gauge the strength of these blocks with unparalleled accuracy. MT5 version -  https://www.mql5.com/en/market/product/121238/   Key Features of the Volume   Order Blocks: Bullish & Bearish Order Blocks:   Easily visualize and dif
Introducing the Volume Order Blocks indicator, a game-changing tool designed for traders who demand precision and clarity in their market analysis. This advanced indicator not only identifies order blocks but also integrates crucial volumetric data, allowing you to gauge the strength of these blocks with unparalleled accuracy. MT4 version -  https://www.mql5.com/en/market/product/121237/ Key Features of the Volume Order Blocks: Bullish & Bearish Order Blocks: Easily visualize and differentiat
We mark the fair value gap (FVG) and wait for the price to reach that zone, but sometimes it reverses before getting there. This can happen because we didn't notice the Balanced Price Range (BPR). My tools will enhance your analysis by displaying everything on the chart, helping you identify potential price reversal areas so you can make informed decisions about when to enter the market. MT4 -  https://www.mql5.com/en/market/product/119216 So, what is BPR or Balanced Price Range? A Balanced Pri
The Smart Liquidity Profile is color-coded based on the importance of the traded activity at specific price levels, allowing traders to identify significant price levels such as support and resistance levels, supply and demand zones, liquidity gaps, consolidation zones, Buy-Side/Sell-Side Liquidity and so on.  Smart Liquidity Profile allows users to choose from a number of different time periods including 'Auto,' 'Fixed Range,' 'Swing High,' 'Swing Low,' 'Session,' 'Day,' 'Week,' 'Month,' 'Quart
Order Block Tracker is here to solve one of the biggest challenges traders face: identifying order blocks. Many traders fail to spot these critical zones, often missing out on key market entries. But with Order Block Tracker , you no longer have to worry about that. This advanced indicator automatically highlights these crucial zones for you, giving you the confidence to enter the market at the right time. MT5 Version -  https://www.mql5.com/en/market/product/123362/ Key Features of Order Block
This is one of the most popular and highly rated volatility index (VIX) indicators on the market. It provides the same readings as the VIX does for stock indexes. However, this indicator works across all asset classes.  VIX Fix Finds Market Bottoms.  This indicator is not for inexperienced traders. Use it for day and swing trading. MT5 Version -  https://www.mql5.com/en/market/product/112284 Join To Learn Market Depth -   https://www.mql5.com/en/channels/suvashishfx Bernard Baruch summed i
FREE
Higher Timeframe Chart Overlay will display higher timeframe candles, including the number of candles high/low you specify. You no longer need to switch timeframes to check the candles. Everything can be shown in one chart. MT4 Version :  https://www.mql5.com/en/market/product/115680 Almost everything can be change as you want. You can change/set: - Choose different colors for the body and top/bottom wicks. - Panel's height and width. - The width of the body and wicks - Change background an
Tired of manually adjusting stop-loss and take-profit levels for multiple positions across different pairs? The Manage Multiple Positions Expert Advisor is your solution. MT4 Version -  https://www.mql5.com/en/market/product/120916/ This powerful tool streamlines your trading experience by allowing you to manage multiple positions on a single pair with ease. Modify stop-loss and take-profit levels for all open positions on a specific pair with a single click. Plus, the EA provides clear visibili
Higher Timeframe Chart Overlay will display higher timeframe candles, including the number of candles high/low you specify. You no longer need to switch timeframes to check the candles. Everything can be shown in one chart. Get Full Version -  https://www.mql5.com/en/market/product/115682 Please feel free Contact me if you have any questions   regarding    this tool. 
FREE
The Fibonacci Volatility Bands indicator is a refined tool designed to enhance your market analysis by integrating Fibonacci retracements with the Bollinger Bands concept. This indicator visually highlights potential areas of support and resistance, providing traders with a clearer understanding of price fluctuations and volatility. MT4 Version -  https://www.mql5.com/en/market/product/126421/ The core of the Fibonacci Volatility Bands is built around a Volume Weighted Moving Average (VWMA) that
FREE
Pairs Navigator   is a simple and easy-to-use tool that allows you to view all of your charts in a single window. This eliminates the need to open multiple charts from the Market Watch window, saving you time and effort. Pairs Navigator is also very lightweight, so it will not put a strain on your RAM or cause your MT4/5 platform to hang. To use Pairs Navigator, simply drag and drop the currency pairs you want to view into the Pairs Navigator window. You can then easily switch between charts by
FREE
Trading Notes
Suvashish Halder
5 (3)
Trading Notes is an innovative tool designed for traders to streamline their decision-making process by allowing them to write and display important reminders or short details directly over their trading charts. This essential feature ensures that traders have quick access to their personalized checklist before opening any positions, enhancing their trading efficiency and accuracy. MT5 Version -  https://www.mql5.com/en/market/product/120617 Join To Learn Market Depth -   https://www.mql5.com
FREE
フィルタ:
Erwin Fonke
510
Erwin Fonke 2025.03.04 10:48 
 

ユーザーは評価に対して何もコメントを残しませんでした

Suvashish Halder
176365
開発者からの返信 Suvashish Halder 2025.03.04 11:36
Thank you for your trust. Wish you all the best and Happy Trading 💚
Heiner G.
710
Heiner G. 2025.02.26 13:28 
 

This powerful indicator marks key price levels directly on the chart, providing valuable guidance for traders. I trade using the Smart Money Concept (SMC), and these levels are extremely helpful in clearly identifying potential entry points and target zones. By precisely visualizing important market areas, the indicator supports a structured trading strategy and helps make well-informed decisions. Additionally, the author is extremely helpful and clearly knows what he's talking about, making it even easier to understand and apply the indicator effectively.

Suvashish Halder
176365
開発者からの返信 Suvashish Halder 2025.03.04 11:36
Thank you for your trust. Wish you all the best and Happy Trading 💚
レビューに返信