Order Block Real
- インディケータ
- バージョン: 1.1
- アップデート済み: 5 5月 2025
- アクティベーション: 5

Detailed Explanation of the Order Block Indicator
What is an Order Block?
An Order Block refers to a specific price zone where institutional traders (e.g., banks, hedge funds) have placed a large number of buy or sell orders. These zones are critical because they often mark areas of significant market reversals, continuations, or breakouts.
In simpler terms, it's a region on the chart where the "big players" have left their footprints. Traders use these zones to predict price behavior—whether the price will:
- Return to the zone (and potentially reverse or continue in the same direction).
- Breakout through the zone (indicating a strong trend in the opposite direction).
How This Indicator Works
The Order Block Real indicator identifies and marks potential bullish and bearish order blocks on the chart. It also provides critical information about risk in monetary terms for the minimum lot size, helping traders manage their trades more effectively.
Here’s how it works step by step:
1. Bullish Order Block Identification
A Bullish Order Block is a zone where price is expected to:
- Reverse upwards after a pullback.
- Continue in an upward trend after testing the zone.
Conditions for Detection:
- The current candle's low aligns with the zone.
- The last three candles show a specific pattern:
- The first (most recent) is bullish (closing higher than it opened).
- The second (prior to the bullish) is bearish (closing lower than it opened).
- The close of the bullish candle is higher than the high of the second (bearish) candle.
- There is a bullish Fair Value Gap (FVG): The current low is above the second candle's high.
- Certain prior lows and closes align, forming the structure of the order block.
What Happens:
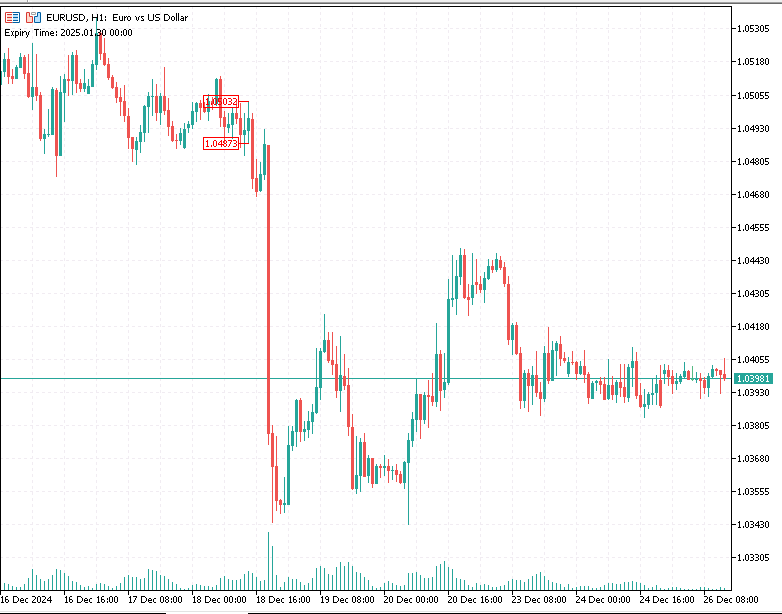
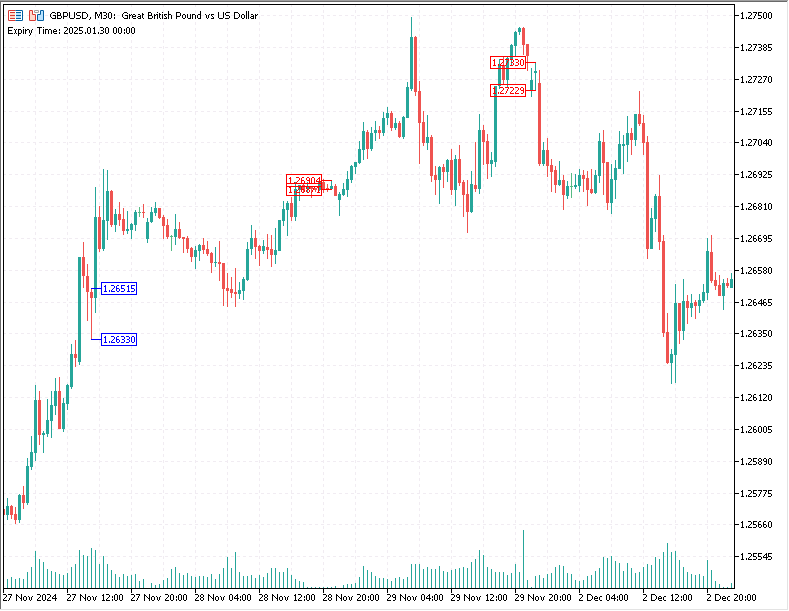
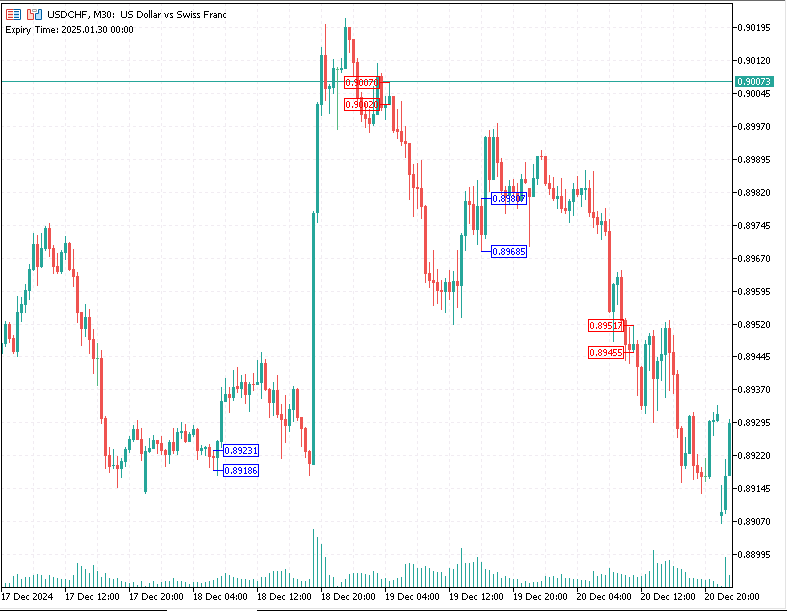
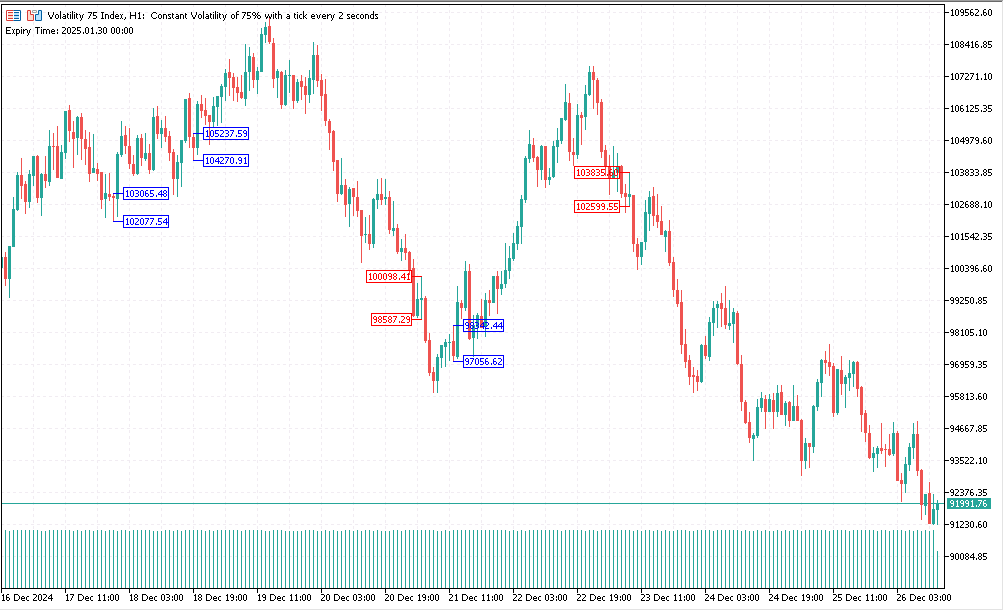
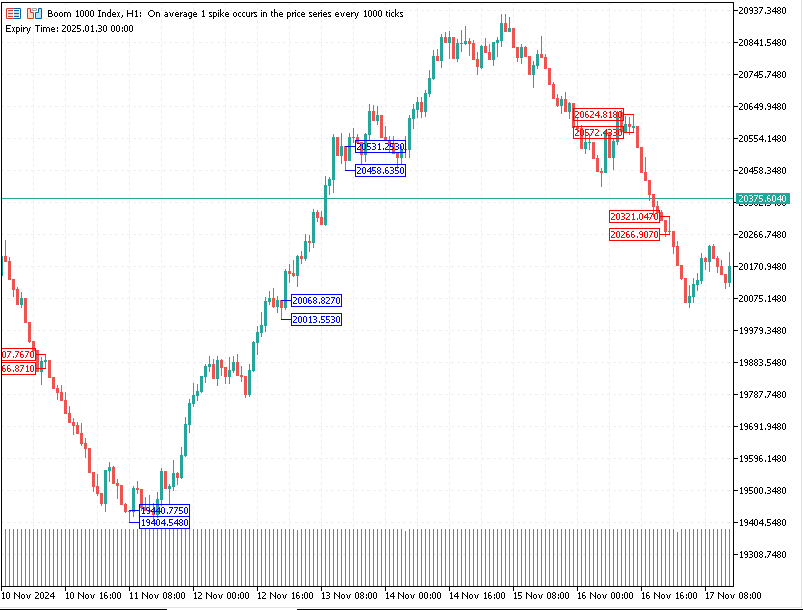
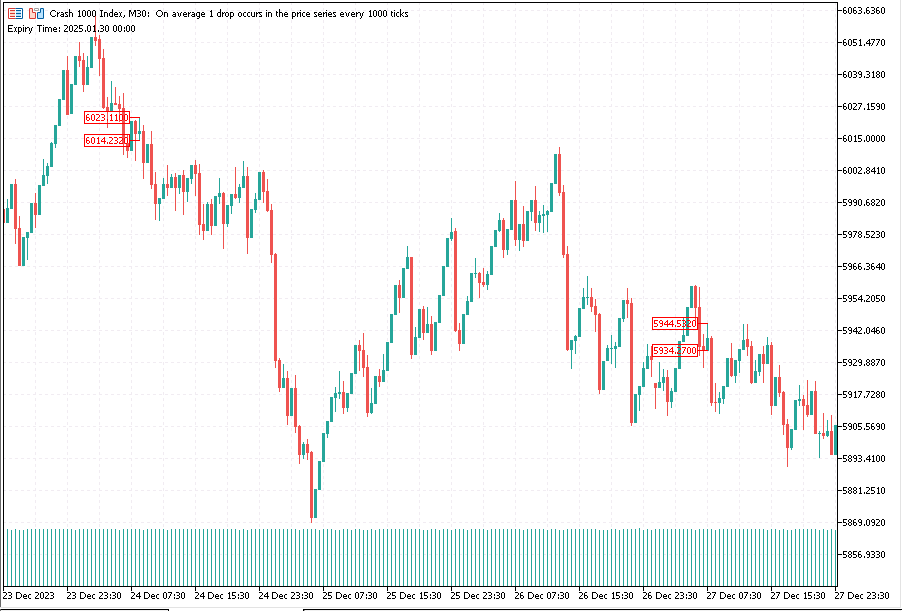
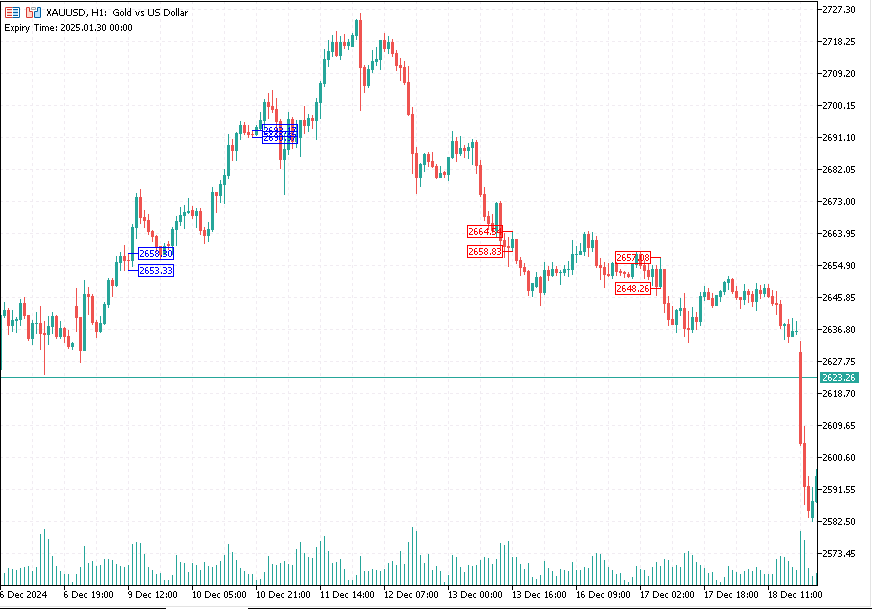
- A blue arrow is plotted to mark the Entry Price (based on the high of the order block).
- Another blue arrow marks the Stop Loss Price (based on the low of the order block).
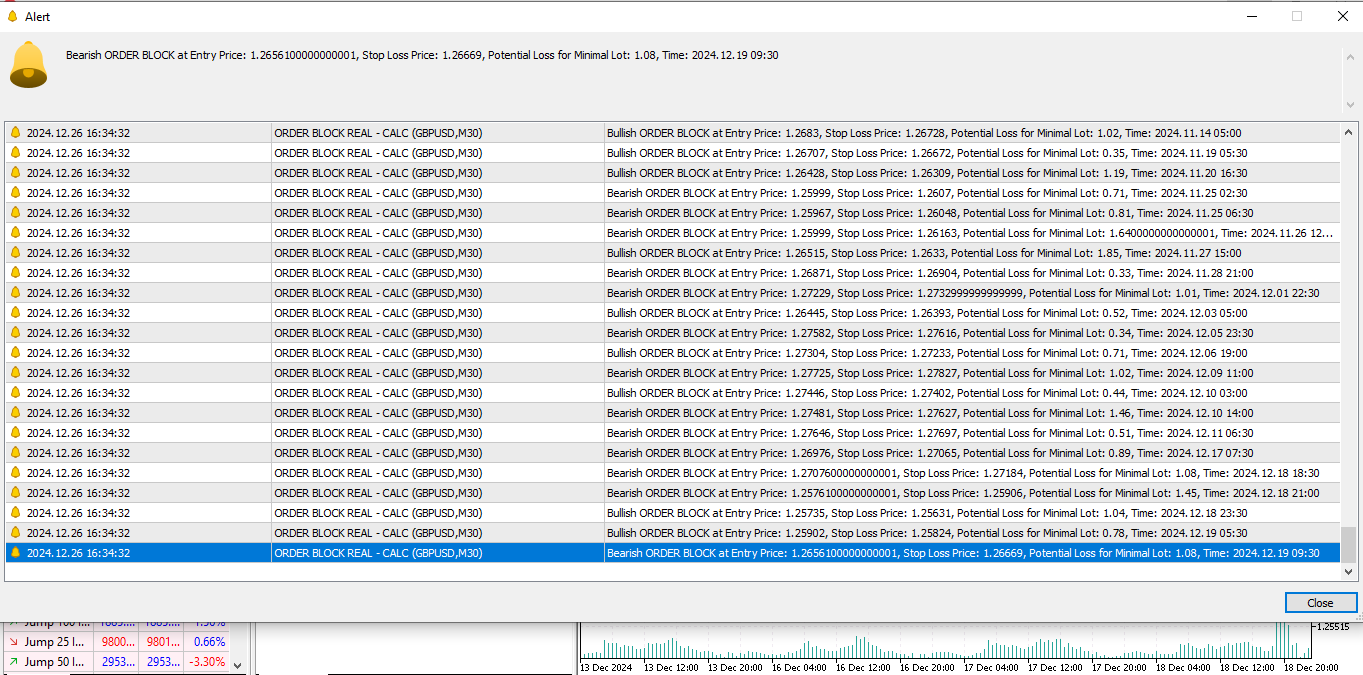
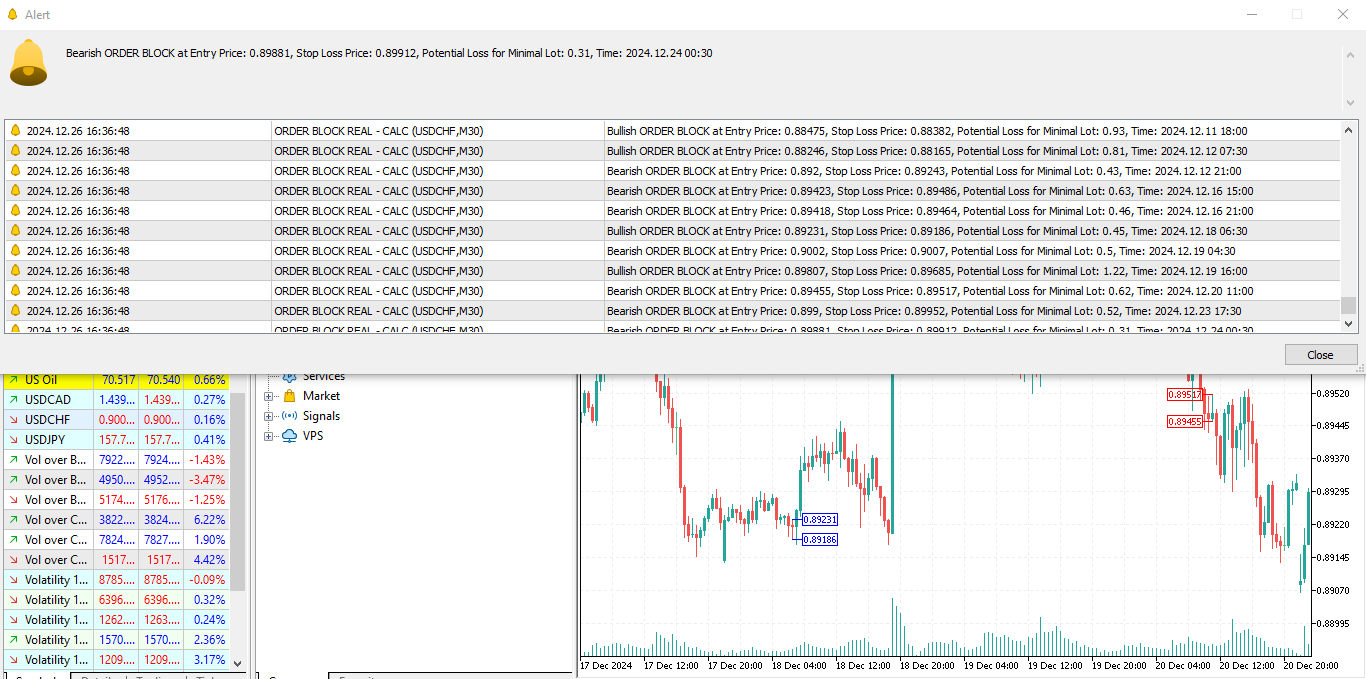
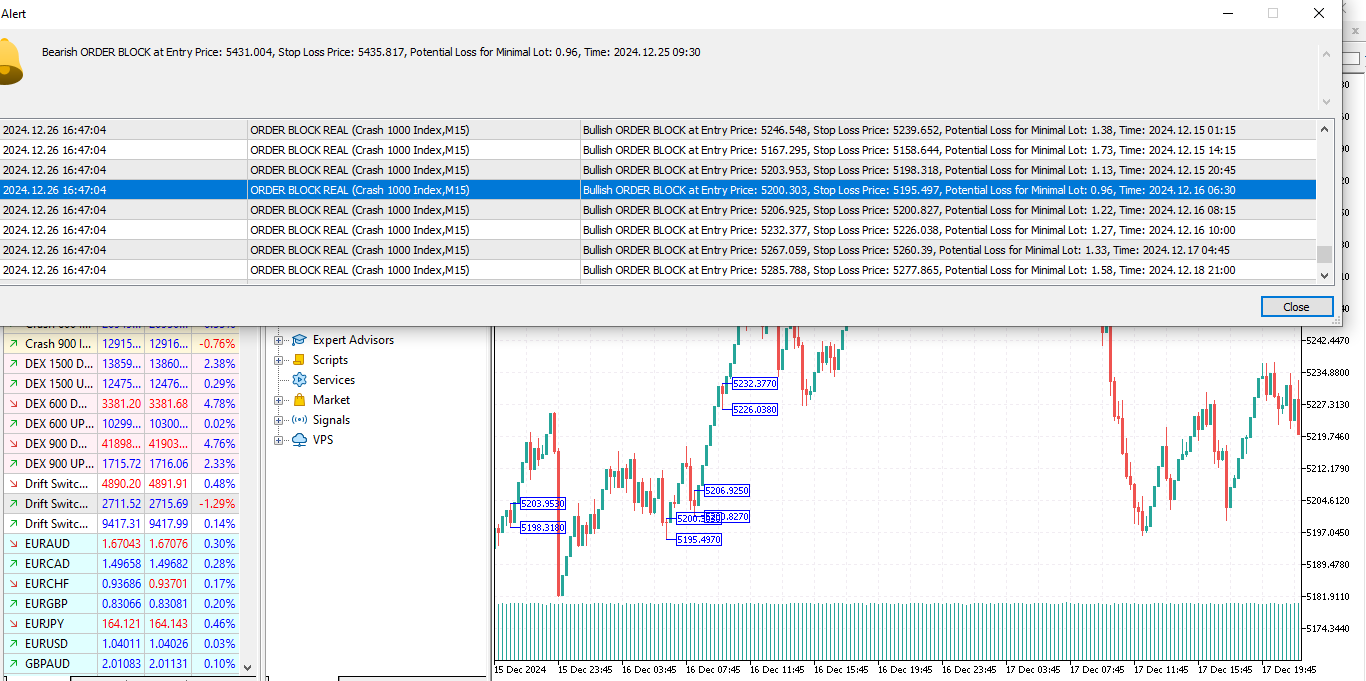
- Alerts provide the entry price, stop loss, and the risk amount in dollars for the minimum lot size.
Risk Calculation: The risk amount is calculated as:
Risk = ( High of Order Block − Low of Order Block ) × Contract Size × Minimum Lot Size \text{Risk} = (\text{High of Order Block} - \text{Low of Order Block}) \times \text{Contract Size} \times \text{Minimum Lot Size}Failed Bullish Order Blocks:
- If a bullish order block fails (price drops below the stop loss significantly), it may act as a bearish breakout signal, indicating strong downward momentum.
2. Bearish Order Block Identification
A Bearish Order Block is a zone where price is expected to:
- Reverse downwards after a pullback.
- Continue in a downward trend after testing the zone.
Conditions for Detection:
- The current candle's high aligns with the zone.
- The last three candles show a specific pattern:
- The first (most recent) is bearish (closing lower than it opened).
- The second (prior to the bearish) is bullish (closing higher than it opened).
- The close of the bearish candle is lower than the low of the second (bullish) candle.
- There is a bearish Fair Value Gap (FVG): The current high is below the second candle's low.
- Certain prior highs and closes align, forming the structure of the order block.
What Happens:
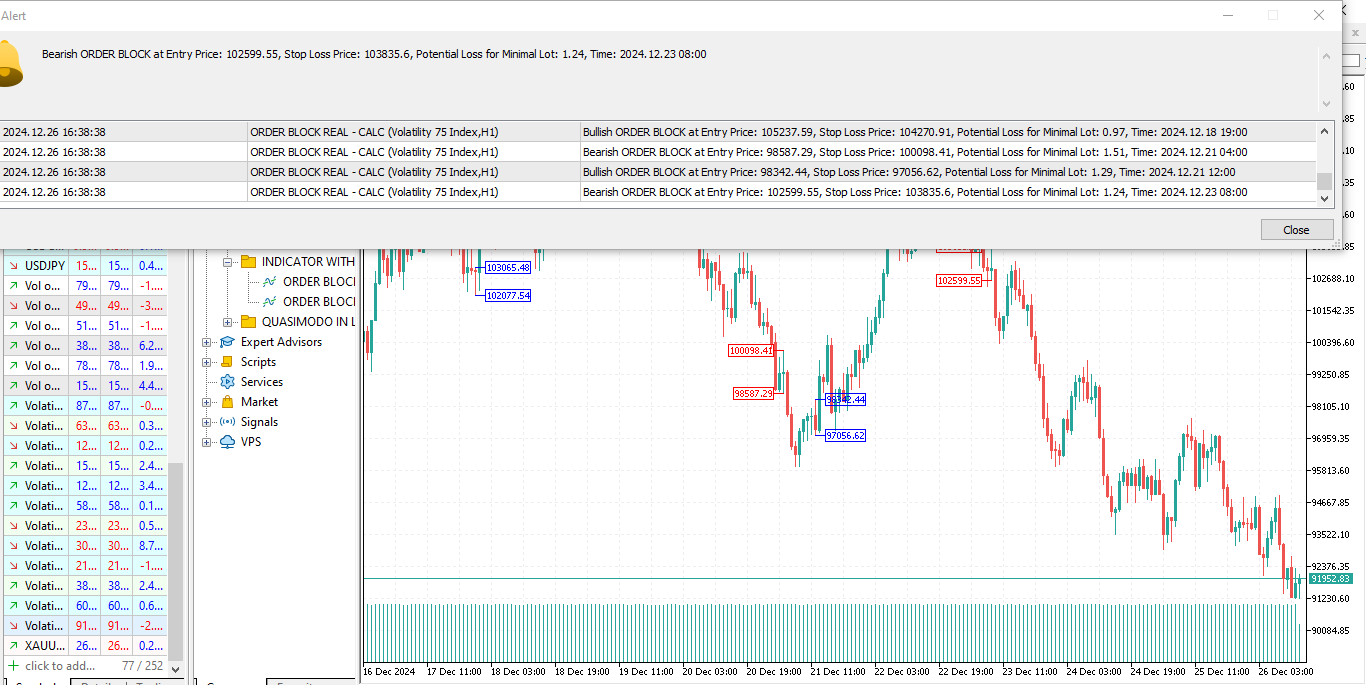
- A red arrow is plotted to mark the Entry Price (based on the low of the order block).
- Another red arrow marks the Stop Loss Price (based on the high of the order block).
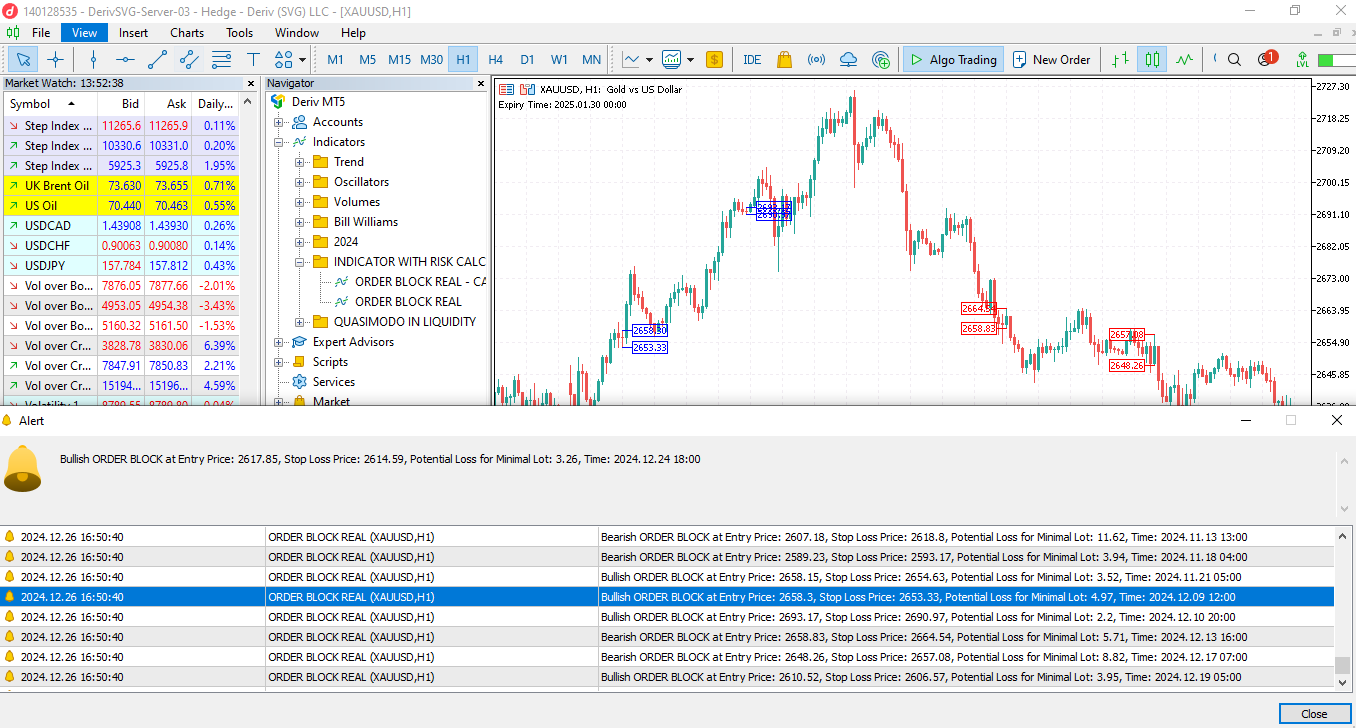
- Alerts provide the entry price, stop loss, and the risk amount in dollars for the minimum lot size.
Risk Calculation: The risk amount is calculated similarly to bullish blocks:
Risk = ( High of Order Block − Low of Order Block ) × Contract Size × Minimum Lot Size \text{Risk} = (\text{High of Order Block} - \text{Low of Order Block}) \times \text{Contract Size} \times \text{Minimum Lot Size}Failed Bearish Order Blocks:
- If a bearish order block fails (price rises above the stop loss significantly), it may act as a bullish breakout signal, indicating strong upward momentum.
3. Risk Management
- The indicator automatically calculates the risk amount in dollars for the minimum lot size based on the distance between the entry and stop loss prices.
- This helps traders quickly assess if the trade aligns with their risk tolerance before entering the position.
4. Breakout Behavior
-
Order Block Breakouts: When the price breaks through an order block, it signals a potential strong move in the direction of the breakout.
-
For example:
- If a bullish order block is breached to the downside, this could signal a bearish breakout.
- If a bearish order block is breached to the upside, this could signal a bullish breakout.
-
The indicator allows traders to use failed order blocks as contrarian signals for breakouts.
Example Scenario
-
Bullish Order Block:
- Price forms a bullish structure.
- The indicator marks the entry price (e.g., $1,800) and stop loss (e.g., $1,790).
- The risk for a minimum lot size (e.g., 0.01 lots) is calculated as $10.
- Price tests the order block, then reverses upward, allowing the trader to profit.
-
Failed Bullish Order Block:
- Price breaches the bullish stop loss (e.g., $1,790).
- This signals a potential bearish breakout.
- Traders can use this information to go short, expecting further downward momentum.
Who Is This Indicator For?
- Day Traders and Swing Traders who rely on technical analysis.
- Beginner Traders who need clear signals and risk assessments.
- Institutional and Retail Traders looking for zones of interest to enter or exit the market.
Summary:
- Ease of Use: Simple visual cues (arrows) for entry and stop loss.
- Risk Management: Automatic calculation of monetary risk for minimum lot size.
- Versatility: Detects both bullish and bearish order blocks, including failed ones for breakout strategies.
- Custom Alerts: Audible alerts for every detected order block with detailed information.
How to Install the Order Block Indicator in MT5 for PC
Installing the Order Block Indicator in Meta Trader 5 (MT5) on a PC is straightforward. Follow these steps:
Step 1: Download the Indicator
- Obtain the indicator file (ORDER BLOCK REAL.ex5) from the MQL5 Market.
- The file is compatible with MT5.
Step 2: Open MetaTrader 5
- Launch MT5 on your PC.
- Log in to your trading account.
Step 3: Locate the Data Folder
- In MT5, click File in the top-left menu.
- Select Open Data Folder.
This will open the folder where all MT5 files are stored.
Step 4: Navigate to the Indicators Folder
- In the Data Folder, go to:
MQL5 -> Indicators
- This is where all custom indicators are stored.
Step 5: Copy the Indicator File
- Copy the downloaded `ORDER BLOCK REAL.ex5` file.
- Paste it into the Indicators folder.
Step 6: Restart MetaTrader 5
- Close MT5 completely.
- Relaunch MT5 to ensure the indicator is loaded into the system.
Step 7: Add the Indicator to a Chart
- In MT5, open a chart for the instrument you want to analyze (e.g., EUR/USD, Gold, Volatility 75 etc.).
- Click Insert in the top menu, then navigate to:
Indicators -> Custom
- Look for the Order Block Indicator in the list and select it.
Step 8: Customize Indicator Settings
- A settings window will pop up after you select the indicator.
- Click OK to apply the indicator to the chart.
Step 9: Check Installation
- Verify that the indicator is displayed on the chart with:
- Arrows marking entry points.
- Highlighted zones for order blocks.
- Alerts showing risk amounts and signals.
Troubleshooting Installation
- Indicator not showing: Ensure the ORDER BLOCK REAL.ex5 file is in the correct folder and the platform was restarted.
- Alerts not working: Revisit the settings and ensure notifications are enabled in MT5.
Now you’re ready to use the Order Block Indicator on MT5 to identify critical price zones and manage your trades effectively!
FAKE!!!