Price Break MT5
- インディケータ
- バージョン: 1.20
- アップデート済み: 17 11月 2021
- アクティベーション: 15

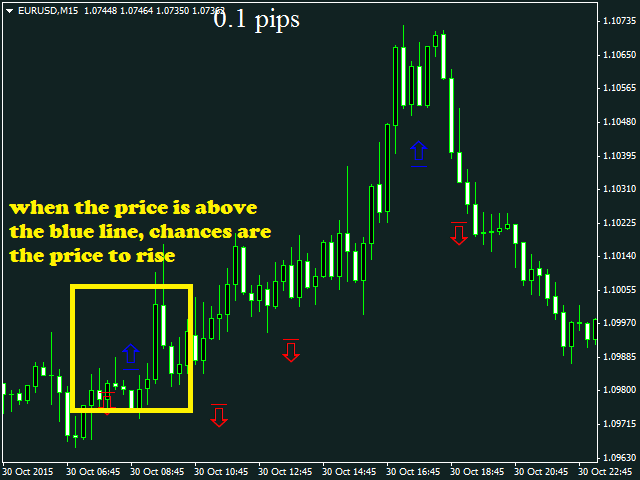
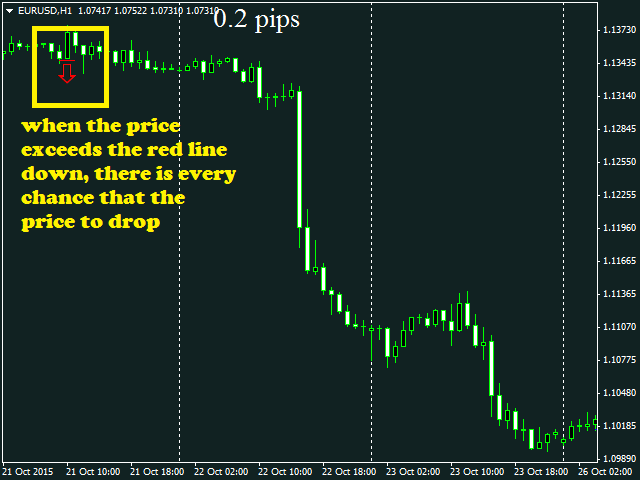
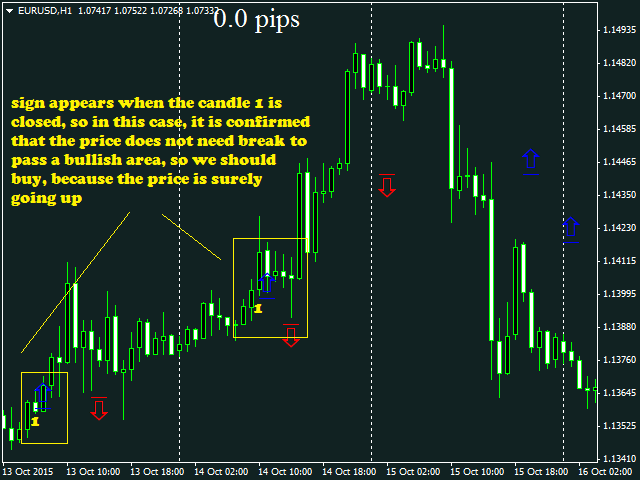
The "Price Break" indicator is a powerful tool for any trader. If the price breaks the levels the indicator shows, there is aproximatelly a 77% chance it will go in the same direction.
If it exceeds the blue line, there are many possibilities for the price to rise. On the contrary, if it passes down the red line, it means that there are many possibilities for the price to drop.
We should always consider the latest indicator signal, so we should rely only on the last blue arrow and the last red arrow.
The indicator has only one input.
Indicator parameters
- SPACES: increasing this value, the input is more refined, but of course, it will have less signals, by default, you should use the value 3.
The strategy is to place a pending order in each of these levels, and update whenever the indicator generates a new signal (arrow). When the indicator is shown on the very price, a pending order cannot be set. Execute the purchase or sale immediately.