Engulfing Candlestick Bulkowski
- インディケータ
- バージョン: 1.0
- アクティベーション: 5

Engulfing Candlestick Bulkowski
The engulfing candlestick is a well-known candle pattern composed of two candles.
This indicator for showing engulfing candlestick that describe by Thomas Bulkowski.
If you need for MetaTrader 4 version, please visit here:
https://www.mql5.com/en/market/product/34193
Feature Highlights
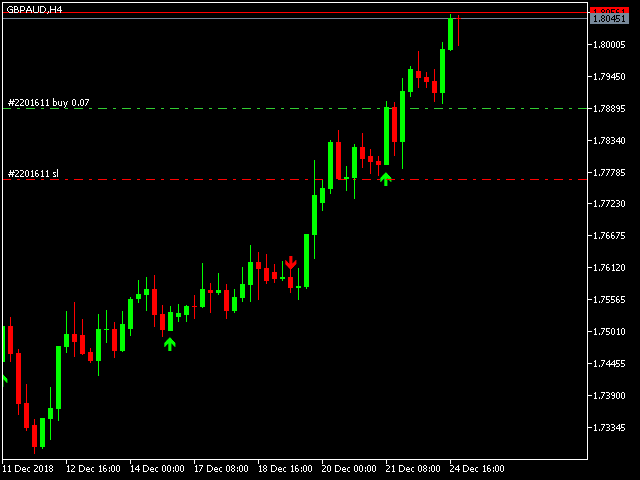
Show bullish engulfing and bearish engulfing.
- Customizable "Up Symbol".
- Customizable "Down Symbol".
- Customizable symbol distance from candlestick.
- Customizable "Down Color".
- Customizable "Up Color".
Input Parameters
- UpSymbol - Input symbol code from "wingdings" for bullish engulfing (default is arrow up).
- DownSymbol - Input symbol code from "wingdings" for bearish engulfing (default is arrow down).
- SymbolShift - Input symbol distance from candlestick.
- DownColor - Input color for down symbol (bearish engulfing).
- UpColor - Input color for up symbol (bullish engulfing).
Engulfing Candlestick definition by Thomas Bulkowski:
- Bullish Engulfing
The first is a bearish candle followed by a bullish candle.
The bullish candle should have a close above the prior open and an open below the prior close.
In other words, the body of the bullish candle should engulf or overlap the body of the bearish candle.
Ignore the shadows. Shadows are unimportant.
- Bearish Engulfing
The first is a bullish candle followed by a bearish candle.
The bearish candle should have a close below the prior open and an open above the prior close.
In other words, the body of the bearish candle should engulf or overlap the body of the bullish candle.
Ignore the shadows. Shadows are unimportant.