SMC Trend Matrix FREE (v3.15) — Professional Multi-Timeframe Analytical Hub SMC Trend Matrix FREE is a high-performance analytical tool based on Smart Money Concepts (SMC). It is designed to filter out market noise and identify high-probability institutional supply and demand zones across multiple timeframes simultaneously. Version 3.15 is a massive upgrade from v2.73, focusing on execution speed, UI/UX, and professional market structure analysis.
The Core Algorithm The indicator utilizes
GDS Renko Pip ST Chart - Pip-Based Renko Chart Indicator for MetaTrader 5 GDS Renko Pip ST Chart is a pip-based Renko chart indicator for MetaTrader 5. It helps traders build and study cleaner Renko price movement using a practical fixed pip or point-based brick structure. This tool is designed as a Renko chart foundation for manual analysis. It does not predict the market, does not generate buy or sell signals and does not decide whether a trade should be opened. What Pip ST Chart Does Renko ch
This indicator obeys the popular maxim that: "THE TREND IS YOUR FRIEND" It paints a GREEN line for BUY and also paints a RED line for SELL. (you can change the colors). It gives alarms and alerts of all kinds. IT DOES NOT REPAINT and can be used for all currency pairs and timeframes. Yes, as easy and simple as that. Even a newbie can use it to make great and reliable trades. NB: For best results, get my other premium indicators for more powerful and reliable signals. Get them here: https://www.m
- وصف المنتج - مؤشر احترافي متكامل
لا يعد KING Fusion MACD-Vol من KING TRADING EA مجرد MACD آخر — فهو عبارة عن مجموعة أدوات تداول كاملة تجمع بين مؤشرات احترافية متعددة في نافذة فرعية واحدة أنيقة. لم تعد بحاجة إلى تحميل مخططك بأدوات منفصلة. يجمع هذا المؤشر بين:
MACD مع خطوط مزدوجة ورسم بياني مكبر
رسم بياني ملون ومثبت بالحجم
ملصقات ديناميكية مع قيم المؤشرات في الوقت الفعلي (ATR، ADX، RSI، Volume)
عداد تنازلي للبار
التنبيهات المتقاطعة (مرئية + صوتية)
كل ما تحتاجه من الوضوح والسرعة والدقة -
Candle Detector By Mahefa R. General Description Candle Detector is an advanced technical indicator for MetaTrader 5 , designed to automatically detect and highlight the most important Japanese candlestick patterns directly on the price chart .
It allows traders to quickly identify market reversal and continuation setups without visual clutter. The indicator recolors only the candles that match the selected pattern , ensuring a clear, accurate, and professional chart analysis . ️ How It Work
PROMETHEUS TECHNICAN VERSION Free | By THE SONS A gift from The Sons — no strings, no trial, no expiry. Every trader deserves access to professional-grade market intelligence. That belief is why Prometheus Technical Version exists, and why it costs nothing. Consider it our handshake to the trading community. What You're Getting This is not a simplified tool dressed up as a gift. Prometheus Technican Version is a fully built, institutional-quality technical analysis indicator running a dual-model
>> Announcements Channel << ATR Plus is an enhanced version of the classic ATR that shows not just volatility itself, but the directional energy of the market .
The indicator converts ATR into a normalized oscillator (0–100), allowing you to clearly see: who dominates the market — buyers or sellers when a trend begins when a trend loses strength when the market shifts into a range where volatility reaches exhaustion zones ATR Plus is perfect for momentum, trend-following, breakout and volatilit
FlatBreakout MT5 (Free Version) Flat Range Detector and Breakout Panel for MT5 — GBPUSD Only FlatBreakout MT5 is the free version of the professional FlatBreakoutPro MT5 indicator, specially designed for flat (range) detection and breakout signals on the GBPUSD pair only.
Perfect for traders who want to experience the unique fractal logic of FlatBreakout MT5 and test breakout signals on a live market without limitations. Who Is This Product For? For traders who prefer to trade breakout of
Original supertrend indicator in Tradingview platform. Indicator type: Price Action indicator Introduction: The Supertrend Indicator - Enhancing Your Trend Analysis. If you haven't yet found a Supertrend indicator with good graphics on the MQL5 platform, this is the indicator for you. Overview: The Supertrend Indicator is a powerful tool designed to provide traders with valuable insights into the current and historical trends of financial markets. It serves as a valuable addition to any t
AZ session scalper
A small but useful session indicator, designed primarily for scalping. Enable the session you plan to trade, watch the reaction of the M5/M15 candlesticks to the level of the previous trading session, and enter. We always look at the reaction of the current session to the previous one. For example, if you trade the Americas, enable the European session, and watch how one session takes away liquidity from another. Important: adjust the time to your broker's time zone in the i
Coral trend is a trend-following indicator that is widely popular among FOREX traders . It is usually used as a confluence with other indicators. It uses combinations of moving averages with complex smoothing formulas! It has two configurable parameters: Coefficient - smoothing ratio (*)
Applied price Calculation: Coral = (-0.064) * B6 + 0.672 * B5 - 2.352 * B4 + 2.744 * B3
This indicator is an automated version of the Fibonacci retracement (Fib) indicator. Deciding the best areas to use when drawing the fib can be tricky and this indicator was made with that in mind. When you drop it on the chart it will automatically choose the best points to draw the fib with, but in case you aren't satisfied with those regions, you can adjust it as you wish.
This indicator displays Pivot-Lines, preday high and low, preday close and the minimum and maximum of the previous hour. You just have to put this single indicator to the chart to have all these important lines, no need to setup many single indicators.
Why certain lines are important Preday high and low : These are watched by traders who trade in a daily chart. Very often, if price climbs over or falls under a preday low/high there is an acceleration in buying/selling. It is a breakout out of a
Free automatic Fibonacci is an indicator that automatically plots a Fibonacci retracement based on the number of bars you select on the BarsToScan setting in the indicator. The Fibonacci is automatically updated in real time as new highest and lowest values appears amongst the selected bars. You can select which level values to be displayed in the indicator settings. You can also select the color of the levels thus enabling the trader to be able to attach the indicator several times with differe
The indicator is based on Robert Miner's methodology described in his book "High probability trading strategies" and displays signals along with momentum of 2 timeframes. A Stochastic oscillator is used as a momentum indicator.
The settings speak for themselves period_1 is the current timeframe, 'current' period_2 is indicated - the senior timeframe is 4 or 5 times larger than the current one. For example, if the current one is 5 minutes, then the older one will be 20 minutes The rest of the s
Indicator and Expert Adviser EA Available in the comments section of this product. Download with Indicator must have indicator installed for EA to work.
Mt5 indicator alerts for bollinger band and envelope extremes occurring at the same time. Buy signal alerts occur when A bullish candle has formed below both the lower bollinger band and the lower envelope Bar must open and close below both these indicators. Sell signal occur when A bear bar is formed above the upper bollinger band and upper
Revolution Martingale is an indicator designed for trading binary options on the M5 timeframe. Features: M5 Timeframe: It is recommended to use the indicator on the M5 timeframe for optimal trading. Trade Entry: Trades should only be opened on the first candle after a signal appears. Signals: A blue diamond indicates a buying opportunity for upward movement, while a red diamond indicates a buying opportunity for downward movement. Configured for Effective Binary Options Trading: The indicator i
The indicator identifies when a divergence occurs between price and an indicator or oscillator. It identifies both regular and hidden divergences. Combined with your own rules and techniques, this indicator will allow you to create (or enhance) your own powerful system. For higher probability setups I can recommend you to use my Supply Demand indicator and trade only if the divergence occurs inside a zone. Supply zone for bearish div and demand zone for bullish div. The optimal scenario is if it
This indicator calculates fibonacci levels via moving averages trend and draw these lines. You can change fast and slow Moving Averages settings for customization. Inputs:
Fast MA Time Period : 64 Fast MA Shift: 0 Fast MA Method: Smoothed Fast MA Apply To: Median Price Slow MA Time Period: 32 Slow MA Shift: 0 Slow MA Method: Smoothed Slow MA Apply To: Median Price ZigZag: False ZigZag Color: Red ZigZag Type: DashDot ZigZag Width: VeryThin Fibo Settings TrendFibonacci: True FiboTrendColor: Black
Indicator Description 4 Hull MA Color + Envelopes is a powerful trend-following indicator for MetaTrader 5 that combines four Hull Moving Averages (HMA) with Moving Average Envelopes to clearly identify market direction, trend strength, and potential reversal or pullback zones. This indicator is designed to reduce noise, react quickly to price movement, and provide a clean visual structure for professional trading. Key Features 4 Hull Moving Averages (20, 50, 100, 200) Automatic color change
GDS Renko Pip ST - Fixed Brick Renko Chart Tool for MetaTrader 5 GDS Renko Pip ST is a Renko chart tool for MetaTrader 5 designed for traders who want to build and study fixed brick Renko movement using a practical pip or point-based setup. The purpose of this tool is simple: create a cleaner Renko structure so the trader can observe direction, brick runs, pullbacks, support and resistance behavior without normal candle noise. This is not a signal indicator and it does not predict the market. It
Are you tired of drawing trendlines every time you're analyzing charts? Or perhaps you would like more consistency in your technical analysis. Then this is for you. This indicator will draw trend lines automatically when dropped on a chart. How it works Works similar to standard deviation channel found on mt4 and mt5. It has 2 parameters: 1. Starting Bar 2. Number of bars for calculation The starting bar is the bar which drawing of the trend lines will begin, while the number of bars for c
MSX Hybrid Heiken Scalper Overview MSX Hybrid Heiken Scalper is a MetaTrader 5 indicator based on a modified Heiken Ashi methodology with closed-bar smoothing. The indicator is designed to display trend direction through color-coded candles while reducing sensitivity to short-term market fluctuations. All calculations are performed using completed candles, allowing historical values to remain fixed after bar close. Features • Modified Heiken Ashi calculation • Closed-bar processing • Color-code
This is a free version of the indicator, the period between the vertical lines is always 30 bars. In the paid version the period can be set by user, so a configuration with many ThreePointsChannel indicators with different periods is possible.
The principle of construction - on top of any number of bars set by the user, a channel is constructed with maximum and minimum lines so that the bars touch the maximum and minimum of the channel at exactly three points. The name of the indicator follows
SuperScalp Pro – プロフェッショナル多層コンフルエンス・スキャルピングシステム SuperScalp Pro は、複数のコンフルエンスを組み合わせたプロフェッショナル向けスキャルピングシステムです。より高い確率のトレードチャンスを見つけられるよう設計されており、明確なエントリー確認、ATRに基づくStop LossとTake Profit、さらにXAUUSD、BTCUSD、主要なFX通貨ペアに対応した柔軟なシグナルフィルター機能を提供します。
完全なドキュメントは製品ブログにあります: [User Guide]
SuperScalp Pro Auto Trader EA による自動売買が利用可能です: [Auto Trader]
SuperScalp Pro のトレードロジックを基に開発されたゴールド自動スキャルピングEA: [SuperScalp Gold]
SuperScalp Pro は、Supertrend、VWAP、EMA、RSI、ADX、出来高分析、ボリンジャーバンド、MACDダイバージェンスを組み合わせ、低品質なトレードセットアップをフィルタリングし
Welcome to ENTRY IN THE ZONE AND SMC MULTI TIMEFRAME Entry In The Zone and SMC Multi Timeframe is a professional trading indicator built on Smart Money Concepts (SMC) , combining market structure analysis with a No Repaint BUY / SELL signal system in a single indicator. It helps traders understand market structure more clearly, identify key price zones, and focus on higher-quality trading opportunities. By combining Multi-Timeframe Analysis , Points of Interest (POIs) , and real-time signals, th
Neuro Poseidon is a new indicator by Daria Rezueva. It combines precise trading signals with adaptive TP/SL levels - creating best possible trades as a result!
Message me and get Neuro Poseidon Assistant as a gift to automize your trading process!
What makes it stand out?
1. Proven profitability on all assets and timeframes
2. Only confirmed BUY and SELL signals present on the chart
3. Adaptive TP & SL levels generated by the software for each trade
4. Easy to understand - suitable for al
Crystal Heikin Ashi Signals - Professional Trend & Signal Detection Indicator Advanced Heikin Ashi Visualization with Intelligent Signal System for Manual & Automated Trading
Final Price: $149 ---------> Price goes up $10 after every 10 sales .
Limited slots available — act fast .
Overview Crystal Heikin Ashi Signals is a professional-grade MetaTrader 5 indicator that combines pure Heikin Ashi candle visualization with an advanced momentum-shift detection system. Designed for both manual traders
ARIPoint is a powerful trading companion designed to generate high-probability entry signals with dynamic TP/SL/DP levels based on volatility. Built-in performance tracking shows win/loss stats, PP1/PP2 hits, and success rates all updated live. Key Features: Buy/Sell signals with adaptive volatility bands Real-time TP/SL/DP levels based on ATR Built-in MA Filter with optional ATR/StdDev volatility Performance stats panel (Success, Profit/Loss, PP1/PP2) Alerts via popup, sound, push, or email Cu
FX Power: 通貨の強弱を分析して、より賢い取引を実現 概要
FX Power は主要通貨と金の実際の強弱をあらゆる市場状況で理解するための必須ツールです。強い通貨を買い、弱い通貨を売ることで、 FX Power は取引の意思決定を簡素化し、高い確率の取引機会を見出します。トレンドを追従する場合でも、極端なデルタ値を使用して反転を予測する場合でも、このツールはあなたの取引スタイルに完全に適応します。ただ取引するだけではなく、 FX Power で賢く取引をしましょう。
1. なぜ FX Power がトレーダーにとって非常に有益なのか 通貨と金のリアルタイム強弱分析
• FX Power は主要通貨と金の相対的な強弱を計算し、マーケットダイナミクスに関する明確な洞察を提供します。
• どの資産がリードしているか、または後れを取っているかを監視して、取引するペアを賢く選びましょう。 マルチタイムフレームの包括的なビュー
• 短期、中期、長期のタイムフレームで通貨と金の強弱を追跡し、マーケットトレンドに基づいて取引戦略を調整できます。
• スキャルピングからスイングトレード
The Oracle Pro:MT5向け合成マルチタイムフレーム・バイアスエンジン ️ サマー・ローンチ・オファー — The Oracle Pro を 199 USD で(早期購入者向け)。価格は普及に応じて上昇します。最終価格 399 USD。 The Oracle Pro は、要求の高いプロのトレーダーのために作られた MetaTrader 5 向けのプレミアム・マルチタイムフレーム バイアスエンジン です。ひとつの問いに規律をもって答えます。すなわち、各タイムフレームの現在の方向バイアスは何か、その強さはどれほどか、そしてタイムフレーム同士はどれだけ一致しているか。すべては確定足のみで計算され、リペイントはありません。 The Oracle Pro はマルチファクター・コンセンサス・システムです。独自のインジケーターと最適化されたアルゴリズムを単一の高度なコンセンサス・ベクトルに統合し、それを単一のインジケーター・インスタンス内で現在足と上位足のスタックにわたって読み取ります。複数のチャートにばらばらのツールを積み重ねる代わりに、です。 これは Oracle コンセンサス手法
SMC Pro ToolKit is a professional chart-based Smart Money Concepts indicator for MetaTrader 5. It helps traders read market structure, identify key liquidity areas, organize trade context, and plan setups directly from the chart. This is not a simple buy/sell arrow indicator. It is a complete visual trading toolkit that combines Smart Money Concepts, multi-timeframe analysis, session context, setup planning, risk assistance, and professional dashboard tools in one clean workspace. Watch setup
HiperCube Tornado is here! Discount code for 20% off at Darwinex Zero: DWZ2328770MGM_20 HiperCube Tornado is a simple but effective indicator that helps you to identify when a new bull or bear power is near. Easy to use Custom Colors Separate windows indicator TEMA is used to do calcs Custom Periods Custom Method Chat GPT and AI used to be developed Strategy Wait to TI+ cross the TI- Thats means ,signal to buy
Wait to TI- cross the TI+ Thats means , signal to sell
Remmenber combines this w
このインディケーターはEAの一部です: HIPERCUBE PRO GALE BTC Darwinex Zeroの20%割引コード: DWZ2328770MGM_20
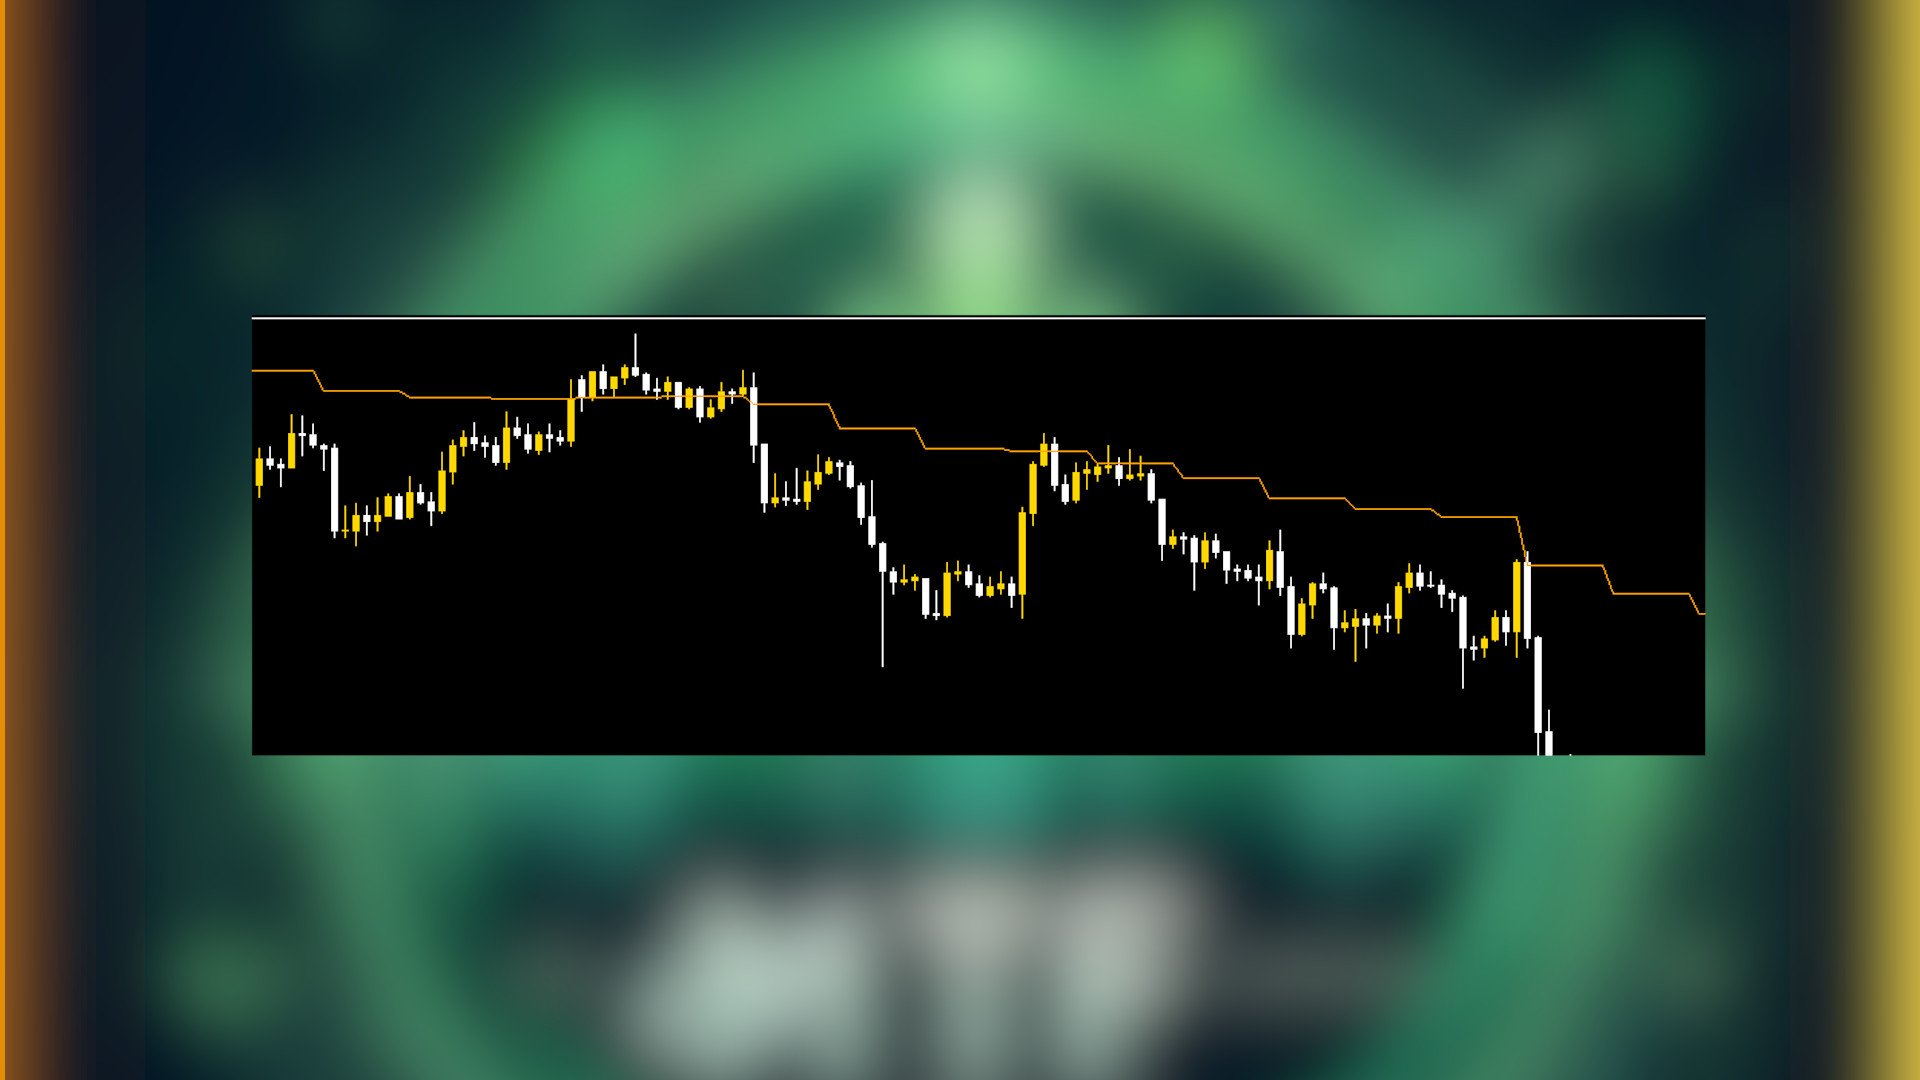
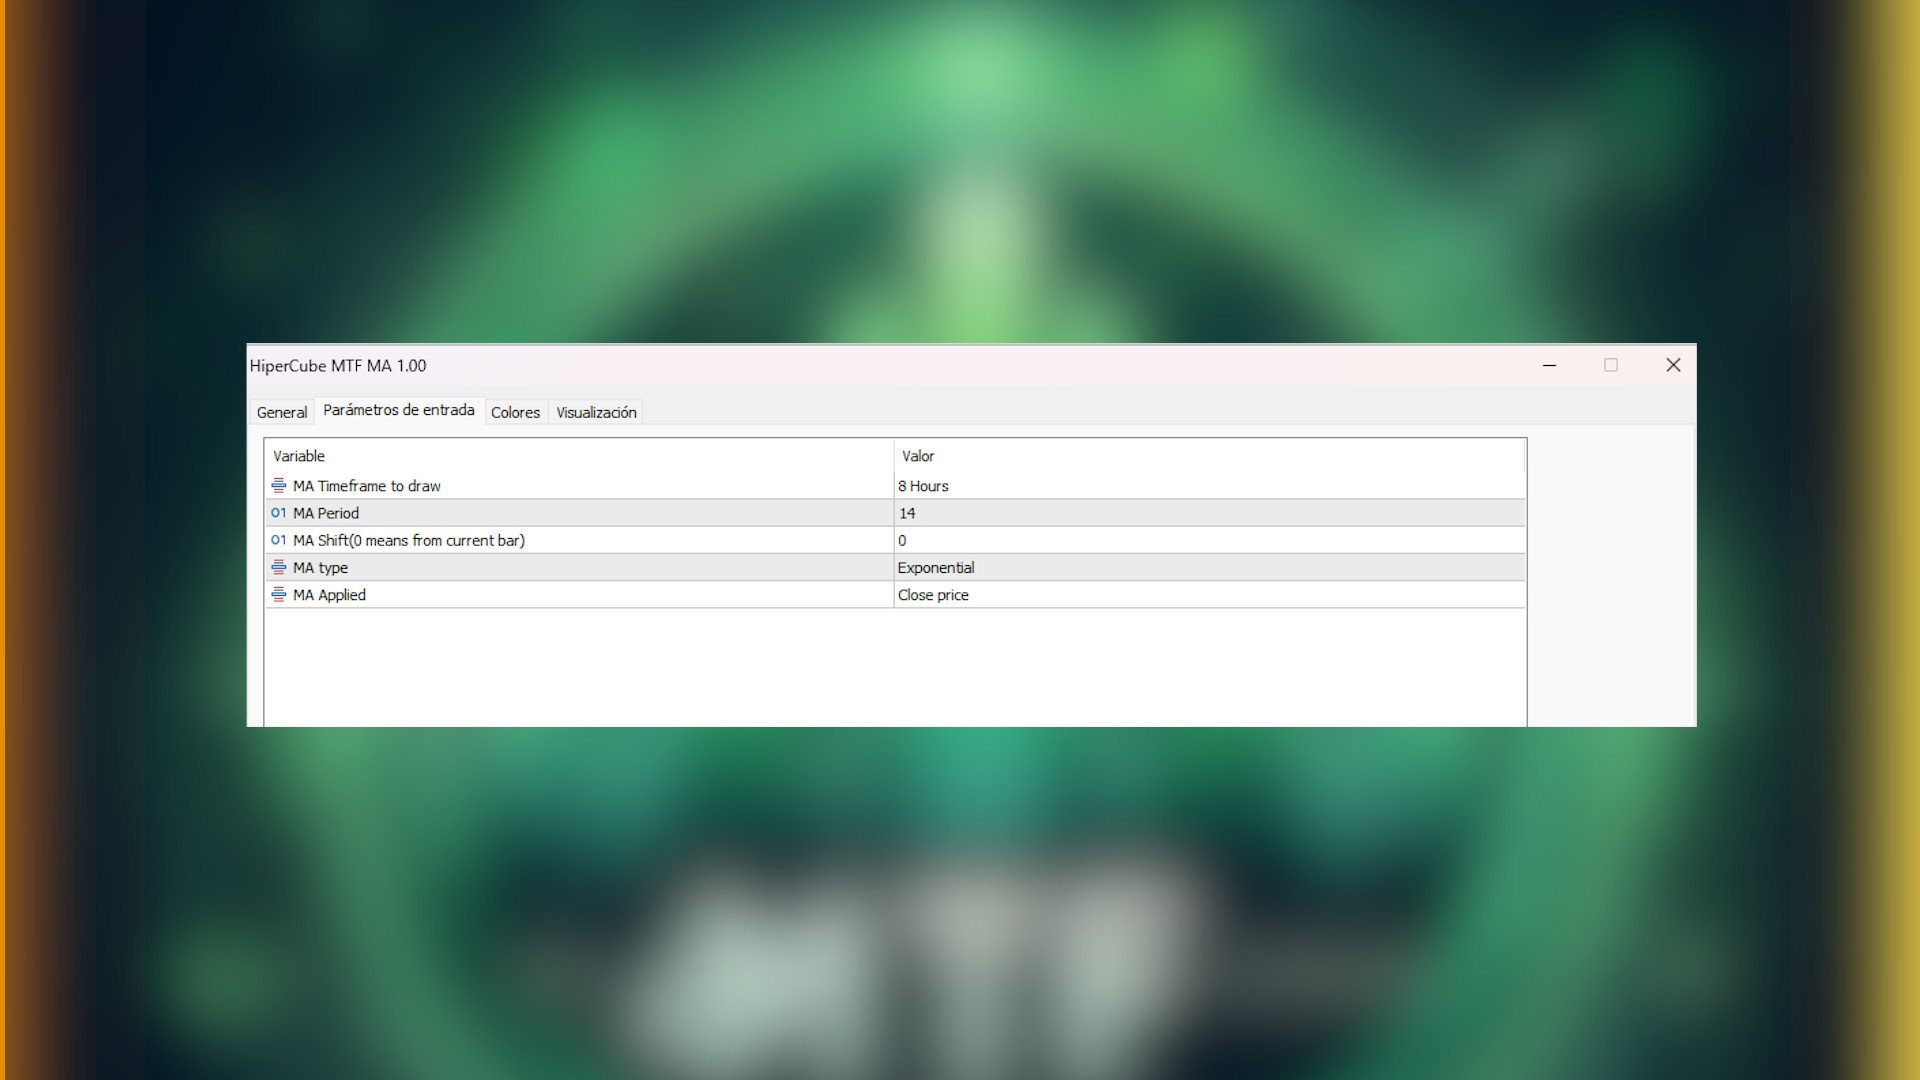
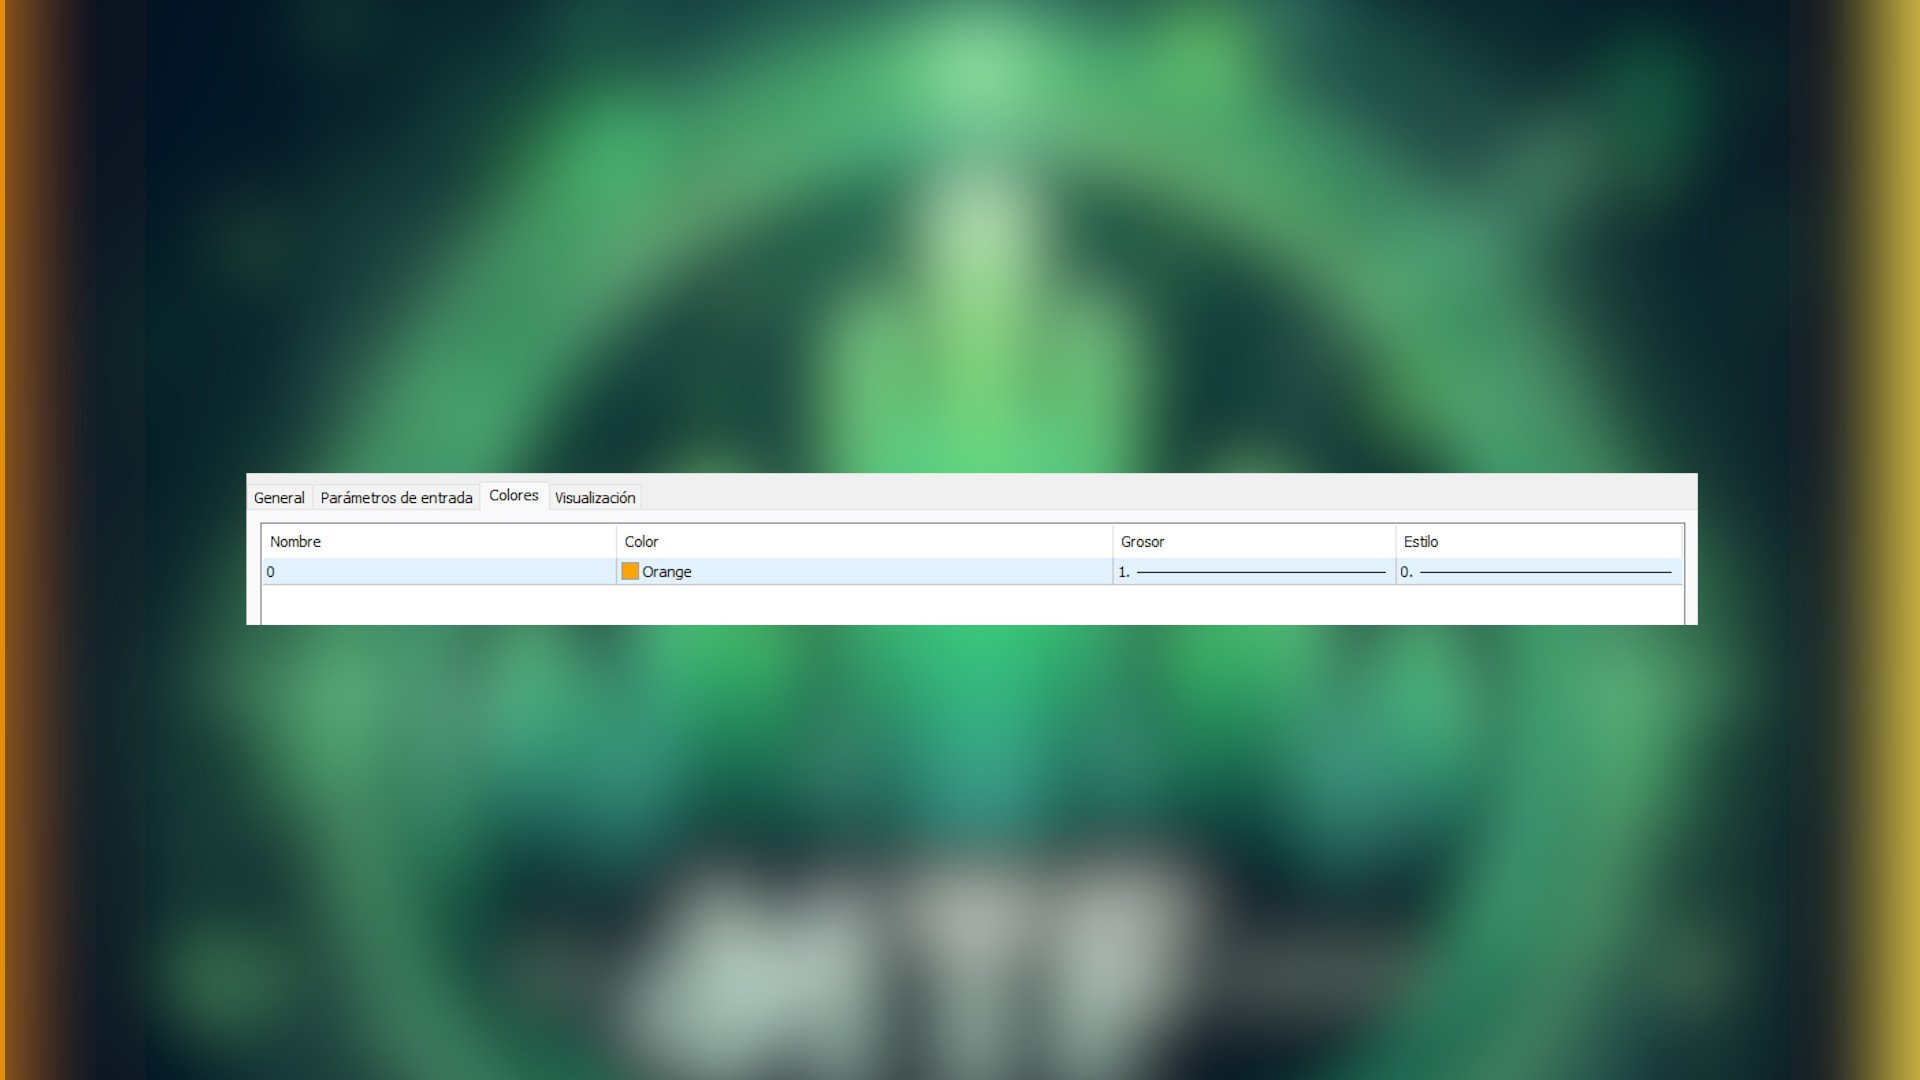
Donchianインディケーターの新バージョンを発表
私たちは、 新しいバージョンのDonchianインディケーター を発表できることを非常に嬉しく思います。最先端の改善と精度を備えた設計で、今や HiperCube Pro Gale に完全対応。このアップデートされたツールは、より効果的なトレードに向けたスムーズな体験を提供します。
このバージョンが画期的な理由:
HiperCube Pro Gale対応 : この最新アップデートは、 HiperCube Pro Gale との統合を念頭に置いて特別に設計されており、トレード戦略における最大の互換性と効率性を保証します。 比類なきパワー : Donchianインディケーターは市場動向を追跡するための人気ツールであり、新バージョンではその性能が最適化されています。 実証済みの効果 : 市場の動きを予測するその能力により、Donchianインディケーターは
HiperCube ADX Histogram is here!
Discount code for 25% off at Darwinex Zero: DWZ2328770MGM This indicators helps you to know if could be a strong trend in the market . ADX is a very popular and usefull indicator, so many top traders reccomends use it as filter to bad trades, or in combinations of other analysis.
With HiperCube ADX you will be a premium exoerience using a beautifula and great indicator for your trading.
FEATURES: Fully Customizable Custom Your Chart! Custom Color to Histogram I
HiperCube Market Profile ! Discount code for 20% off at Darwinex Zero: DWZ2328770MGM_20 A Market Profile is a graphical representation that combines price and time information in the form of a distribution . It displays price information on the vertical scale (y-axis) and volume information on the horizontal scale (x-axis). This chart type provides insights into market activity, allowing traders to visualize and evaluate fair market value in real-time.
Features: Custom Colors Custom Chart Cl
ようこそ! Darwinex Zero 20%割引コード: DWZ2328770MGM_20
今日は、新しい便利なツール、HiperCube SuperVisor をご紹介します。このツールは、異なる EA を同時に実行するときに発生する、難しい監視作業の問題を解決します。このツールにより、1 つのチャートで最大 5 つの EA を同時に表示でき、それぞれのオープン ポジション、買いの利益、売りの利益、合計利益を確認できます。
機能 EA ごとにカスタム名を設定 色は自由に設定可能。完全にカスタマイズ可能! 1 つのチャートで最大 5 つの EA を監視 情報の色は現在の利益に応じて変更されます Chat gptとAIが開発に使用されました
手順 スーパーバイザーとして使用する EA と同じ ID / MAGICNUMBER を設定する必要があります。この番号は、「HiperCube SuperVisor」が各 EA の正確な情報を個別に取得するのに役立ちます。

ユーザーは評価に対して何もコメントを残しませんでした