Mtf Price Percent Movment Dashboard Scanner Signal
- インディケータ
- バージョン: 1.0
- アクティベーション: 5

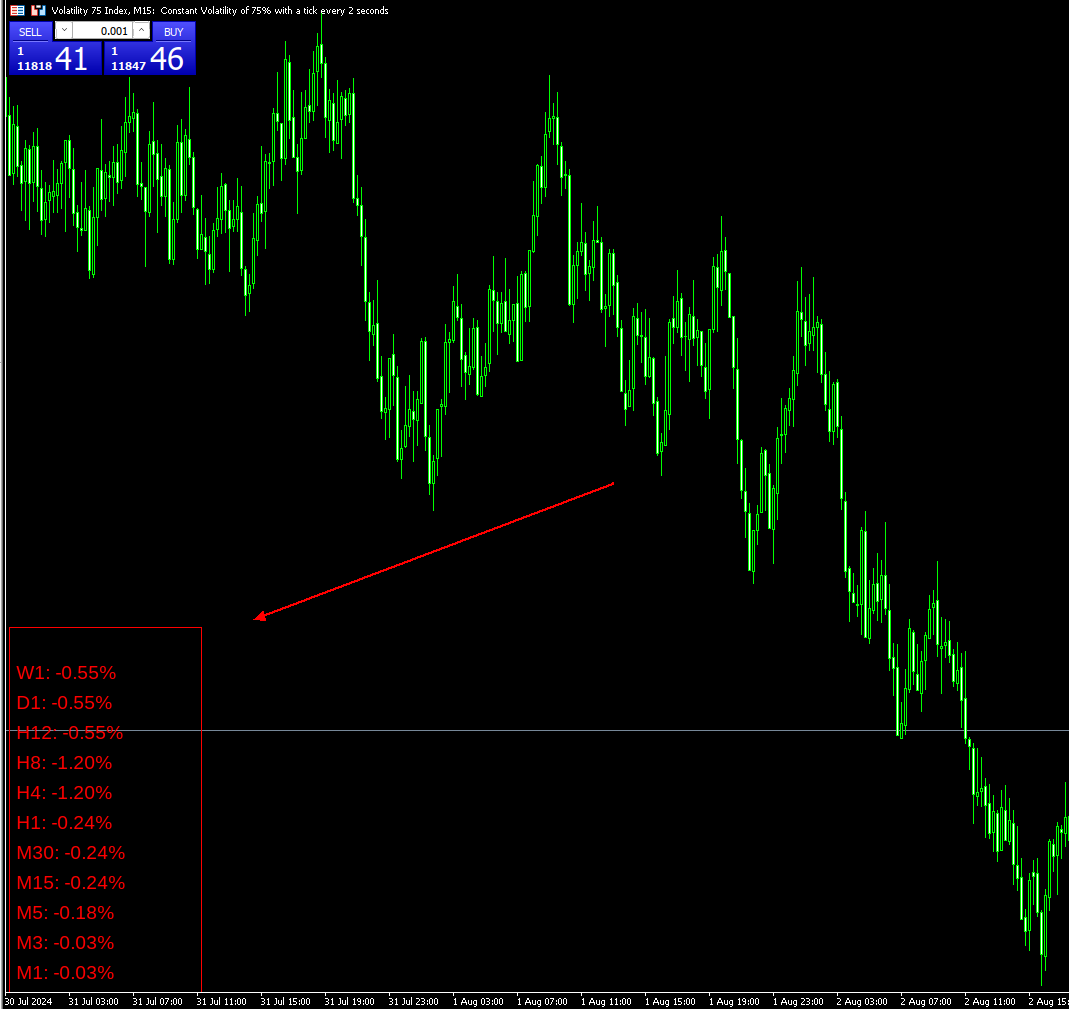
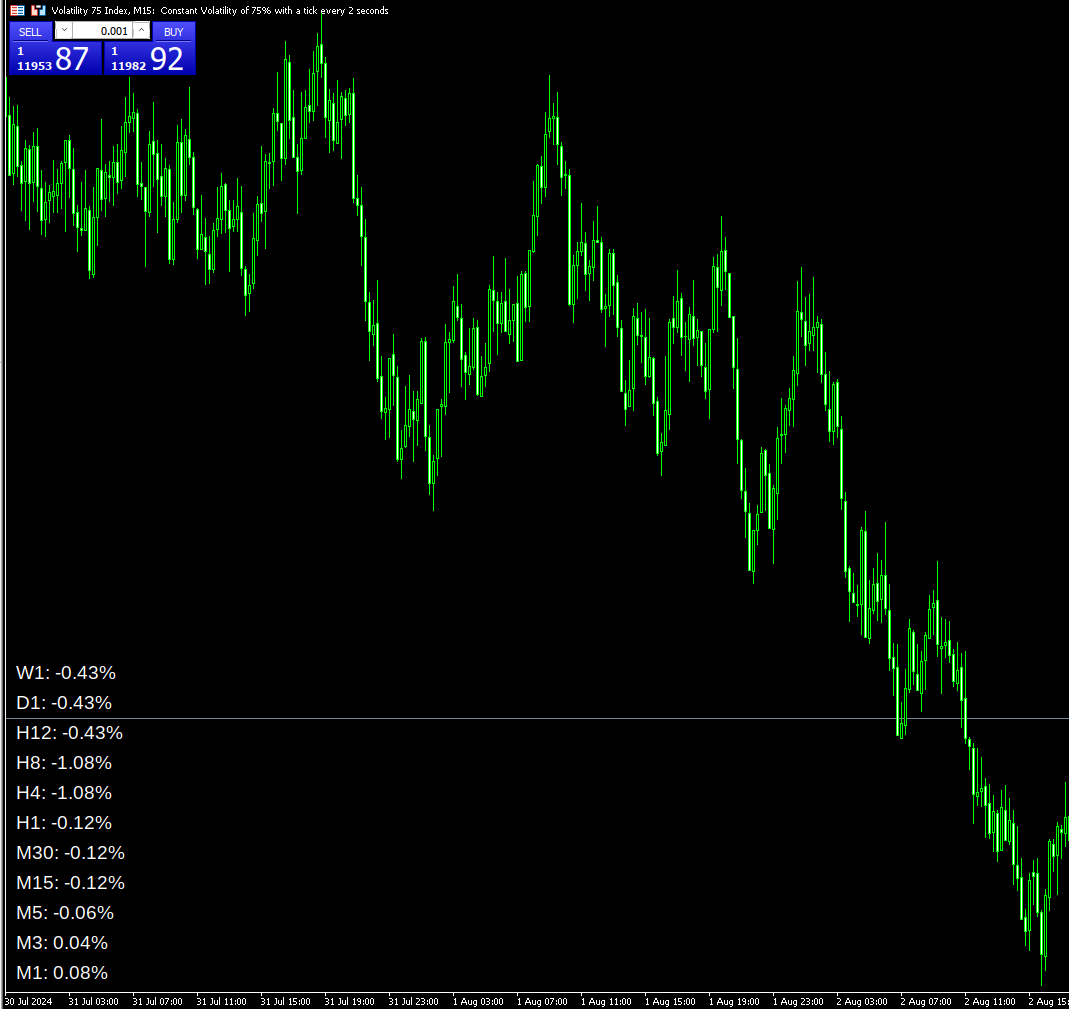
This indicator/dashboard , is place on a single symbol. It shows the percentage of movement withing all time frames from M1 to W1.The text will change green if all % are in the positive for a buy signal.The text will change red if all % are below zero and in negative for a sell signal. There are audible notifications, as well as on screen notifications along with push notifications that can be turned on and ON/OFF in the settings.
This is a sure way to Find trends quickly and efficiently, with a quick look.
Use this indicator to quickly join in on fast paced moves to scalp or trade long term.
It is a powerful tool to help navigate the markets.
This is a sure way to Find trends quickly and efficiently, with a quick look.
Use this indicator to quickly join in on fast paced moves to scalp or trade long term.
It is a powerful tool to help navigate the markets.