The Notifier

Never miss a trading opportunity again and stay up-to-date with latest market developments even while on the go - welcome to The Notifier.

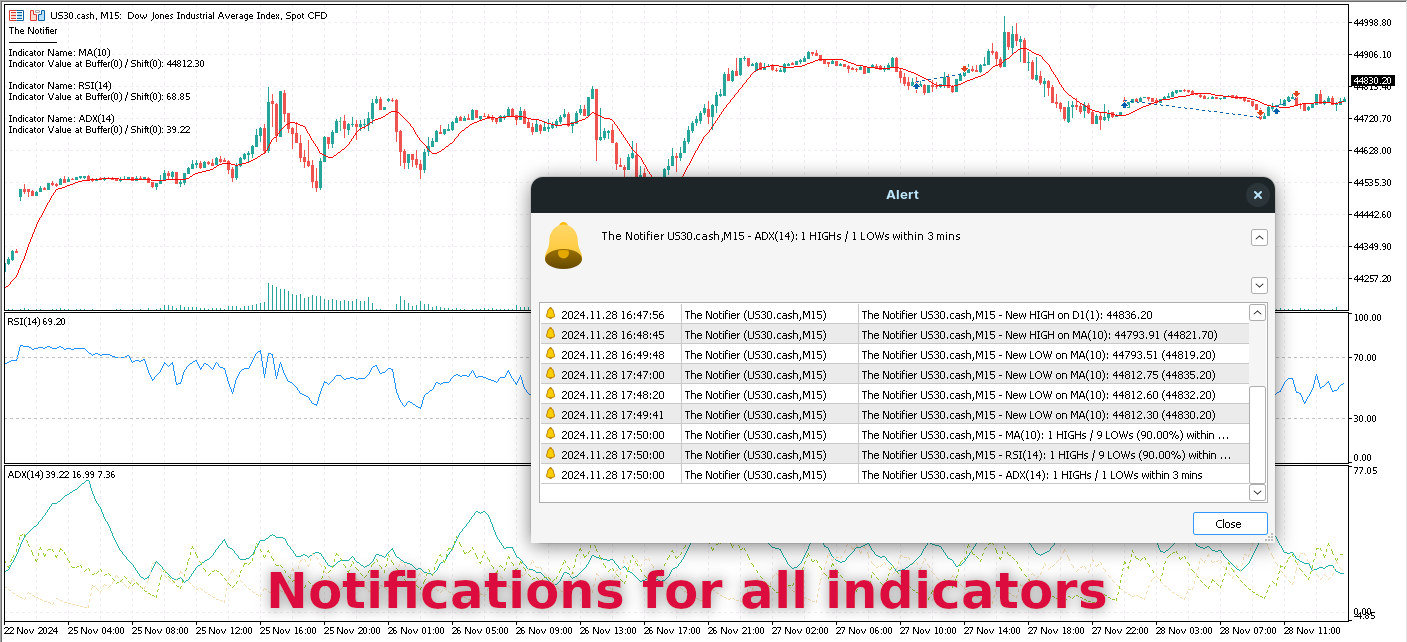
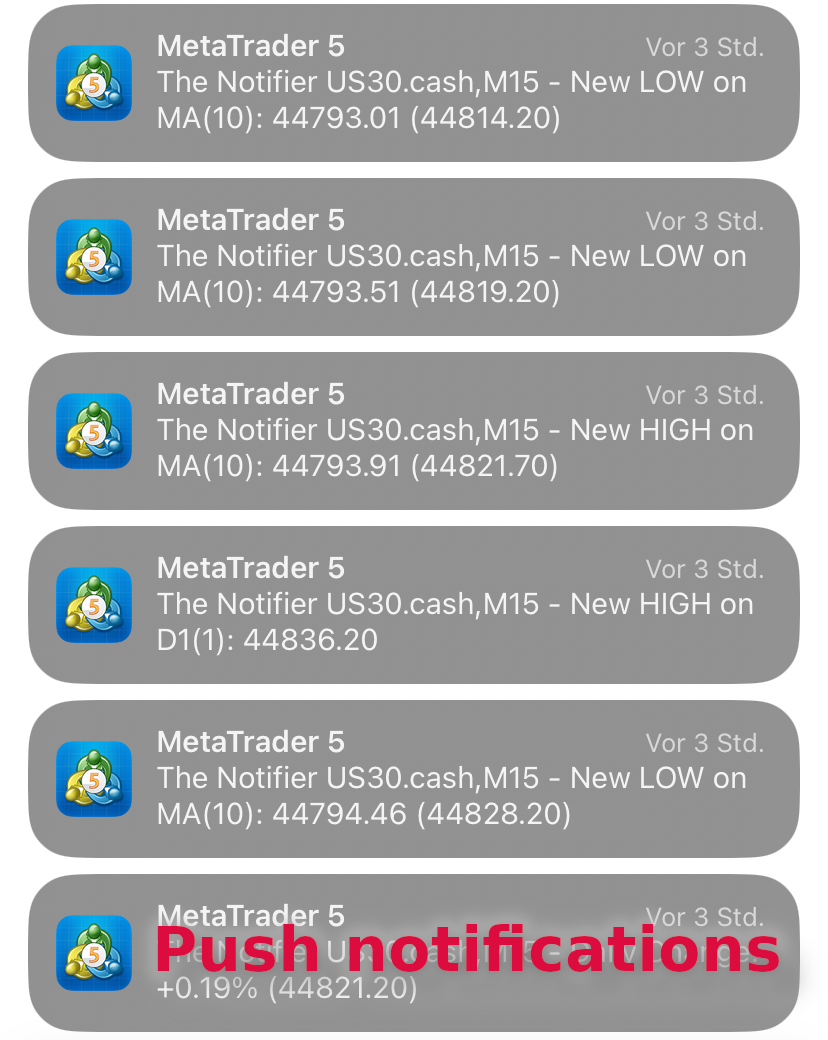
No need to watch your charts all day: receive real-time alerts from all your favorite indicators - by push notifications and on-screen alerts. This tool notifies you on every every new (indicator) high/low, or also regularly with just a summary of the total highs/lows within the last X minutes.

It also comes with its own built-in notifications that can be combined with your indicator alerts or used standalone:

  • High/Low of the last X candles
  • Sentiment based on the last X Bull/Bear candles
  • Daily Change %


Setup

Very easy: just add the indicator to any chart and you are good to go.

By default, you will get notified by on-screen alerts. For push notifications to work, you need to enable and configure them accordingly.


Finding optimal parameters

The tool was created with performance in mind - optimal parameters for your trading style can be found quickly using MetaTrader's Strategy Tester.

  1. In the MetaTrader terminal, set up a chart with your favorite indicator(s) that you want to get notifications for.
  2. From the menu, select Charts > Templates > Save Template
  3. Save the template as The Notifier.tpl
  4. Start the Strategy Tester - the template saved previously will be used automatically.
  5. Alternatively, if you already have a template that you want to use, start the Strategy Tester and select Charts > Templates > YOUR_SAVED_TEMPLATE from the menu after starting the visual backtest.

It is recommended to start with a short date period first and to set the parameter "Show Indicator information on chart = false", as this will speed up testing significantly.

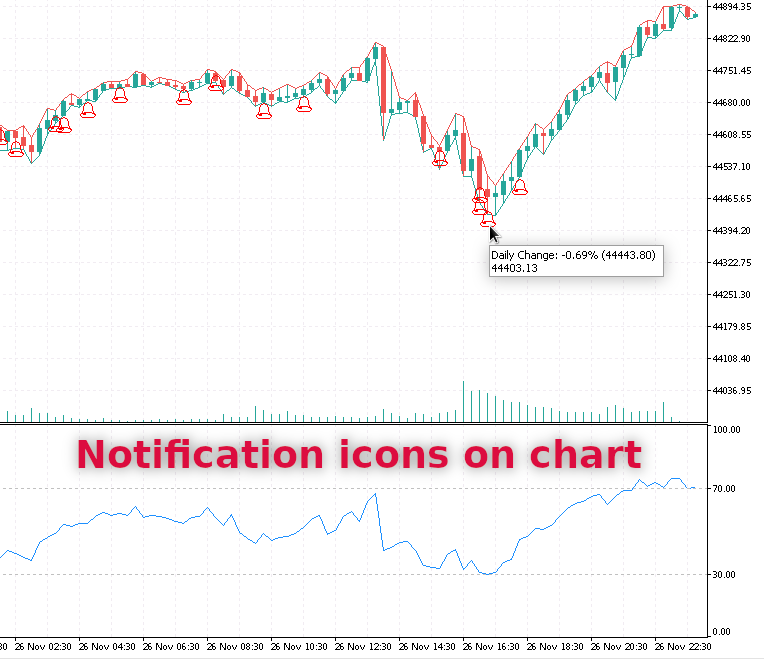
After testing, verify the accuracy of the notifications for your trading style by checking the icons on the chart. If they need more fine-tuning, just run the test again with modified parameters.


Parameters (excerpt)

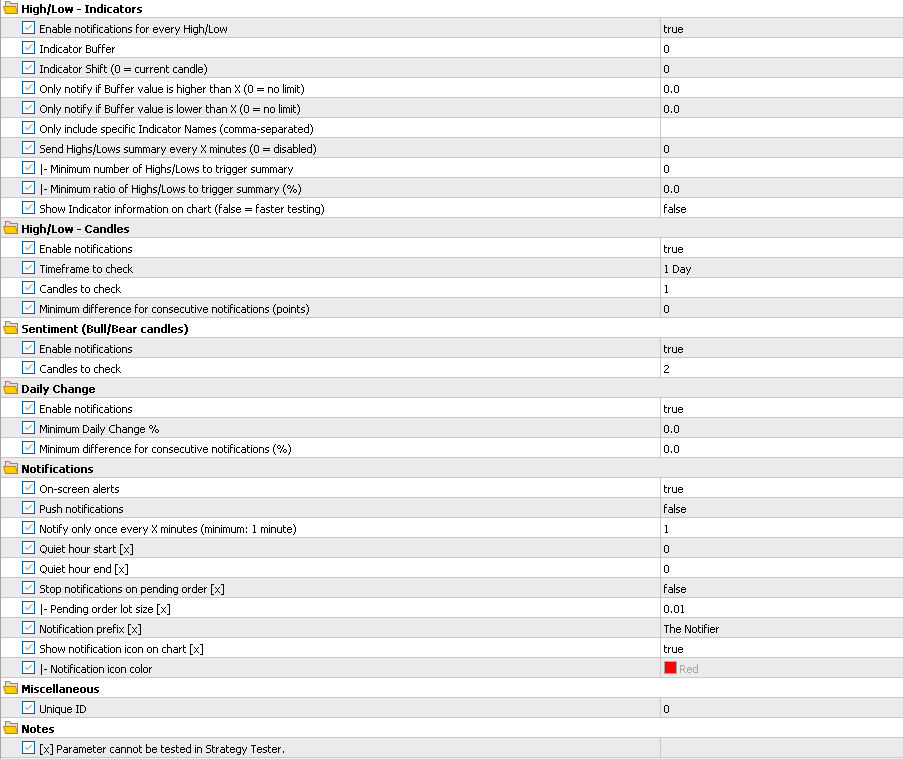
High/Low - Indicators

  • Enable notifications for every High/Low: send a notification for every new indicator high/low. If that gets too noisy, you can also choose to send a summary of the indicator highs/lows instead.
  • Indicator Buffer: which buffer value to use. E.g. RSI only has one buffer (0) that contains the RSI value. ADX has 3 buffers that return the value of the main line (0), DI+ (1) and DI- (2). If you use third-party indicators, please consult the author for the returned buffer values.
  • Indicator Shift: shift relative to the current candle. E.g. if you use the RSI indicator on M15, 0 means the current M15 candle's RSI value, 1 the previous M15 candle's RSI value and so on.
  • Notify only if Buffer value is higher than X: e.g. if you use the RSI indicator and enter 70 here, you will only get notified about new RSI highs > 70.
  • Notify only if Buffer value is lower than X: e.g. if you use the RSI indicator and enter 30 here, you will only get notified about new RSI lows < 30.
  • Buffer value minimum difference for consecutive notifications: set a minimum value here to reduce noise. E.g. if you use the RSI indicator and enter 1 here, you will get notified on new lows of 30, 29, 28 and so on. 
  • Only include specific Indicator Names: by default, you will be notified about all indicators found on the current chart. Here you can filter them, e.g. a value of RSI,MA will only take RSI and Moving Average indicators into account.
  • Send Highs/Lows summary every X minutes: send a summary of the indicator highs/lows within the last X minutes. This is useful to get regular updates on recent market developments.
  • Minimum number of Highs/Lows to trigger summary: set a minimum value here to reduce noise. E.g. a value of 5 means "only send a summary if there were at least 5 highs/lows within the last X minutes".
  • Minimum ratio of Highs/Lows to trigger summary (%): set a minimum value here to reduce noise. E.g. a value of 60 means "only send a summary if there were at least 60% highs/lows within the last X minutes".
  • Show Indicator information on chart: display the identified indicator names and buffer values as a chart comment. Should only be used for initial setup. Disable this in the Strategy Tester to speed up testing significantly.

High/Low - Candles

  • Minimum difference for consecutive notifications (points): set a minimum value here to reduce noise. E.g. a value of 100 and a current high of 1.00000 mean that you will get notified when there is a new high of 1.00100, 1.00200, 1.00300 and so on. Otherwise you would get notified on every new high, which can get quite noisy.

Sentiment (Bull/Bear candles)

  • By definition, a "Bull candle" has a higher close than open price, whereas a "Bear candle" has a lower close than open price. They may be used to analyse sentiment. MetaTrader also colors such candles differently by default - check the chart properties for more details.

Daily Change

  • Minimum Daily Change %: send a notification as soon as the daily change exceeds this value. The value is absolute, so that e.g. 0.5 will notify you when daily change exceeds +0.5%, as well as -0.5%. It can also be displayed as a column in MetaTrader's Market Watch window.
  • Minimum difference for consecutive notifications (%): set a minimum value here to reduce noise. E.g. a value of 0.1 and Minimum Daily Change % = 0.5 mean that you will get notified when the daily change exceeds 0.5%, 0.6%, 0.7% and so on. Otherwise you would get notified when the daily change exceeds 0.5%, 0.51%, 0.52% and so on.

Notifications

  • Minimum number of alerts to trigger notification: set a minimum value here to reduce noise. E.g. a value of 5 means that you will get notified if there were at least 5 alerts withing the last X minutes (e.g. 5 new highs within the last 2 minutes)
  • Quiet hour start + end: e.g. your usual sleep time when you don't want/need notifications. During this time, all notifications will only be logged (+ displayed on the chart), but no notification will be sent.
  • Stop notifications on pending order: this comes handy if you're on the go and forgot to disable the tool. Just add a pending order with a specific lot size - ideally far away from the current market price - and all notifications will be paused until you delete it again. This also works with pending order expiration dates, e.g. you may add a pending order that automatically expires after a vacation.

Miscellaneous

  • Unique ID: usually no need to change this, unless you use multiple The Notifier indicators on one chart, e.g. to monitor different indicator buffers. In this case, every instance should receive a unique, numeric ID.


For any questions, feedback or feature requests just leave a comment or contact me directly.

おすすめのプロダクト
A tool for creating Bill Williams indicators Our tool provides the ability to set Bill Williams indicators on a chart with a mouse click. - The Awesome Oscillator (AO) indicator helps to assess the driving force of the trend. - Alligator indicator — determines the current state of the trend and possible entry and exit points. - Fractals indicator — helps to identify significant levels  - Accelerator Oscillator (AC) indicator — shows the change in trend acceleration. - Market Facilitation Index
FREE
Spearman Rank MTF – Momentum Oscillator with Trend Intelligence The Spearman Rank MTF is a powerful oscillator designed to measure trend strength and direction using a statistical approach based on Spearman's Rank Correlation . This indicator excels at detecting trend changes, key reversals, and overbought/oversold conditions with precision and clear visual cues. Key Benefits Multi-Timeframe (MTF) support – analyze higher timeframes without leaving your current chart. Dual smoothing modes –
Elite Harmony Signals Pro Panoramica Elite Harmony Signals è un indicatore sofisticato di analisi tecnica che visualizza rettangoli dinamici che forniscono zone di trading chiare e segnali di conferma per decisioni migliorate. Caratteristiche Principali Zone Rettangolo Dinamiche Estensione in Tempo Reale : I rettangoli si estendono automaticamente all'azione corrente del prezzo Chiusura Intelligente : I rettangoli si chiudono solo quando appaiono segnali opposti Conferma Visiva : Zone di trading
This is a multi frame stochastic indicator, you can attach any time frame of stoch indicator on one chart. It is very useful if you like to check multi time frame stoch data. If you are interested in EA,click below links to take a look: https://www.mql5.com/en/market/product/80170 https://www.mql5.com/en/market/product/81136 How to use: > Atach the first time frame you want on to the currency pair's chart > Atach the second time frame you want on to the currency pair's   chart > Atach the third
FREE
This is a simple Candle Stick Pattern Indicator, which shows in the current time period all standardisized Patterns in the chart. All Patterns will be calculatet automatically based on standard conditions. Following Candle Stick Patterns are included: Bullish Hammer | Bearish Hammer Bullish Inverted Hammer | Bearish Inverted Hammer Bullish Engulfing | Bearish Engulfing Piercing | Dark Cloud Cover Bullish 3 Inside | Bearish 3 Inside There are only a few settings at the begining to take. Every Pat
FREE
The Average Directional Movement Index indicator drawn using a tick chart. After launching it, wait for enough ticks to come. Parameters: Period - period of averaging. Сalculated bar - number of bars on the chart for the indicator calculation. Buffer indexes: 0 - MAIN_LINE, 1 - PLUSDI_LINE, 2 - MINUSDI_LINE.
HAS RSI Signal — SL/TP自動計算機能付き プロフェッショナル・トレンドインジケーター HAS RSI Signal は、信頼性の高いクラシックな手法と最新のノイズ除去アルゴリズムを融合させた強力なトレーディングツールです。 平均足スムーズド(Heiken Ashi Smoothed) と RSI を組み合わせることで、トレンドの転換点や買われすぎ・売られすぎ圏からの脱出タイミングを正確に捉え、明確なエントリーシグナルを提示します。 主な特徴: 二重のフィルタリング: 平均足スムーズドで市場の「ノイズ」を除去し、RSIで勢い(モメンタム)の強さを確認します。 損切り・利確ラインの自動計算: 単にシグナルを出すだけでなく、ボラティリティ( ATR )に基づいた最適なストップロス(SL) と テイクプロフィット(TP)を自動で算出します。 視覚的な分かりやすさ: シグナルはチャート上にカラーキャンドルとして表示されるため、一目でトレンドを把握でき、取引画面をスッキリと保てます。 充実の通知機能: アラート、音声、スマートフォンへのプッシュ通知機能を搭載。チャンスを逃すこと
FiveStarFX Gold Reversal Edge Professional automated trading solution designed for structured execution and controlled risk management in the Gold market. Built for traders who value discipline, precision, and consistency. Key Features Fully automated trading One trade at a time (controlled exposure) Fixed Stop Loss and Take Profit Smart Break-Even protection Profit lock with buffer Step-based trailing management Spread protection system Works on any broker Trade Management The E
FREE
DhanrangSMC
Dharagauri Niteshkumar Rangani
SMC Indicator for MT5 – Trade Like Institutions Unlock the power of institutional trading with the Smart Money Concepts (SMC) Indicator for MetaTrader 5 . Designed for traders who want to go beyond retail strategies, this advanced tool helps you identify market structure shifts, order blocks, liquidity zones, and fair value gaps with precision and clarity. Key Features: Automatic Market Structure Detection : Instantly spot Breaks of Structure (BOS), CHoCH, and trend shifts. Multi-Timeframe
MiniMACD
Kiyoshi Mizu Miyabi Nori
4.8 (10)
This is just a MACD with multi symbols, multi timeframes, and multi colors. features. different symbols and timeframes from the main chart. draw main line, signal line, and histogram. each line can be erased. the ascent and descent can be distinguished.  Due to the above features, this MACD is suitable for multiple lineups in a single chart. This can be used in the same way as MiniCandles.  
FREE
It is very easy to use the Fibrillar indicator, since the simplest is to look at the chart and act according to the indications of the colored arrows. The algorithm takes into account the measurement of prices, and this method also focuses on measuring each of the price drops (H / C, H / O, LC, LO) - which gives more detailed information, but also more averaged. When calculating this indicator, logarithmic gains are first calculated at the closing price, which allows you to filter out the tren
The Raschke Oscillator (LBR-RSI) indicator is the famous oscillator described in the book " Street Smarts: High Probability Short-term Trading Strategies " This indicator is perfect for a variety of researchs and it can be suitable to be used in combination with your own strategy just for trend trading or range-bound trading. The personal preference is to use it when the trend is not too strong, for example you can combine it with ADX to measure the strength of the trend and use it when ADX is b
Verve AI Reversal Pro Indicator Pro は、極めて高い精度と比類なき市場洞察を求めるトレーダーのための究極のパートナーです。最先端の人工知能を駆使し、価格動向、取引量、ボラティリティをリアルタイムで継続的に分析。反転ポイントが完全に形成される前に高確率の転換点をいち早く捉えます。高度な機械学習アルゴリズムと実績あるテクニカル分析手法をシームレスに融合し、Verve AI は複雑なデータをクリアかつ自信に満ちたシグナルとして提供。激動のマーケットでも安心して取引できます。 Verve AI Reversal Pro Indicator Pro の主な機能: • インテリジェントな反転検知: AIエンジンが数百の価格パターンと統計指標をリアルタイムでスキャンし、大きなトレンド変化の兆候となる微細なシグナルを検出。   • ダイナミックなサポート&レジスタンス表示: 反転が起こりやすい重要なプライスレベルを自動でハイライトし、エントリー・エグジットの正確なポイントを視覚的にガイド。   • 自動適応トレンド分析: トレンド相場でもレンジ相場でも、Verv
The indicator detects divergence signals - the divergences between the price peaks and the MACD oscillator values. The signals are displayed as arrows in the additional window and are maintained by the messages in a pop-up window, e-mails and push-notifications. The conditions which formed the signal are displayed by lines on the chart and in the indicator window. The indicator parameters MacdFast - fast MACD line period MacdSlow - slow MACD line period MacdSignal - MACD signal line period Macd
Overview The OBV Oscillator is a custom technical indicator for MetaTrader 5, designed to provide a clearer visualization of On Balance Volume (OBV) by transforming it into an oscillator. This indicator aims to assist traders in identifying trend confirmations, potential reversals, and momentum shifts by analyzing the relationship between price and volume. It features a customizable Moving Average (MA) for smoothing the OBV, a signal line for generating crossover signals, and an alert system to
FREE
MT5 Session Indicator: Track Global Market Hours with Precision Boost your trading strategy with this FREE Session Indicator for MetaTrader 5 , designed to help you effortlessly identify active trading sessions across global markets. Perfect for forex, stocks, and commodities traders, this tool highlights key market hours (Asian, European, North American, and overlaps) directly on your chart, ensuring you never miss high-liquidity periods. Key Features: Visual Session Overlays : Clear color-c
FREE
Trend Quality Filter Market Structure Overview Identify high-quality market conditions and avoid low-probability phases. This trend indicator acts as a market filter, helping you focus on strong trends while filtering out unstable market behavior . What this indicator does This trend indicator analyzes market structure and trend strength to classify current market conditions into clear and easy-to-understand phases. Instead of generating signals, it works as a market filter, helping trader
A lot of professional traders use high quality divergence signals as a part of their strategy to enter a position. Spotting correct divergences quickly can often be hard, especially if your eye isn’t trained for it yet. For this reason we’ve created a series of easy to use professional oscillator divergence indicators that are very customisable so you get only the signals you want to trade. We have this divergence indicator for RSI, MACD, Stochastics, CCI and OBV. RSI:   https://www.mql5.com/en/
Gecko EA MT5
Profalgo Limited
5 (1)
NEW PROMO: Only a few copies copies available at 349$ Next price: 449$ Make sure to check out our " Ultimate EA combo package " in our   promo blog ! Gecko runs a simple, yet very effective, proven strategy.  It looks for important recent support and resistance levels and will trade the breakouts.  This is a "real" trading system, which means it will use a SL to protect the account.  It also means it will not use any dangerous techniques like martingale, grid or averaging down. The EA shows its
Engulfing with EMAs Indicator Unlock the power of advanced candlestick pattern detection with the Engulfing with EMAs Indicator , a cutting-edge tool designed for MetaTrader 5. This futuristic indicator combines the precision of engulfing pattern analysis with the trend-following strength of Exponential Moving Averages (EMA 21 and EMA 50), empowering traders to identify high-probability setups across all currency pairs and timeframes. Key Features: Comprehensive Engulfing Detection : Detects b
Supply Demand Ranger
Krzysztof Janusz Stankiewic
5 (4)
The indicator draws supply and demand zones. The zone timeframe can be set independently of the chart timeframe. For instance, it is possible to set M5 zones on an H4 chart. The importance of zones can be adjusted using the zone strength parameter. Demand zones are displayed if at least one candle in the range of the zone is entirely above the zone. Similarly, supply zones are displayed if at least one candle within the zone is entirely below the zone.
This indicator scans the 1-3 Trendline pattern . The indicator is a 100 % non repaint low risk breakout system . The patterns are formed around swing high and swing lows which make them a low risk pattern with high reward. PATTERN BACKGROUND The 1-3 Trendline Breakout pattern is formed by four(4) points which are composed of three (3) primary points and the pattern neck. A trendline is always formed by the point 1 and the neck of the pattern . When price breaks out of the trendline formed , it
LevelPAttern MT5 is a technical indicator based on the daily levels and Price Action patterns. The indicator is based on the standard ZigZag indicator + reversal candlestick pattens, such as Star, Hammer (also knows as Pin bar), Engulfing and others. The indicator generates audio and text notifications when a pattern is formed and a level is touched. It also supports sending email and push notifications. Indicator operation features It is suitable for working with any CFD and FOREX trading inst
RBreaker Gold Indicatorsは、金先物の短期日内取引戦略であり、トレンドフォローと日内反転の2つの取引手法を組み合わせたものです。トレンド相場での利益を捉えるだけでなく、相場が反転した際には迅速に利確し、その流れに沿ってポジションを反転させることができます。 この戦略は、アメリカの雑誌『Futures Truth』において、15年連続で最も収益性の高い取引戦略トップ10に選ばれた実績を持ち、非常に長いライフサイクルを誇り、現在も国内外で広く使用・研究されています。 本インディケーターは、2026年の金先物の値動きに対応し、14日間のATR指標に基づいて、ブレイクアウト係数A、観察係数B、リバーサル係数Rをより合理的な値で定義しています。非常に優れたインディケーターであり、安定的な年間収益を実現しています。ぜひおすすめします〜
50+ Candlestick Patterns, Simulated Trading Results, Top Five Performers Candle Analysis extends Candlesticks Pattern Analysis by not only identifying Patterns but also recording the Past Performance of the Patterns. What it Does:- Identifies and plots results on chart Displays Top Patterns for both Bullish and Bearish type.  Log can be printed in experts tab to see Simulated Trading results Displays All or Selected Patterns Alerts on Pattern formation More detailed information in   Blog
ZigZag_3LZZ — 3レベルのジグザグインジケーター ZigZag_3LZZインジケーターは、金融市場のテクニカル分析のために設計されています。チャート上に異なる期間(5、13、34)を持つ3本の色分けされたジグザグラインを表示し、トレーダーに以下の機能を提供します:     重要な価格反転レベルの視覚的な識別     重要でない価格変動と市場ノイズのフィルタリング     最新の極値に基づくトレンドラインの描画     フィボナッチレベルの自動計算(0.24、0.382、0.5、0.618、0.76)     現在のサポートレベルとレジスタンスレベルの特定     新しい極値出現時の即時反転シグナルの取得     単一チャートでの3つの時間軸の視覚的比较      適用場面      このインジケーターは様々な取引戦略で使用されます:     トレンド取引 — 3本の異なる方向のジグザグラインによるトレンド方向の判断     水平線取引 — サポート/レジスタンスレベルからの市場参入     反転点の探索 — 新たな極値形成時のシグナル    
マルチタイムフレーム対応、カスタマイズ可能なビジュアルシグナル、設定可能なアラートシステムを備えたBalance of Power(BOP)インジケーター。 フリーランスプログラミングサービス、アップデート、その他のTrueTL製品は私の MQL5プロフィール からご利用いただけます。 フィードバックとレビューを大歓迎します! BOPとは? Balance of Power(BOP)は、価格の変化をバーの値幅と比較することで、買い手と売り手の強さを測定するオシレーターです。インジケーターは(終値 - 始値)/(高値 - 安値)として計算され、その後Simple Moving Average(SMA)で平滑化されます。 BOP値は-1から+1の間で変動します。正の値は買い手が強いことを示し(終値が始値より高い)、負の値は売り手が強いことを示します(終値が始値より低い)。値の大きさは動きの強さを示します。BOPは買い圧力と売り圧力のバランスを示すことで、市場の強さと潜在的な反転を識別するのに役立ちます。 特徴: 矢印と垂直線によるビジュアルシグナルマーカー 設定可能なトリガーを持つ3
FREE
Short Description Swing Timing Breakout EA is a smart Expert Advisor for MetaTrader 5 that combines trend filtering, momentum timing, and dynamic risk management to capture high-probability swing and breakout opportunities. Full Description Swing Timing Breakout EA is a professional trading robot designed for MetaTrader 5, suitable for traders who want a balance between automation, control, and disciplined risk management. This EA uses a trend-following and momentum confirmation approach ,
AlphaGain AI – 次世代AIによるエリートトレーディング精度 AlphaGain AIは、MetaTrader 5向けに設計された高性能エキスパートアドバイザー(EA)で、AIと過去10年以上のデータを活用し、マーケット環境に応じた自動適応戦略で正確なシグナルを提供します。 主な特徴: AIコア:ローソク足パターン、ボラティリティゾーン、モメンタムロジックを解析; 10年以上のヒストリカルデータで学習; 高度なエントリー/エグジットロジック:SL/TP、トレーリングストップ、ブレイクイーブン、ボラティリティに応じたTP; 資金保護:ドローダウン制限、エクイティガード、最大スプレッドフィルター、取引時間制限; 完全自動運用:人間の介入不要; 低レイテンシー対応:ECN環境に最適化。 推奨設定: 通貨ペア:EUR/USD 時間足:15分(M15) 最低残高:100ドル アカウントタイプ:ECNまたはRaw Spread レバレッジ:1:100以上 AlphaGain AIを選ぶ理由: 簡単導入:.ex5ファイル、.set設定、PDFガイド付属;
Energy Gravity — User Guide Energy Gravity is a structural market analysis tool that visualizes the hidden energetic geometry of price. The indicator treats the market as a dynamic field of distributed mass, where past price interaction forms: attraction zones equilibrium areas structural tension probable return directions Core concept: Price does not move randomly — it interacts with accumulated liquidity and time. Energy Gravity shows where equilibrium is located, where liquidity is concentrat
このプロダクトを購入した人は以下も購入しています
SuperScalp Pro
Van Minh Nguyen
4.63 (24)
SuperScalp Pro – 高度なマルチフィルタースキャルピングインジケーターシステム SuperScalp Pro は、クラシックな Supertrend と複数のインテリジェント確認フィルターを組み合わせた高度なスキャルピングインジケーターです。M1 から H4 まで複数の時間足で効率的に動作し、XAUUSD、BTCUSD、主要 Forex 通貨ペア向けに最適化されています。 このインジケーターは明確な Buy / Sell シグナルを提供し、ATR に基づいてエントリー価格、Stop Loss、Take Profit を自動計算します。Fibonacci Take Profit 機能により、重要な価格帯で早期決済し、到達時に通知を送信します。 初期設定では Fibonacci Take Profit が有効化されており、より安定した取引体験を重視しています。チャートに適用するだけですぐ利用可能です。上級者向けに、すべてのパラメータは自由にカスタマイズできます。 EMA、RSI、ADX、Volume、VWAP、Bollinger Bands、MACD Divergence な
このインジケーターを購入された方には、以下の特典を 無料 で提供しています: 各トレードを自動で管理し、ストップロスとテイクプロフィットを設定し、戦略ルールに基づいてポジションを決済する補助ツール 「Bomber Utility」 様々な銘柄に合わせたインジケーターの設定ファイル(セットファイル) 「最小リスク」、「バランスリスク」、「待機戦略」 の3つのモードで使用できる Bomber Utility 用の設定ファイル このトレーディング戦略をすぐに導入・設定・開始できる ステップバイステップのビデオマニュアル ご注意: 上記の特典を受け取るには、MQL5のプライベートメッセージシステムを通じて販売者にご連絡ください。 オリジナルのカスタムインジケーター 「Divergence Bomber(ダイバージェンス・ボンバー)」 をご紹介します。これは、MACDのダイバージェンス(乖離)戦略に基づいた 「オールインワン」型のトレーディングシステム です。 このテクニカルインジケーターの主な目的は、価格とMACDインジケーターの間に発生するダイバージェンスを検出 し、将来の価格の動きを示す
Entry In The Zone and SMC Multi Timeframe is a real-time 2-in-1 market analysis tool that combines market structure analysis and a No Repaint BUY / SELL signal system into a single indicator, built on Smart Money Concepts (SMC) — a widely adopted framework used by professional traders to understand market structure. This indicator helps you see the market more clearly, make decisions based on structure rather than guesswork, and focus on high-probability zones where price is more likely to react
Power Candles V3 - 自己最適化型強弱インジケーター Power Candles V3は 、通貨や銘柄の強さを、適用されたすべてのチャート上で実行可能なトレードプランに変換します。単にローソク足を色分けするだけでなく、バックグラウンドでリアルタイムの自動最適化を実行し、目の前の銘柄に対して最適なストップロス、テイクプロフィット、およびシグナルの閾値を提示します。ワンクリックで実取引に適用でき、エントリーポイント、ストップロス、テイクプロフィットのラインが正確な価格位置にチャート上に表示され、方向性を示すアラートがリアルタイムで発動します。 このツールは、Stein Investmentsのエコシステムの一部です。  18種類以上のツールをすべて閲覧し、AIを活用したセットアップの推奨事項を入手し、  https://stein.investments でコミュニティに参加しましょう クローズしたバーごとに3,000回以上のトレードシミュレーション。9つの強さの状態。2つの戦略を並行してテスト。勝率の高い設定をワンクリックで適用。 なぜこれが必要なのか ほとんどの強
SignalTech MT5 is a fully rule based trading system for EURUSD, USDCHF, USDJPY, AUDUSD, NZDUSD, EURJPY, AUDJPY, NZDJPY, CADJPY.  All the winning trades with chart setups are published on the comments page. 2025-12 1174 Pips 2026-01 2624 Pips 2026-02 2937 Pips 2026-03 2165 Pips 2026-04 2243 Pips It can generate signals with Buy/Sell Arrows and Pop-Up/Sound Alerts. Each signal has clear Entry and Stop Loss levels, which should be automatically flagged on the chart, as well as potential Targets 1,
ご紹介     Quantum Breakout PRO は 、ブレイクアウト ゾーンの取引方法を変革する画期的な MQL5 インジケーターです。 13年以上の取引経験を持つ経験豊富なトレーダーのチームによって開発されました。     クォンタム ブレイクアウト プロ   は、革新的でダイナミックなブレイクアウト ゾーン戦略により、あなたのトレーディングの旅を新たな高みに押し上げるように設計されています。 クォンタム ブレイクアウト インジケーターは、5 つの利益ターゲット ゾーンを備えたブレイクアウト ゾーン上のシグナル矢印と、ブレイクアウト ボックスに基づいたストップロスの提案を提供します。 初心者トレーダーにもプロのトレーダーにも適しています。 量子EAチャネル:       ここをクリック 重要!購入後、インストールマニュアルを受け取るためにプライベートメッセージを送ってください。 推奨事項: 時間枠: M15 通貨ペア: GBPJPY、EURJPY、USDJPY、NZDUSD、XAUUSD アカウントの種類: ECN、Raw、またはスプレッドが非常に低い R
Gann Made Easy   は、ミスター・ギャンの理論を使用した取引の最良の原則に基づいた、プロフェッショナルで使いやすい外国為替取引システムです。 W・D・ガン。このインジケーターは、ストップロスとテイクプロフィットレベルを含む正確な買いと売りのシグナルを提供します。 PUSH通知を利用して外出先でも取引可能です。 ご購入後、取引方法の説明と優れた追加インジケーターを無料で入手するには、私にご連絡ください! おそらく、ギャンの取引手法についてはすでに何度も聞いたことがあるでしょう。通常、ギャンの理論は初心者のトレーダーだけでなく、すでにある程度の取引経験がある人にとっても非常に複雑なものです。なぜなら、ギャンの取引手法は理論的にはそれほど簡単に適用できるものではないからです。私はその知識を磨き、最良の原則を私の外国為替インジケーターに組み込むために数年を費やしました。 このインジケーターは非常に簡単に適用できます。必要なのは、それをチャートに添付し、簡単な取引推奨事項に従うだけです。このインジケーターは常に市場分析の仕事を行い、取引の機会を探します。適切なエントリーポイントを検
RelicusRoad Pro: 定量的市場オペレーティングシステム 【期間限定】無制限アクセス 70% OFF - 2,000人超のトレーダーと共に なぜ多くのトレーダーは「完璧な」インジケーターを使っても失敗するのでしょうか? それは、文脈を無視して 単一の概念 だけでトレードしているからです。文脈のないシグナルは単なるギャンブルです。勝ち続けるには、 根拠の重なり(コンフルエンス) が必要です。 RelicusRoad Proは単なる矢印インジケーターではありません。完全な 定量的市場エコシステム です。独自のボラティリティモデリングを用いて、価格が推移する「適正価値の道(Fair Value Road)」をマッピングし、ノイズと真の構造的ブレイクを判別します。 推測はやめましょう。機関投資家レベルの「ロード・ロジック」でトレードを。 コアエンジン:「Road」アルゴリズム システムの中心となる Road Algo は、市場環境にリアルタイムで適応するダイナミックなボラティリティチャネルです。 安全ライン(平衡点) と、価格が数学的に反転しやすい 拡張レベル を投影します。 Si
MetaTrader 5 向けスマート多層ブレイクアウト&プルバック検出器 「スマート・シンプル・ファスト!」 高確率のブレイクアウトエントリーを見逃すことにうんざりしていませんか? 複数のチャートを何時間もスキャンし、ブレイクアウトをトレンド方向と通貨のモメンタムに合わせようとして、それでも動きを逃してしまうことはありませんか? Break Pullback は、1つのインジケーターでそのすべてを解決します。 Break Pullback とは何ですか? Break Pullback は、マーケットストラクチャー、ブレイクアウト、トレンド継続のセットアップを取引するトレーダー向けに特別に設計されたプロフェッショナルグレードの MetaTrader 5 インジケーターです。 リアルタイムで複数の通貨ペアにわたるブレイクとプルバックの形成を自動的に検出し、3層の確認を通じてすべてのシグナルをフィルタリングします: ストラクチャラルブレイクアウト検出 — チャート上の主要なブレイクレベルを特定 HTF 日足バイアス — エントリーを支配的な日足トレンド方向に合わせる 通貨強弱指数 —
このインジケーターを購入すると、プロ仕様のトレードマネージャーを無料で差し上げます。 まず第一に、このトレーディングシステムがノンリペイント、ノンリドロー、ノンラグのインジケーターであることを強調する価値がある。これにより、手動取引とロボット取引の両方に理想的なものになっています。 オンラインコース、マニュアル、プリセットのダウンロード。 「スマートトレンドトレーディングシステム MT5」は、新規および経験豊富なトレーダー向けにカスタマイズされた包括的なトレーディングソリューションです。10以上のプレミアムインジケーターを組み合わせ、7つ以上の堅実なトレーディング戦略を備えており、多様な市場状況に対応する多目的な選択肢となっています。 トレンドフォロー戦略:トレンドを効果的に乗り越えるための正確なエントリーとストップロス管理を提供します。 リバーサル戦略:潜在的なトレンドの反転を特定し、トレーダーがレンジ相場を活用できるようにします。 スキャルピング戦略:高速で正確なデイトレードおよび短期取引のために設計されています。 安定性:すべてのインジケーターはノンリペイント、ノンリドロー、ノ
Azimuth Pro
Ottaviano De Cicco
5 (7)
Azimuth Pro V2:MT5向けシンセティック・フラクタル構造分析と確認済みエントリー 概要 Azimuth Pro は Merkava Labs によるマルチレベルスイング構造インジケーターです。4つのネストされたスイングレイヤー、スイングアンカーVWAP、ABCパターン検出、3タイムフレーム構造フィルタリング、そして確定バーでの確認済みエントリー — 1つのチャートで、ミクロスイングからマクロサイクルまでを網羅するワークフロー。 これはブラインドシグナル製品ではありません。ロケーション、コンテキスト、タイミングを重視するトレーダーのための構造ファーストワークフローです。 V2発売記念オファー — Azimuth Pro V2をUSD 399で(次の100本)。最終価格:USD 499。 1. V2での変更点 シンセティック・マルチタイムフレームエンジン 上位タイムフレーム分析をMeridian Proと同じ独自のシンセティックアーキテクチャで一から再構築。よりクリーンなHTFコンテキスト、安定したライブ動作、従来のMTF同期問題なし。シンセティックエンジンは 固定比率タ
FX Trend NG:次世代マルチマーケット・トレンドインテリジェンス 概要 FX Trend NG は、複数の時間足に対応したプロフェッショナル向けトレンド分析およびマーケット監視ツールです。 市場全体の構造を数秒で把握することができます。 複数のチャートを切り替える必要はありません。どの銘柄がトレンド中なのか、どこでモメンタムが弱まっているのか、そしてどの時間足で強い整合性があるのかを瞬時に確認できます。 ローンチ特別オファー – FX Trend NG を $30(6ヶ月) または $80 永久ライセンス でご利用いただけます。 すでに Stein Investments のユーザーですか? -> メッセージを送信 して、プライベートグループへアクセスしてください。 セットアップや詳細情報が必要ですか? -> Stein Investments 公式ページ をご覧ください。 1. FX Trend NG が他と異なる理由 3ステート・トレンドロジック ― Buy と Sell だけではない • 多くのインジケーターは Buy または Sell の2状態のみを表示します。
Quantum TrendPulse を ご紹介します。これは、   SuperTrend   、   RSI   、および Stochastic のパワーを 1 つの包括的なインジケーターに組み合わせて、取引の可能性を最大限に引き出す究極の取引ツールです。精度と効率を求めるトレーダー向けに設計されたこのインジケーターは、市場のトレンド、勢いの変化、最適なエントリー ポイントとエグジット ポイントを自信を持って特定するのに役立ちます。 主な特徴: SuperTrend 統合: 現在の市場動向に簡単に追従し、収益性の波に乗ることができます。 RSI精度: 買われすぎと売られすぎのレベルを検出し、市場の反転のタイミングに最適で、SuperTrendのフィルターとして使用されます。 確率的精度: 確率的振動を活用して、変動の激しい市場で隠れたチャンスを見つけます。SuperTrend のフィルターとして使用されます。 マルチタイムフレーム分析:   M5 から H1 または H4 まで、さまざまなタイムフレームで市場を常に把握します。 カスタマイズ可能なアラート: カスタム取引条件が満たされ
まず第一に、この取引インジケーターは再描画されず、再描画されず、遅延しないことを強調する価値があります。これにより、手動取引とロボット取引の両方に理想的なものになります。 ユーザーマニュアル:設定、入力、戦略。 アトミックアナリストは、価格の強さとモメンタムを利用して市場でより良いエッジを見つけるためのPA価格アクションインジケーターです。ノイズや誤ったシグナルを除去し、取引ポテンシャルを高めるための高度なフィルターを備えています。複雑なインジケーターの複数のレイヤーを使用して、アトミックアナリストはチャートをスキャンし、複雑な数学的計算をシンプルなシグナルと色に変換します。これにより、どのような初心者トレーダーでも理解して使用し、一貫した取引の決定を行うことができます。 「アトミックアナリスト」は、新規および経験豊富なトレーダー向けにカスタマイズされた包括的な取引ソリューションです。プレミアムインジケーターとトップノッチの機能を1つの取引戦略に組み合わせ、すべてのタイプのトレーダーにとって汎用性のある選択肢にします。 デイリートレーディングとスキャルピング戦略:高速で正確なデイ
まず第一に、この取引ツールはノンリペイント、ノンリドロー、ノンラグの指標であり、プロの取引に理想的ですことを強調する価値があります。 オンラインコース、ユーザーマニュアル、デモ。 スマートプライスアクションコンセプトインジケーターは、新米から経験豊富なトレーダーまで、非常 に強力なツールです。Inner Circle Trader AnalysisやSmart Money Concepts Trading Strategiesなど、20以上の有用な指標を1つに組み合わせています。このインジケーターはスマートマネーコンセプトに焦点を当て、大手機関の取引方法を提供し、彼らの動きを予測するのに役立ちます。 特に、流動性分析に優れており、機関がどのように取引しているかを理解しやすくしています。市場のトレンドを予測し、価格の動きを慎重に分析するのに優れています。機関の戦略とトレードを合わせることで、市場の動向についてより正確な予測ができます。このインジケーターは多目的であり、市場構造を分析し、重要な注文ブロックを特定し、さまざまなパターンを認識するのに優れています。 このインジケーター
BTMM State Engine Pro is a MetaTrader 5 indicator for traders who use the Beat The Market Maker approach: Asian session context, kill zone timing, level progression, peak formation detection, and a multi-pair scanner from a single chart. It combines cycle state logic with a built-in scanner dashboard so you do not need the same tool on many charts at once. What it does Draws the Asian session range; session times can follow broker server offset or be set in inputs. Tracks level progression (L
まず正直に言いましょう。 どんなインジケーターも、それ単体であなたを利益化させることはできません。もしそう言う人がいるなら、それは夢を売っているだけです。完璧な売買シグナル(矢印)を表示するインジケーターは、いくらでも“完璧に見せる”ことができます。正しい過去の区間を拡大して、勝ちトレードだけを切り取ればいいだけです。私たちはそれをしません。 SMC Intraday Formula はツールです。 市場構造を読み取り、最も高い確率の価格ゾーンを特定し、今この瞬間のスマートマネーの痕跡をシンプルな言葉で正確に示します。最終判断はあなたが行います。トレードを実行するのもあなたです。しかし今は「希望」ではなく「精度」でエントリーできます。 私たちはこのインジケーターを、ゴールド(XAUUSD)および主要FX通貨ペアで約3年間、日々のスキャルピングに使用してきました。M1、M5、M15、M30の主要ツールです。これは未来を予測しようとするのではなく、今まさに形成されている高確率セットアップを示し、その理由を説明します。 他のすべてのインジケーターと何が違うのか? ほとんどのトレーディングイ
Market Structure Order Block Dashboard MT5 は、市場構造と主要な価格反応ゾーンをチャート上で直接読み取りたいトレーダー向けに設計された MT5 インジケーターです。BOS、ChoCH、オーダーブロック、Fair Value Gap (FVG)、流動性、Kill Zones、Volume Profile、そして素早い分析のためのコンパクトなダッシュボードを組み合わせています。 本インジケーターは、市場構造、ICT、Smart Money の概念を意思決定の枠組みとして使用するトレーダーを対象としています。トレンド継続、反転の可能性、価格の不均衡、流動性ターゲット、注目ゾーンをより構造的に特定する助けとなります。 購入者向けの付属リソース 購入後、MQL5 のプライベートメッセージにてご依頼いただくと、完全な PDF ユーザーガイドとパラメータ設定のヒントを提供いたします。MQL5 のプライベートメッセージによる直接的な技術サポート。 バージョン 1.20 では 2 つの重要な追加機能があります: Pending BOS / Pending Cho
多くの矢印インジケーターは、シグナルだけを表示して、その後の判断をすべてトレーダーに任せてしまいます。KT Alpha Hunter Arrows は、完整なトレードプランをチャート上に提示します。 各シグナル矢印が表示されるたびに、エントリーライン、ストップロス、4つのテイクプロフィット水準、そして現在の銘柄と時間足が今トレードに値するかどうかを示すリアルタイムのエッジ判定が、すでに描画された状態で表示されます。付属の Trade Manager EA は、あなたが手動でエントリーした後の実行管理を担当し、相場が荒れて判断がぶれやすい場面でも規律あるトレードを保ちやすくします。リペイントなし。確定足シグナルのみ。Forex、ゴールド、指数、その他あなたが取引するあらゆる銘柄に対応します。 主な機能 リペイントしない買い矢印と売り矢印を、足の確定後にのみ表示。 各シグナルに、エントリーライン、構造的ストップロス、4つのテイクプロフィット水準を表示。 Edge Dashboard が、現在のチャートで買いセットアップと売りセットアップを別々に評価。 判定システム:No Edge、Mar
優れたテクニカルインジケーター「Grabber」をご紹介します。これは、すぐに使える「オールインワン」トレーディング戦略として機能します。 ひとつのコードに、市場のテクニカル分析ツール、取引シグナル(矢印)、アラート機能、プッシュ通知が強力に統合されています。 このインジケーターを購入された方には、以下の特典を無料で提供します: Grabberユーティリティ:オープンポジションを自動で管理するツール ステップバイステップのビデオマニュアル:インジケーターのインストール、設定、取引方法を解説 カスタムセットファイル:インジケーターをすばやく自動設定し、最大限の成果を出すための設定ファイル 他の戦略はもう忘れてください!Grabberだけが、あなたを新たなトレードの高みへと導いてくれるのです。 Grabber戦略の主な特徴: 推奨タイムフレーム:M5〜H4 対応通貨ペア・資産:どれでも使用可能ですが、私が実際に検証した以下を推奨します(GBPUSD、GBPCAD、GBPCHF、AUDCAD、AUDUSD、AUDSGD、AUDCHF、NZDUSD、NZDCAD、EURCAD、EURUSD、E
これはMT5のインジケーターで、再描画なしで取引に参入するための正確なシグナルを提供します。 外国為替、暗号通貨、金属、株式、インデックスなど、あらゆる金融資産に適用できます。かなり正確な見積もりを提供し、取引を開始して終了するのに最適な時期を教えてくれます。1つのシグナルを処理しただけでインジケーターの元が取れた例の 動画 (6:22)をご覧ください。Entry PointsPro インジケーターの助けを借りたほとんどのトレーダーの最初の1週間の結果が改善しています。 Telegramグループ に登録してください。Entry Points Proインジケーターのメリットは次の通りです。 再描画のないエントリーシグナル 再描画されるインジケーターでは一度表示されたシグナルが削除されて大きな金銭的損失につながることがありますが、これと異なり、表示されて確認されたシグナルは消えることがありません。 エラーなしの取引開始 インジケーターアルゴリズムによって取引を開始する(資産を売買する)理想的な瞬間を見つけることができます。それを使用するすべてのトレーダーの成功率が向上します。 あら
Meridian Pro
Ottaviano De Cicco
5 (2)
Meridian Pro 2.00:MT5向けプロ仕様マルチタイムフレーム・トレンドマトリクス Meridian Pro 2.00 は、MetaTrader 5 向けのプロ仕様の適応型トレンドマトリクスです。オリジナルの Meridian トレンドエンジン、クリーンなチャート ribbon、確定足ベースのシグナル矢印、8時間足 dashboard、Fuel momentum、weighted consensus、synthetic HTF processing、そしてチャート上に直接表示される上位足コンテキストラインを統合します。 目的はシンプルです。現在のトレンド、マルチタイムフレーム構造、強度、momentum、EA-ready 状態を、複数チャートに無関係なインジケータを重ねるのではなく、1つの整理された workflow で読むことです。 Meridian Pro の違い 1つの適応型エンジン - 同じ volatility-aware Meridian ロジックを M1 から W1 まで適用します。 Synthetic HTF architecture - 上位足行は下位足デ
このダッシュボードは、選択されたシンボルの最新の利用可能なハーモニックパターンを表示するので、時間を節約し、より効率的に /   MT4バージョン 。 無料インジケーター:   Basic Harmonic Pattern インジケーター列 Symbol : 選択したシンボルが表示されます。 Trend :   強気または弱気 Pattern : パターンの種類(ガートレー、バタフライ、バット、カニ、サメ、サイファー、ABCD) Entry : エントリー価格 SL: ストップロス価格 TP1: 1回目の利食い価格 TP2: 2回目の利食い価格 TP3:   3回目の利食い価格 Current price :   現在値 Age (in bars):    最後に描画されたパターンの年齢 主な入力項目 Symbols:   "28 Major Currency Pairs "または "Selected Symbols "から選択。 Selected Symbols:   カンマで区切られた監視したいシンボル("EURUSD,GBPUSD,XAUUSD")。ブローカーがペアに接
FX Power: 通貨の強弱を分析して、より賢い取引を実現 概要 FX Power は主要通貨と金の実際の強弱をあらゆる市場状況で理解するための必須ツールです。強い通貨を買い、弱い通貨を売ることで、 FX Power は取引の意思決定を簡素化し、高い確率の取引機会を見出します。トレンドを追従する場合でも、極端なデルタ値を使用して反転を予測する場合でも、このツールはあなたの取引スタイルに完全に適応します。ただ取引するだけではなく、 FX Power で賢く取引をしましょう。 1. なぜ FX Power がトレーダーにとって非常に有益なのか 通貨と金のリアルタイム強弱分析 • FX Power は主要通貨と金の相対的な強弱を計算し、マーケットダイナミクスに関する明確な洞察を提供します。 • どの資産がリードしているか、または後れを取っているかを監視して、取引するペアを賢く選びましょう。 マルチタイムフレームの包括的なビュー • 短期、中期、長期のタイムフレームで通貨と金の強弱を追跡し、マーケットトレンドに基づいて取引戦略を調整できます。 • スキャルピングからスイングトレード
OrderFlux | MetaTrader 5 用フットプリント・オーダーフロー バージョン 2.0 – アクティブトレーダー向けのリアルタイム Bid/Ask 可視化 OrderFlux は MT5 用のフットプリントおよびオーダーフローインジケーターです。価格がどこに動いたかだけでなく、その動きの中で何が起きているか(各価格レベルの Bid/Ask ボリューム、デルタ、インバランス、ボリューム分布)を表示します。 多くのチャートはローソク足の最終結果しか表示しません。OrderFlux はそこに至るまでの過程を表示します。ローソク足の形状だけでなく、市場参加者の動向を読み取りたい場合にまさに役立ちます。 ライブチャートにおいて、OrderFlux は主に次の3つの質問に答えます: 現在、どこで積極的な買いまたは売りの圧力が市場に参入しているか? どの価格レベルでボリュームが吸収、または拒否されているか? 現在の動きはセッションのコンテキスト(背景)にどう適合しているか? インターフェースで得られるもの メインチャートは、Canvas ベースでフットプリントを直接レンダリングします
OmniSync Projection
Antonio-alin Teculescu
5 (1)
Chronos Fractal Engine is an innovative price projection indicator for MetaTrader 5, designed to transform your technical analysis by intelligently identifying and projecting historical price patterns. Built upon an advanced correlation algorithm and the fractal principles of the market, this powerful tool visualizes potential future price movements, giving you a unique edge in your trading decisions. What is Chronos Fractal Engine? At its core, the Chronos Fractal Engine employs a sophisticat
トレンドラインプロ   市場の真の方向転換点を理解するのに役立ちます。この指標は、真のトレンド反転と主要プレーヤーが再び参入するポイントを示します。 分かりますか     BOSライン   複雑な設定や不要なノイズなしに、より長い時間足でのトレンドの変化と重要なレベルを把握できます。シグナルは再描画されず、バーが閉じた後もチャート上に残ります。 MT4バージョン   -   RFI LEVELS PRO インジケーター と組み合わせることで、その最大限の能力を発揮します インジケーターが示す内容: 本当の変化   トレンド(BOSライン) 一度シグナルが現れたら、それは有効です!これは、リペイント機能を持つインジケーターとの重要な違いです。リペイント機能を持つインジケーターは、シグナルを発した後、それを変更し、資金の損失につながる可能性があります。これにより、より高い確率と精度で市場に参入できます。また、矢印が現れた後、目標値(利益確定)に達するか、反転シグナルが現れるまで、ローソク足の色を変更する機能もあります。 繰り返しエントリ   主要プレーヤーの補充 エントリーポイントを探す
FX Levels: あらゆる市場における非常に高精度なサポート&レジスタンス 概要 通貨ペア、株式指数、個別銘柄やコモディティなど、どのような市場でも信頼できるサポートとレジスタンスを特定したいですか? FX Levels は伝統的な “Lighthouse” メソッドと先進的な動的アプローチを融合し、ほぼ汎用的な精度を実現します。ブローカーの実務経験を活かし、自動化されたデイリー更新とリアルタイム更新を組み合わせることで、 FX Levels は反転ポイントを見つけ、利益目標を設定し、自信をもってトレードを管理するための手助けをします。今すぐ試してみて、サポート/レジスタンス分析の正確性がどれほどトレードを向上させるかを実感してください! 1. FX Levels がトレーダーにとって非常に有用な理由 非常に正確なサポート&レジスタンスゾーン • FX Levels は異なるブローカー環境でもほぼ同一のゾーンを生成するよう設計されており、データフィードの差異や時刻設定のずれによる不一致を解消します。 • つまり、どのブローカーを利用していても一貫したレベルが得られるため、戦
The Zone Trading Indicator is a technical analysis tool for MetaTrader 5 that automatically identifies and displays tradable price zones across multiple timeframes to assist with structured market analysis. The indicator plots Monthly, Weekly, Daily, and H4 tradable zones , allowing traders to view higher- and lower-timeframe price areas simultaneously. These zones are designed to support one-candle–based entry approaches by highlighting predefined areas where price interaction may be monitored.
このインジケーターは、反転ポイントと価格戻りゾーンを正確に表示します。     主要プレーヤー 。新たなトレンドが形成される場所を把握し、最大限の精度で意思決定を行い、すべての取引をコントロールします。 TREND LINES PRO インジケーターと組み合わせることで、その潜在能力を最大限に発揮します。 VERSION MT4 インジケーターが示す内容: 新しいトレンドの始まりに活性化する反転構造と反転レベル。 リスクと報酬の比率を最小限に抑えた利益 確定 と 損失停止の レベルの表示     RR 1:2   。 インテリジェントな削減ロジックによるストップロス。 指定されたインジケーターから 2 つのトレンド タイプの反転パターンを表示します。 指標: トレンドを追う   TREND LINES PRO   (世界的なトレンドの変化) TREND PRO   (クイックトレンド変更) シンプルで効果的   スキャナー   リアルタイムトレンド(新機能)。 マルチタイムフレームのインストゥルメント フィルタリング。 画面   利益     LOGIC AI信号の後。 当日プラス方
作者のその他のプロダクト
News filter, equity guard & session control for all your EAs — one tool, full protection Take a Break has evolved from a basic news filter into a comprehensive account protection solution . It pauses your other Expert Advisors during news events or based on custom filters. When trading resumes, it automatically restores your entire chart setup , including all EA settings. Why traders choose Take a Break One news filter for all your EAs — no more relying on individual built-in filters that may o
Tax Buddy creates a simple, sortable trading report which you can send to your local tax authorities alongside your annual declaration. I've been using this kind of report for the German Finanzamt in order to declare my capital gains ("Kapitalerträge") in a readily comprehensible manner. For testing purposes, the Demo version places random trades in the Strategy Tester on the symbol of your choice and creates a demo report for them. Conveniently, all reports are stored in the common path for al
News filter, equity guard & session control for all your EAs — one tool, full protection Take a Break has evolved from a basic news filter into a comprehensive account protection solution . It pauses your other Expert Advisors during news events or based on custom filters. When trading resumes, it automatically restores your entire chart setup , including all EA settings. Why traders choose Take a Break One news filter for all your EAs — no more relying on individual built-in filters that may o
Please check the " What's new " tab regularly for a complete and up-to-date list of all improvements + parameters. FREE indicator for my trading utility Take a Break . This indicator allows you to manage multiple other EAs with just one Take a Break EA instance. Simply specify the corresponding Chart Group in the indicator(s) and Take a Break EA settings and you are good to go.  Setup examples (Indicator + EA) As a prerequisite, add the URL https:// trading.custom-solutions.it to the list of a
FREE
Tax Buddy creates a simple, sortable trading report which you can send to your local tax authorities alongside your annual declaration. I've been using this kind of report for the German Finanzamt in order to declare my capital gains ("Kapitalerträge") in a readily comprehensible manner. For testing purposes, the Demo version places random trades in the Strategy Tester on the symbol of your choice and creates a demo report for them. Conveniently, all reports are stored in the common path for al
Take a Break is a comprehensive account protection and risk management tool for MetaTrader. It acts as a kill switch that automatically pauses your EAs when drawdown limits are hit, keeping your account safe during high volatility and news events . Key features: Equity protection and balance protection with customizable thresholds Daily loss limit and daily profit target to stay within your risk rules Daily high watermark — locks in your highest equity/balance each day and enforces maximum drawd
FREE
Please check the " What's new " tab regularly for a complete and up-to-date list of all improvements + parameters. FREE indicator for my trading utility Take a Break . This indicator allows you to manage multiple other EAs with just one Take a Break EA instance. Simply specify the corresponding Chart Group in the indicator(s) and Take a Break EA settings and you are good to go.  Setup examples (Indicator + EA) As a prerequisite, add the URL https:// trading.custom-solutions.it to the list of a
FREE
Take a Break is a comprehensive account protection and risk management tool for MetaTrader. It acts as a kill switch that automatically pauses your EAs when drawdown limits are hit, keeping your account safe during high volatility and news events . Key features: Equity protection and balance protection with customizable thresholds Daily loss limit and daily profit target to stay within your risk rules Daily high watermark — locks in your highest equity/balance each day and enforces maximum drawd
FREE
フィルタ:
レビューなし
レビューに返信