ZigZagFibo

Based on commonly used ZigZag indicators, in-depth mining was conducted on the indicators, with two main improvements:
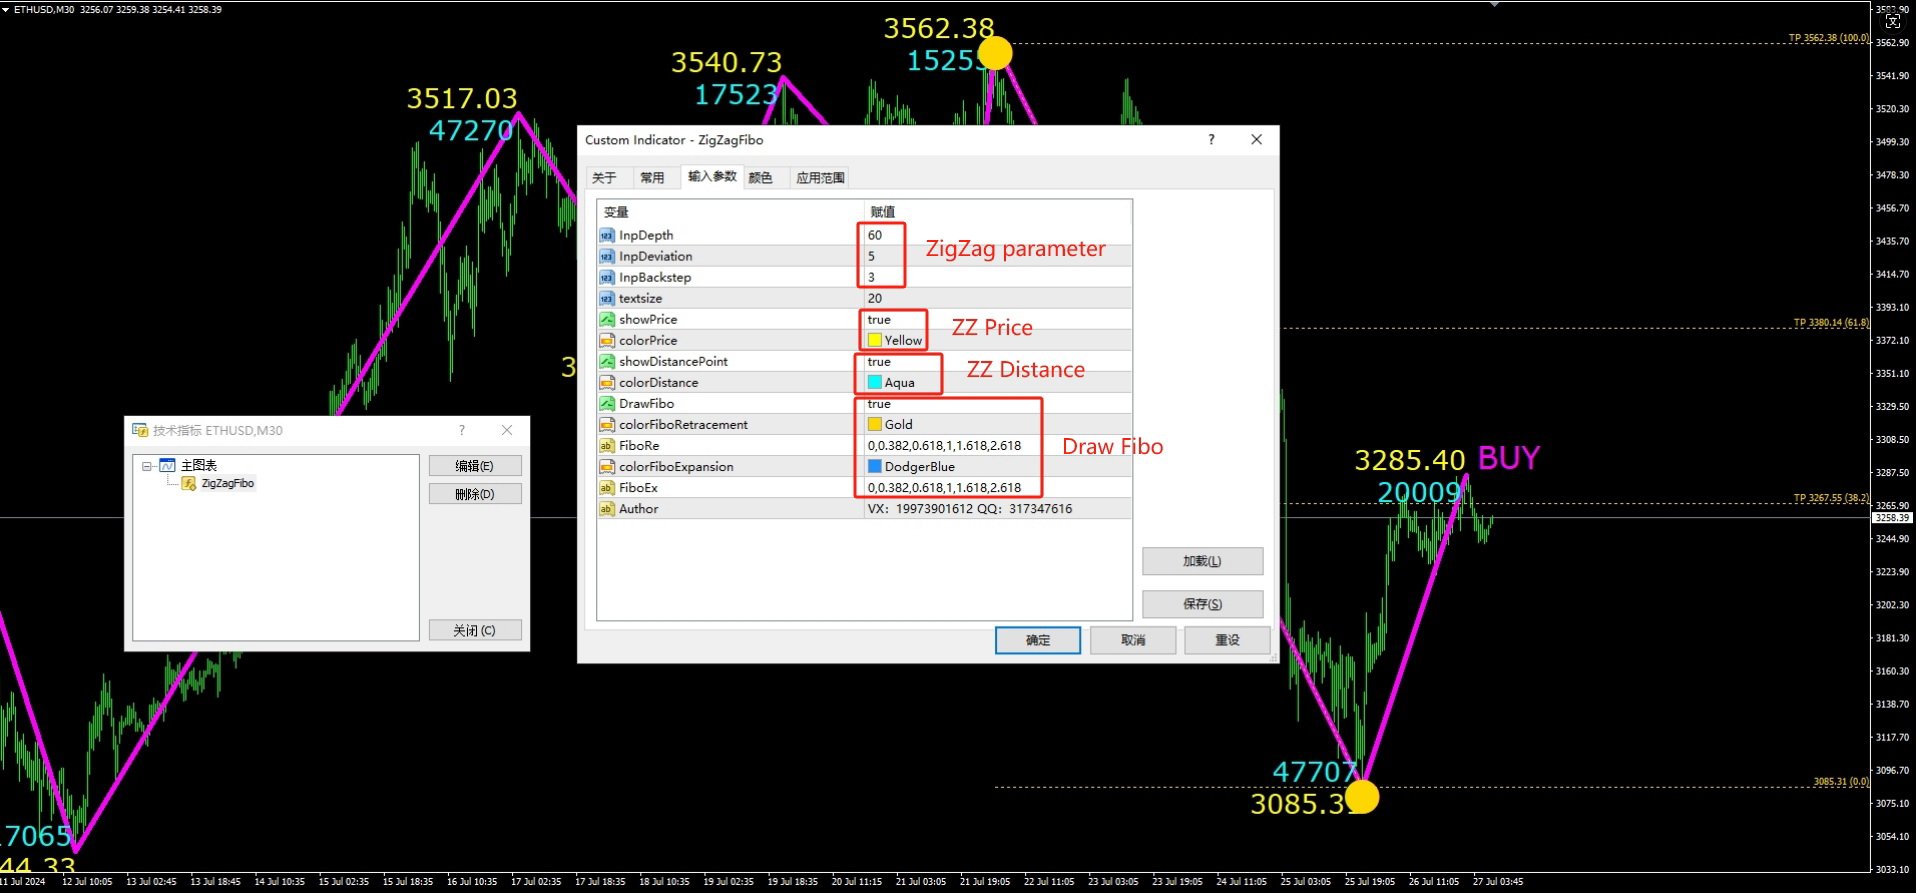
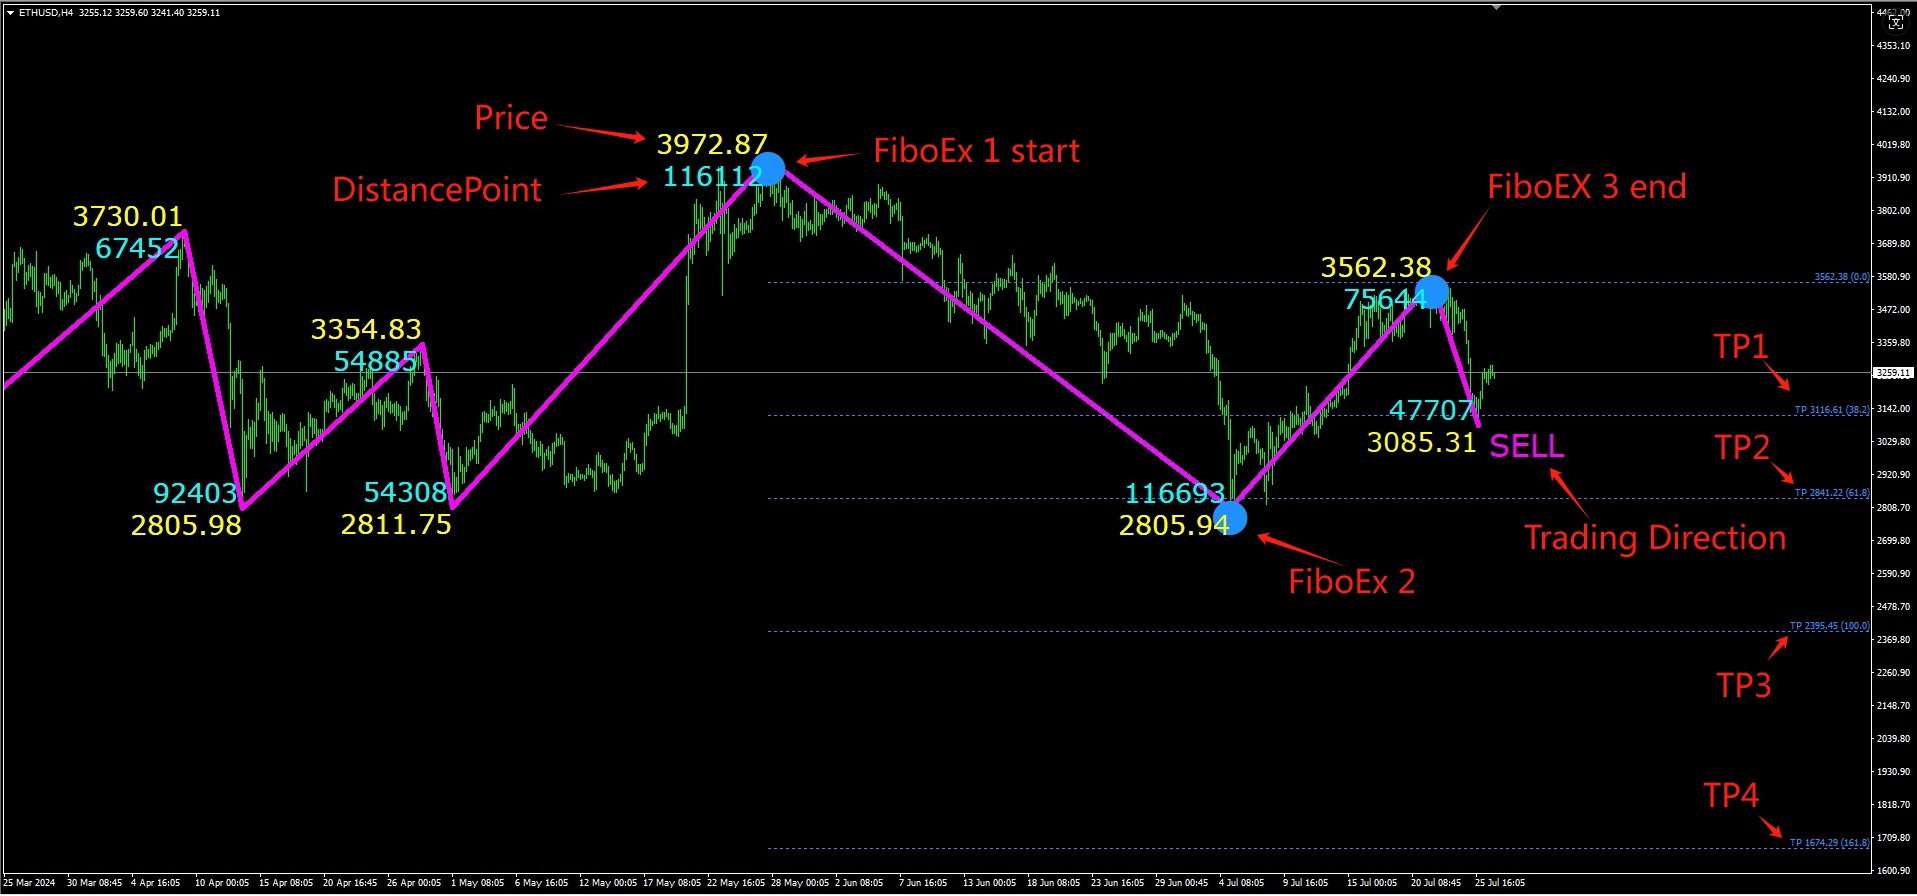
1、 Annotate each ZZ price point; Annotate the distance points between adjacent ZZ points for a more convenient and intuitive view of price fluctuations.
2、 Draw a Fibonacci line for the current price direction of ZZ. The Fibonacci line includes two types: the Fibonacci retracement level and the Fibonacci expansion level. When the last four ZZ points comply with Dow's 123 rule, draw a horizontal line for the expansion of the Fibonacci wave. If it does not comply with the 123 rule, draw a Fibonacci callback. The Fibonacci line provides a very good reference for the specific profit points.
3、 In the parameter settings, the price and distance of the annotation can be adjusted for text size and color settings, allowing for better differentiation between two different sets of values based on color.
4、 The color of ZigZag line can be set.
Switching between different time periods will result in different ZZ lines. The principle usually followed in trading is to follow the direction of the major cycle, engage in opportunistic trading, and enter the market at the turning point of the minor cycle. This is the wisest and easiest way to make money.
おすすめのプロダクト
This indicator works on MT4 and is very easy to use. When you receive a signal from it, you wait for that candle with the signal to close and you enter your trade at the beginning of the next new candle . A red arrow means sell and a green arrow means buy. All arrows comes with Alert  like for easy identification of trade signal. Are you okay with that? 1 minute candle 1 minute expire
Smart Ai Levels  Accumulation & Distribution indicator Smart Ai Levels are Ai controlled indicator which is based on Wyckoff Price cycle theory . It automatically scans the Accumulation & Distribution phases on chart and Ai draws the possible areas before Mark up and Mark down which acts as hot zones and can be traded with confirmation to catch those big price movements . It's a great tool for both Reversal and Breakout Trades suitable to all Trading Styles such as Scalping - Intraday - Swing 
Crypto_Forex MT4用インジケーター「 CHANNEL of FRACTALS 」 - このインジケーターは、フラクタルの高値/安値に基づいて、実際のローカルトレンドラインを表示します。 - グラフィカル分析を使用するトレーダーに最適です。 - レジスタンスローカルトレンドライン - 赤色。 - サポートローカルトレンドライン - 青色。 - フラクタルの数、トレンドラインの色、幅など、いくつかのパラメーターを設定できます。 - このインジケーターは、現在の市場状況を把握するのに最適です。 - 強気相場 - 両方のラインが上昇している場合。 - 弱気相場 - 両方のラインが下降している場合。 - 横ばい - 両方のラインが反対方向に動いている場合。 高品質のトレーディングロボットとインジケーターをご覧になるにはここをクリックしてください! これは、このMQL5ウェブサイトでのみ提供されるオリジナル製品です。
Supply Demand Zone Pro Indicator works with all products and timeframes. It is using a new calculation method, and now you can select the desired zone on any timeframe! Strongest Zones are already enabled by default This is a great advantage in trading.This indicator has a built in backtester enabled by default, just move the chart. Supply and Demand ? Supply is a price zone where sellers outnumbered buyers and drove the price lower. Demand is a price zone where buyers outnumbers sellers and dr
OFFER!   OFFER ! After 3 weeks the unlimited price will be 500$ and in the future you will regret why you didn't make a purchase at this lowest price. Dear Traders, the atomic power Entries Indicator is one of the indicators that if used wisely and correctly can help you to find an edge over the market.  The indicator will work for all forex pairs, all markets and all timeframes. Still it is your duty to find the most effective timeframe for you. When the sell or buy arrow appears you will get a
PRO Renko Systemは、特別にRENKOチャートを取引するために設計された高精度の取引システムです。 これは、様々な取引商品に適用することができる普遍的なシステムです。 システムは効果的に正確な逆転信号へのアクセスを与えるいわゆる市場の騒音を中和する。 表示器は非常に使いやすく、信号の生成に責任がある1つの変数だけがあります。 あなたは簡単にお好みの任意の取引ツールとレンコバーのサイズにツールを適応させることができます。 私はいつもあなたが私のソフトウェアで収益性の高い取引を支援するために余分なサポートを提供する準備ができています! 私はあなたに幸せで収益性の高い取引をしたいです! ご購入後にご連絡ください! 私はあなたに私のレンコチャートジェネレータを送信します。 私はまた、私の個人的な推奨事項やシステムの他のモジュールを無料で共有します!
The   Volume Spread Analysis indicator   is based on the original Volume Spread Analysis method. It was designed for quick and easy recognition of VSA patterns. Even though this indicator looks very simple, it is the most sophisticated tool we've ever made. It is a really powerful analytical tool that generates very reliable trading signals. Because it is very user-friendly and understandable, it is suitable for every type of trader, regardless of his experience. What is VSA? VSA - Volume Spre
Protocol MT4
Vincent Georges David Ferrier
PROTOCOL - Institutional Liquidity Grab & SMC Elite Liquidity Grab & Advanced SMC Execution ( MT5 Version available here ) Dynamic Trend Sniper MT4   (available here)   LIMITED RELEASE & PRICING NOTICE   Launch Special:   Available for   $299 USD for the first 7 days only . After this period, the price will strictly increase to $399 USD. Prop Firm Protection Protocol:   Major Prop Firms enforce strict copy-trading and trade-crowding policies. To protect the statistical edge of this algor
Reverse side scalper is the manual trading system, that works on choppy(anti-trend) market. As a rule markets are on 80% choppy and only 20% is trend phase. System is based on custom step Moving and RSI and reverse pattern. System defines up movement, down movement, trend / choppy phases. Indicator plots Buy signal arrow when current direction is down and phase is trend, Sell signal arrow is plotted when currently is up movement and phase is trend. As a rule it allows to "catch" local maximum/mi
This is the Full Version, to get the free version please contact me. The free version works on “GBPCHF” charts. All symbols and time frames scanner. Harmonic Pattern Harmonic patterns are used in technical analysis that traders use to find trend reversals. They are considered one of the most accurate technical analysis tools, as they allow traders to predict the future price movement direction and the potential trend targets. Also, unlike many other technical tools, the number of false signals
Swing trading is a method in which traders attempt to take advantage of market fluctuations. They buy a security when they believe the market will rise and sell if they feel the market will fall, which, as you can imagine, is common in most trading strategies, irrespective of trading style. The four most frequently occurring patterns in the swing trading domain are reversal, retracement (or pullback), breakouts, and breakdowns. it work all currency pair, and work all timeframe 100% non repaint
ナイト ゴースト - バイナリ オプションの矢印インジケーター。 これからのあなたの頼もしいアシスタントです! 11 - チャートの再描画なし - すべての通貨ペアで大活躍! -インジケータの精度は最大 90% (特に夜間) ・長時間の設定不要(バイナリーオプションに最適な設定) - 信号が遅れない - 現在のローソク足でのシグナルの出現 ・M1期にピッタリ(No More!) ・目に優しいキャンドルカラー(赤・青) -インストールされたアラート それを扱う: - 青い矢印は信号アップを示します -赤い下向き矢印 M1 以上のインジケーターをチャートに配置しないでください. シグナルの精度が低下します! インジケーターのスクリーンショットとビデオを見る
The EuroSession indicator combines filtering by a modified MACD and a trend based indicator. It is an indicator that tries to capture the early market move of the European session. This would mean that pending orders have to be placed way ahead of this move. BUY Pending orders (Buystop) should be placed if: Trend-Bias shows 'UP' MACD Bias shows 'Relatively UP' SELL Pending orders (Sellstop) should be placed if: Trend-Bias shows 'DOWN' MACD Bias shows 'Relatively DOWN' The currency pairs are: EUR
The arrows are calculated with: -     2 Parabolic  parameters -     2 ADX parameters -     4 Stochastic parameters We recommend to combine it with Parabolic, ZigZag or Elliot waves indicator. Always trade the trend! If you make sure to draw your trend lines and support/resistance zones you will just have to wait for the signal to appear. Take the trade. For Binary Options it is advisable to set the expiry time to 5-15 min in M1 chart. THIS INDICATOR IS ZERO REPAINT Best assets to trade: - EUR
Blahtech VWAP
Blahtech Limited
5 (3)
Was: $69    Now: $49   Blahtech VWAP - Volume Weighted Average Price (VWAP) is the ratio of price to total volume. It provides an average price over a specified time interval.  Links [  Install  |  Update  |  Documentation   ] Feature Highlights Configurable VWAP Line Sessions, intervals, anchored or continuous Previous day settlement line Standard Deviation bands Alerts at bar close or real time Automatic Broker or Tick volumes Significantly reduced CPU usage Input Parameters Expert Advisor
Enigmera
Ivan Stefanov
5 (8)
ENIGMERA: 市場の中心 重要:MQL5.comのデモはStrategy Testerで実行されており、Enigmeraの機能を完全には反映していない場合があります。詳細については、説明、スクリーンショット、ビデオをご確認ください。質問があれば、遠慮なくメッセージを送ってください! インジケーターのコードは完全に書き直されました。バージョン3.0は新機能を追加し、インジケーターの開始以来蓄積されたバグを修正しました。 紹介 このインジケーターとトレーディングシステムは、金融市場への注目すべきアプローチです。ENIGMERAはフラクタルサイクルを使用して、サポートとレジスタンスのレベルを正確に計算します。真の蓄積フェーズを示し、方向と目標を提供します。トレンドでも修正でも機能するシステムです。 動作方法 インジケーターのほとんどの機能は、チャートの左側にあるボタンで制御され、市場の状況に迅速に対応できるようになっています。 ボタン ON/OFF – インジケーター全体を表示または非表示にします。 Channel – サポートチャネルを有効にし、許容範囲の偏差を示します。 Dev
任意の期間における平均価格ボラティリティを計算し、時間枠を変更しても固定されたレンジライン(例:始値レンジ)を表示します。始値レンジで取引し、予想されるボラティリティ内で達成可能なTPを設定できます。1日に最大5つのレンジを設定でき、アラートも設定できます。 1日に最大5つの期間を設定でき、それぞれに垂直開始ライン、水平レンジライン、平均ボラティリティ計算を設定できます。表示ラインの色と幅をカスタマイズし、各期間にカスタム名を付け、垂直ラインに時間アラートを設定できます(デフォルトは、GMT+2サーバー時間における主要取引セッションの開始時刻です)。平均ボラティリティ計算のチャート上テキスト表示の表示/非表示を切り替えることができます。 この便利なインジケーターは、デイトレードに役立つ3つのツールを提供します。 1. 任意の時間に開始し、1日の任意の時間に終了する任意の期間における平均ボラティリティまたは予想される価格変動を計算します。これにより、取引開始時刻や取引セッション開始時刻などからの予想価格変動に基づいて、取引の現実的かつ達成可能なTP目標を設定できます。ポイント単位
This indicator is designed based on Mr.   WD   Gann's square of nine methods. Using this indicator, we can enter the desired   pivot   price and, based on the coefficient we assign to it, extract 8   support and resistance   numbers with 8 angles of 45, 90, 135, 180, 225, 270, 315, and 360. Calculates 8   support and resistance   points and draws   support and resistance   lines. The coefficient is to triple the number of executions. To select   pivot points   in which a price is a large nu
「Auto FIBO Pro」Crypto_Forex インジケーターは、取引の補助ツールとして最適です。 - インジケーターは、フィボナッチ レベルとローカル トレンド ライン (赤色) を自動的に計算してチャート上に配置します。 - フィボナッチ レベルは、価格が反転する可能性のある重要な領域を示します。 - 最も重要なレベルは、23.6%、38.2%、50%、61.8% です。 - リバーサル スキャルピングやゾーン グリッド取引に使用できます。 - Auto FIBO Pro インジケーターを使用して、現在のシステムを改善する機会も多数あります。 - Info Spread Swap Display があり、接続されている外国為替ペアの現在のスプレッドとスワップを表示します。 - ディスプレイには、アカウントの残高、エクイティ、マージンも表示されます。 - Info Spread Swap Display は、チャートのどのコーナーにも配置できます。 0 - 左上コーナー、1 - 右上、2 - 左下、3 - 右下。 高品質のトレーディングロボットとインジケーターをご覧にな
Dear Traders this is my another tool called " Swing Master Indicator ". As the name above the indicator is designed to help you in swing trading by capturing the low and highs of the price. You may us this tool with any trading strategy and style from scalping to position trading. It is made for level of traders including newbies and advanced traders even prop-firms, hedge funds and banks to help them make sold market analysis. I create tools for serious traders who want to make a difference in
With the purchase of the   Auto-Harmonic Pattern Recognition Trading Software for MT4 , you will have access to: The Auto Harmonic Pattern recognition software is designed to take the heavy lifting out of a traders Harmonic trading strategy. The Software automatically Identifies and Projects Harmonic Pattern Completion Zones for the 6 most trade-able Harmonic Patterns.  If the Pattern Completes in the projected zone, then there is a high probability of the resulting trade being successful. Pleas
Precautions for subscribing to indicator This indicator only supports the computer version of MT4 Does not support MT5, mobile phones, tablets The indicator only shows the day's entry arrow The previous history arrow will not be displayed (Live broadcast is for demonstration) The indicator is a trading aid Is not a EA automatic trading No copy trading function The indicator only indicates the entry position No exit (target profit)  The entry stop loss point is set at 30-50 PIPS Or the front hi
Pivot Points MT4
KEENBASE SOFTWARE SOLUTIONS
KT Pivot Points は、最新の市場データに基づいて、日足・週足・月足のピボットレベルをチャート上に自動で表示します。ピボットポイントは、特にFX市場において、テクニカル分析で広く利用されている指標の一つです。 特徴 価格がピボットレベルに到達した際にアラートを送信します。  各種類のピボットレベルに対して完全なカスタマイズが可能です。   シンプルな表示で、日足・週足・月足のピボットレベルを一目で確認できます。 最小限のCPUリソースを使用し、高速な計算を実現します。 チャート上の他のインジケーターとも互換性があります。 ピボットポイントとは ピボットポイントは、前の取引日の高値、安値、終値の平均から算出されます。  この計算により、将来のサポートおよびレジスタンスレベルを予測でき、価格がこれらのレベル付近でどのように動くかを判断する手助けとなります。 また、価格がピボットポイントの上にあるときは強気傾向、下にあるときは弱気傾向とされるのが一般的です。 ピボットの計算式 ピボットレベルの計算には、前日、週、または月の高値、安値、終値が使用されます。 P = (H +
The indicator shows the potential trend direction by cyclical-wave dependence. Thus, all the rays of the intersection will be optimal rays, in the direction of which the price is expected to move, taking into account the indicator period. Rays can be used as a direction for potential market movement. But we must not forget that the approach must be comprehensive, the indicator signals require additional information to enter the market.
This is an advanced index algorithm, it provides a very accurate top-bottom signal, it will not frequently appear the wrong signal during the trend, this index does not have any redrawing, drift, or lag behavior. When this signal appears on the chart, it means that the market is about to reverse, or that a period of trend market is over, and then the market will be transformed into a consolidation market, and this indicator does not need to adjust the parameters.   It applies to any currency pai
このインジケーターは世界の取引所の営業時間を表示します。現在どの市場が最も活発かを確認するのに役立ちます 私の  #1 Pro  Utility : 66+ 機能、このツールを含む  |   お問い合わせ  ご質問があれば 現在最もボラティリティの高い銘柄を選択するのに役立ちます; デイトレーダーに特に有用です; 1) 1H以下の時間足 で使用する場合:線はチャート上のバーの実際の位置に対応し、チャートを移動すると、取引セッションの線 はチャートと一緒に移動します 。 2) 4H以上の時間足 で使用する場合:取引セッションの 静的なチャート が表示され、垂直線 は一日中移動し 、現在どの市場が活発かを示します。(スケールのため)。 インジケーターをインストールした後、グリッドを無効にし(CTRL+G)、オブジェクトの説明を無効にする(F8>共通>オブジェクトの説明を表示)ことをお勧めします。 入力設定: 重要:   インジケーターを正しく動作させるには、初期設定で   ブローカー時間とグリニッジ標準時との時差を設定する必要があります: ブローカー時間は「MarketWatch」セ
This indicator is based on the Weis wave principle of wave volume. Below are few features of the indicator It draws the wave on the chart while the accumulated volume per wave in a different window at the bottom of the chart You can configure the turning point move It displays the accumulated volume (in thousands, eg for 15000 volume it will show 15) at the end of each wave You can also configure to show number of candles in the wave along with the wave volume The indicator calculates the distin
TMoney TrendCycle
Moises Orlando Urbina Sojo
The indicator plots the trend from an EMA of "n" periods and the cycle from another EMA of "k" periods from the previous EMA. This allows the crosses to be much more effective and the amplitude of the cycle allows to verify the strength of the trend. This indicator should be used as a complementary tool to confirm market entry signals. It is possible to add three times the indicator applied to maximum price, minimum price and median price in TimeFrame of one hour for example, in order to identif
Indicator for binary options arrow is easy to use and does not require configuration works on all currency pairs, cryptocurrencies buy signal blue up arrow sell signal red down arrow tips do not trade during news and 15-30 minutes before their release, as the market is too volatile and there is a lot of noise it is worth entering trades one or two candles from the current period (recommended for 1 candle) timeframe up to m 15 recommended money management fixed lot or fixed percentage of the depo
このプロダクトを購入した人は以下も購入しています
まず第一に、この取引インジケーターは再描画されず、再描画されず、遅延しないことを強調する価値があります。これにより、手動取引とロボット取引の両方に理想的なものになります。 ユーザーマニュアル:設定、入力、戦略。 アトミックアナリストは、価格の強さとモメンタムを利用して市場でより良いエッジを見つけるためのPA価格アクションインジケーターです。ノイズや誤ったシグナルを除去し、取引ポテンシャルを高めるための高度なフィルターを備えています。複雑なインジケーターの複数のレイヤーを使用して、アトミックアナリストはチャートをスキャンし、複雑な数学的計算をシンプルなシグナルと色に変換します。これにより、どのような初心者トレーダーでも理解して使用し、一貫した取引の決定を行うことができます。 「アトミックアナリスト」は、新規および経験豊富なトレーダー向けにカスタマイズされた包括的な取引ソリューションです。プレミアムインジケーターとトップノッチの機能を1つの取引戦略に組み合わせ、すべてのタイプのトレーダーにとって汎用性のある選択肢にします。 デイリートレーディングとスキャルピング戦略:高速で正確な
12% OFF EASTER SALE An exclusive indicator that utilizes an innovative algorithm to swiftly and accurately determine the market trend. The indicator automatically calculates opening, closing, and profit levels, providing detailed trading statistics. With these features, you can choose the most appropriate trading instrument for the current market conditions. Additionally, you can easily integrate your own arrow indicators into Scalper Inside Pro to quickly evaluate their statistics and profitabi
「 Dynamic Scalper System 」インジケーターは、トレンド波の中でスキャルピング取引を行う手法のために設計されています。 主要通貨ペアと金でテスト済みで、他の取引商品との互換性があります。 トレンドに沿った短期的なポジションオープンのシグナルを提供し、追加の価格変動サポートも提供します。 インジケーターの原理 大きな矢印はトレンドの方向を決定します。 トレンド波の中では、小さな矢印の形でスキャルピングシグナルを生成するアルゴリズムが機能します。 赤い矢印は強気方向、青い矢印は弱気方向です。 トレンドの方向には敏感な価格変動ラインが描かれ、小さな矢印のシグナルと連動します。 シグナルは次のように機能します。適切なタイミングでラインが現れるとエントリーシグナルが形成され、ラインが開いている間はポジションが保持され、完了すると取引が終了します。 推奨される動作時間枠はM1~H4です。 矢印は現在のローソク足に形成され、次のローソク足が開いている場合は、前のローソク足の矢印は再描画されません。 入力パラメータ Trend Wave Period - トレンド方向
Advanced Supply Demand
Bernhard Schweigert
4.91 (299)
現在40%オフ 初心者にもエキスパートトレーダーにも最適なソリューション このインジケーターは独自の機能と新しい公式を多数内蔵しており、ユニークで高品質かつ手頃な取引ツールです。このアップデートでは、2つの時間枠ゾーンを表示できるようになります。より長いTFだけでなく、チャートTFとより長いTF(ネストゾーンを表示)の両方を表示できます。すべてのSupply Demandトレーダーの皆さんのお気に召すはずです。:) 重要情報の公開 Advanced Supply Demandの可能性を最大化するには、 https://www.mql5.com/ja/blogs/post/720245 にアクセスしてください。   エントリーまたはターゲットの正確なトリガーポイントを正確に特定できれば取引がどのように改善されるか想像してみてください。新しい基盤となるアルゴリズムに基づいて構築されているため、買い手と売り手の間の潜在的な不均衡をさらに簡単に特定できます。これは、最も強い需要と供給のゾーンと、過去のパフォーマンス(古いゾーンを表示)がグラフィカルに表現されるためです。これらの機能は、最適な
ご紹介     Quantum Breakout PRO は 、ブレイクアウト ゾーンの取引方法を変革する画期的な MQL5 インジケーターです。 13年以上の取引経験を持つ経験豊富なトレーダーのチームによって開発された Quantum Breakout PROは 、革新的でダイナミックなブレイクアウトゾーン戦略により、あなたの取引の旅を新たな高みに押し上げるように設計されています。 クォンタム ブレイクアウト インジケーターは、5 つの利益ターゲット ゾーンを備えたブレイクアウト ゾーン上のシグナル矢印と、ブレイクアウト ボックスに基づいたストップロスの提案を提供します。 初心者トレーダーにもプロのトレーダーにも適しています。 量子EAチャネル:       ここをクリック MT5バージョン:   ここをクリック 重要!購入後、インストールマニュアルを受け取るためにプライベートメッセージを送ってください。 推奨事項: 時間枠: M15 通貨ペア: GBPJPY、EURJPY、USDJPY、NZDUSD、XAUUSD アカウントの種類: ECN、Raw、またはスプレッドが非
現在20%OFF! 初心者やエキスパートトレーダーに最適なソリューションです。 このインディケータは、エキゾチックペア・コモディティ・インデックス・先物など、あらゆるシンボルの通貨の強さを表示することに特化したインディケータです。金、銀、原油、DAX、US30、MXN、TRY、CNHなどの通貨の強さを表示するために、9行目にどのシンボルでも追加することができます。独自の機能を多数搭載し、新しい計算式を採用したため、ユニークで高品質、かつ手頃な価格のトレーディングツールとなっています。新しいトレンドやスキャルピングチャンスのトリガーポイントを正確に把握することができるため、あなたのトレードがどのように改善されるか想像してみてください。 ユーザーマニュアル:ここをクリック   https://www.mql5.com/en/blogs/post/708876 すべての時間枠に対応します。あなたはすぐにトレンドを見ることができるようになります! 新しいアルゴリズムに基づいて設計されているため、潜在的な取引の特定と確認がより簡単になります。これは、8つの主要通貨と1つのシンボルの強弱
Route Lines Prices -は、価格の方向性を予測するために設計されたインジケーターです。シンプルなインターフェースには、価格変動と将来の方向性を計算するための複数のアルゴリズムが搭載されています。これらのアルゴリズムには、使用する時間枠に基づいたボラティリティ計算と価格平滑化が含まれています。 このインジケーターには、「 Calculating price values 」値を変更するためのパラメーターが1つだけあります。デフォルト値の1は、バランスの取れた自動計算を提供し、インジケーターを手動で設定することなく使用できます。 値を2から500まで手動で変更することで、インジケーターを独自のトレーディングシステムに合わせてカスタマイズできます。 このインジケーターは、M1からH4の時間枠での使用を推奨します。あらゆる取引銘柄で使用できます。 シグナル矢印はローソク足の終値で生成され、過去の履歴には再描画されません。 メインチャートには、重複した矢印が表示されます。 複数のアラートタイプが利用可能です。内蔵のライン軌跡カウンターは、終値に基づいて動作します。これ
トレンドラインプロ   市場の真の方向転換点を理解するのに役立ちます。この指標は、真のトレンド反転と主要プレーヤーが再び参入するポイントを示します。 分かりますか     BOSライン   複雑な設定や不要なノイズなしに、より長い時間足でのトレンドの変化と重要なレベルを把握できます。シグナルは再描画されず、バーが閉じた後もチャート上に残ります。 VERSION MT 5     -     RFI LEVELS PRO インジケーター と組み合わせることで、その潜在能力を最大限に発揮します。 インジケーターが示す内容: 本当の変化   トレンド(BOSライン) 一度シグナルが現れたら、それは有効です!これは、リペイント機能を持つインジケーターとの重要な違いです。リペイント機能を持つインジケーターは、シグナルを発した後、それを変更し、資金の損失につながる可能性があります。これにより、より高い確率と精度で市場に参入できます。また、矢印が現れた後、目標値(利益確定)に達するか、反転シグナルが現れるまで、ローソク足の色を変更する機能もあります。 繰り返しエントリ       主要プレーヤーの
現在40%OFF! 初心者やエキスパートトレーダーのためのベストソリューション! このダッシュボードソフトウェアは、28の通貨ペアで動作しています。それは私達の主要な指標(高度な通貨の強さ28と高度な通貨インパルス)の2に基づいています。それは全体の外国為替市場の大きい概観を与えます。それは、すべての(9)時間枠で28の外国為替ペアのための高度な通貨の強さの値、通貨の動きの速度と信号を示しています。チャート上で1つのインディケータを使用して市場全体を観察し、トレンドやスキャルピングの機会をピンポイントで見つけることができたら、あなたのトレードがどのように改善されるか想像してみてください。 このインディケータには、強い通貨と弱い通貨の識別、潜在的な取引の識別と確認がより簡単になるような機能が搭載されています。このインディケータは、通貨の強さや弱さが増加しているか減少しているか、また、すべての時間枠でどのように機能しているかをグラフィカルに表示します。 新機能として、現在の市場環境の変化に適応するダイナミックなマーケットフィボナッチレベルが追加され、すでに当社のAdvanced
CRT Multi-Timeframe Market Structure & Liquidity Sweep Indicator Non-Repainting | Multi-Asset | MT5 Version Available MT5 Version:   https://www.mql5.com/en/market/product/162075 Full User Guide — explains what each feature does and why:   https://www.mql5.com/en/blogs/post/767525 Quick Start User Guide  — explains how to configure and in what order:  https://www.mql5.com/en/blogs/post/767540 Indicator Overview CRT Ghost Candle HTF Fractal is a complete institutional-grade market structure too
Super Signal Market Slayer 非リペイント|高精度|マルチマーケット対応インテリジェントトレンド指標 トレードにおいて本当に難しいのは、 注文することではなく、相場のノイズの中で「トレンドが始まった瞬間」を見極めることです。 Market Slayer はそのために開発されました。 本インジケーターは、日中取引向けに設計された非リペイント型のインテリジェント指標です。 多層確認とトレンドフィルターにより、重要な局面でのみ明確かつ信頼性の高い Buy / Sell シグナルを表示します。 主な特長 非リペイントシグナル 一度表示されたシグナルは固定され、消えたり移動したりしません。 高精度なトレンド判定 複数銘柄で検証され、特にゴールド M5 / M15 で安定した結果を示します。 マルチマーケット対応 ゴールド、FX、指数、主要暗号資産に対応。 日中取引向け最適化 M5・M15 に特化し、ノイズを抑え実行性を向上。 直感的で分かりやすい 初心者でも理解しやすく、すぐに使用可能。 技術ロジック概要 Market Slayer は単一条件の矢印ではありません。 以
12% OFF EASTER SALE The Reversal Master is an indicator for determining the current direction of price movement and reversal points. The indicator will be useful for those who want to see the current market situation better. The indicator can be used as an add-on for ready-made trading systems, or as an independent tool, or to develop your own trading systems. The Reversal Master indicator, to determine the reversal points,  analyzes a lot of conditions since the combined analysis gives a more a
Volatility Trend System - a trading system that gives signals for entries. The volatility system gives linear and point signals in the direction of the trend, as well as signals to exit it, without redrawing and delays. The trend indicator monitors the direction of the medium-term trend, shows the direction and its change. The signal indicator is based on changes in volatility and shows market entries. The indicator is equipped with several types of alerts. Can be applied to various trading ins
このインジケーターを購入すると、プロ仕様のトレードマネージャーを無料で差し上げます。 まず第一に、このトレーディングシステムがノンリペイント、ノンリドロー、ノンラグのインジケーターであることを強調する価値がある。これにより、手動取引とロボット取引の両方に理想的なものになっています。 オンラインコース、マニュアル、プリセットのダウンロード。 「スマートトレンドトレーディングシステム MT5」は、新規および経験豊富なトレーダー向けにカスタマイズされた包括的なトレーディングソリューションです。10以上のプレミアムインジケーターを組み合わせ、7つ以上の堅実なトレーディング戦略を備えており、多様な市場状況に対応する多目的な選択肢となっています。 トレンドフォロー戦略:トレンドを効果的に乗り越えるための正確なエントリーとストップロス管理を提供します。 リバーサル戦略:潜在的なトレンドの反転を特定し、トレーダーがレンジ相場を活用できるようにします。 スキャルピング戦略:高速で正確なデイトレードおよび短期取引のために設計されています。 安定性:すべてのインジケーターはノンリペイント、ノンリドロー、ノ
Dynamic Forex28 Navigator - 次世代の Forex 取引ツール。 現在 49% オフ。 Dynamic Forex28 Navigator は、長年人気のインジケーターを進化させたもので、3 つの機能を 1 つにまとめています。 Advanced Currency Strength28 インジケーター (レビュー 695 件)  + Advanced Currency IMPULSE with ALERT (レビュー 520 件) + CS28 コンボ シグナル (ボーナス)。 インジケーターの詳細 https://www.mql5.com/en/blogs/post/758844 次世代の Strength インジケーターが提供するもの  オリジナルで気に入っていたすべての機能が、新機能と精度の向上によって強化されました。 主な機能: 独自の通貨強度計算式。 すべての時間枠でスムーズかつ正確な強度ライン。 トレンドの特定と正確なエントリーに最適です。 ダイナミックマーケットフィボナッチレベル (マーケットフィボナッチ)。 このインジケーターに固有
このインジケーターは、反転ポイントと価格戻りゾーンを正確に表示します。     主要プレーヤー 。新たなトレンドが形成される場所を把握し、最大限の精度で意思決定を行い、すべての取引をコントロールします。 TREND LINES PRO インジケーターと組み合わせることで、その潜在能力を最大限に発揮します。 VERSION MT5 インジケーターが示す内容: 新しいトレンドの始まりに活性化する反転構造と反転レベル。 リスクと報酬の比率を最小限に抑えた利益 確定 と 損失停止の レベルの表示     RR 1:2   。 インテリジェントな削減ロジックによるストップロス。 指定されたインジケーターから 2 つのトレンド タイプの反転パターンを表示します。 指標: トレンドを追う   TREND LINES PRO   (世界的なトレンドの変化) TREND PRO   (クイックトレンド変更) シンプルで効果的   スキャナー   リアルタイムトレンド(新機能)。 マルチタイムフレームのインストゥルメント フィルタリング。 画面   利益     LOGIC AI信号の後。 当日プラス方
GOLD Impulse with Alert
Bernhard Schweigert
4.67 (12)
このインディケータは、当社の2つの製品 Advanced Currency IMPULSE with ALERT  +   Currency Strength Exotics . のスーパーコンビネーションです。 このインジケーターは全ての時間枠で作動し、8つの主要通貨と1つのシンボルの強弱のインパルスをグラフで表示します。 このインジケータは、金、エキゾチックペア、商品、インデックス、先物など、あらゆるシンボルの通貨強度の加速度を表示することに特化されています。金、銀、原油、DAX、US30、MXN、TRY、CNHなどの通貨強度の加速度(インパルスまたは速度)を表示するために、任意のシンボルを9行目に追加できる、この種の最初のものです。 新しいアルゴリズムに基づいて構築され、潜在的な取引の特定と確認がさらに容易になりました。これは、通貨の強さや弱さが加速しているかどうかをグラフィカルに表示し、その加速の速度を測定するためです。加速すると物事は明らかに速く進みますが、これはFX市場でも同じです。つまり、反対方向に加速している通貨をペアリングすれば、潜在的に利益を生む取引を特定
THE ONLY CURRENCY STRENGTH INDICATOR THAT IS BASED ON PRICE ACTION. DESIGNED FOR TREND, MOMENTUM & REVERSAL TRADERS This indicator  reads price action to confirm trend and strength . Advanced multi-currency and multi-time frame indicator that shows you simply by looking at one chart, every currency pair that is trending and the strongest and weakest currencies driving those trends. For full details on how to use this indicator, and also how to get a FREE chart tool, please see user manual HERE
Wave and Cycle counter to give an immediate indication how far the ongoing trend has progressed. Low numbers: trend has just started, ride the trend. Higher numbers: trend is 'older', watch for reversals This indicator is 100% compatible with the fantastic TopDog trading strategy. (I will NOT give any details about this Top Dog strategy) The trend direction is determined by a SMA value (or any other MA) you can set. Waves and cycles numbers and letters are derived from a SlowStoch setting. Wave
Binary Volume Edge – Martingale Stats  Indicator for binary options with live pre-signals and full martingale stats Binary Volume Edge – Martingale Stats is a professional tool that combines powerful signal filtering, smart martingale analysis, and a unique early warning system. No magic – just clear rules and verifiable stats. What do you get? 1. Signals you can trust Absolute absence of redrawing – arrows appear only on closed candles and never change again. Preliminary signals on t
Miraculous Indicator – ガン・スクエア・オブ・ナインに基づく100%非リペイントのFXおよびバイナリーツール この動画では、FXおよびバイナリーオプションのトレーダー向けに特別に開発された、非常に正確で強力な取引ツールである Miraculous Indicator を紹介しています。このインジケーターがユニークなのは、伝説的な ガン・スクエア・オブ・ナイン と ガンの振動の法則 に基づいている点で、現代の取引で利用できる最も正確な予測ツールの一つとなっています。 Miraculous Indicatorは 完全に非リペイント であり、ローソク足が確定した後にシグナルが変化したり消えたりすることはありません。つまり、見たものがそのまま利用できます。これにより、トレーダーは自信を持ってエントリーおよびエグジットを行うための信頼性と一貫性のある根拠を得ることができます。 主な特徴: ガン・スクエア・オブ・ナインとガン理論に基づいて構築 100%非リペイントのシグナルシステム すべての時間枠(M1、M5、H1、H4、日足、週足)で機能 FXおよびバイナリーオプション取引
GEM Signal Pro GEM Signal Pro は、MetaTrader 4 向けのトレンドフォロー型インジケーターです。より明確なシグナル、より整理されたトレードセットアップ、そして実用的なリスク管理をチャート上で確認したいトレーダーのために設計されています。 単純な矢印だけを表示するのではなく、GEM Signal Pro はトレード全体の考え方を、より見やすく分かりやすい形で表示します。条件が確認されると、インジケーターはエントリー価格、ストップロス、利確目標をチャート上に表示し、トレードセットアップをより効率的に確認できるようにします。 動作の仕組み このインジケーターは、まず内部ロジックに基づいて有効なシードシグナルを検出します。 確認条件が満たされると、GEM Signal Pro はチャート上に完全なセットアップを表示します。これにより、トレーダーはトレード構造をより明確に把握し、手作業による分析を減らすことができます。 チャート上のトレードレベル 確認済みシグナルに対して、GEM Signal Pro は以下を表示できます。 エントリー価格 ストップロス テ
Linear Trend Predictor ー - エントリ ポイントと方向サポート ラインを組み合わせたトレンド インジケーター。高値/安値チャネルを突破するという原理に基づいて機能します。 インジケーターのアルゴリズムは市場のノイズをフィルタリングし、ボラティリティと市場の動向を考慮します。 インジケーターの機能  平滑化手法を使用して、市場のトレンドと、買い注文または売り注文を開くためのエントリー ポイントを表示します。  任意の時間枠のチャートを分析して、短期および長期の市場の動きを判断するのに適しています。  あらゆる市場や時間枠に適応可能な入力パラメータにより、トレーダーはインジケーターを独自にカスタマイズできます。  設定されたインジケーター信号は消えず、再描画もされません。ローソク足の終値で決定されます。  いくつかの種類の通知が矢印と組み合わされています。  このインジケーターは、独立した取引システムとして使用することも、他の取引システムへの追加として使用することもできます。  あらゆるレベルの経験を持つトレーダーが使用できます。 主なパラメータ Vol
まず第一に、この取引ツールはノンリペイント、ノンリドロー、ノンラグの指標であり、プロの取引に理想的ですことを強調する価値があります。 オンラインコース、ユーザーマニュアル、デモ。 スマートプライスアクションコンセプトインジケーターは、新米から経験豊富なトレーダーまで、非常 に強力なツールです。Inner Circle Trader AnalysisやSmart Money Concepts Trading Strategiesなど、20以上の有用な指標を1つに組み合わせています。このインジケーターはスマートマネーコンセプトに焦点を当て、大手機関の取引方法を提供し、彼らの動きを予測するのに役立ちます。 特に、流動性分析に優れており、機関がどのように取引しているかを理解しやすくしています。市場のトレンドを予測し、価格の動きを慎重に分析するのに優れています。機関の戦略とトレードを合わせることで、市場の動向についてより正確な予測ができます。このインジケーターは多目的であり、市場構造を分析し、重要な注文ブロックを特定し、さまざまなパターンを認識するのに優れています。 このインジケーターは
チャートを構成し、周期的な価格変動を識別するテクニカル指標。 どのチャートでも動作します。 いくつかの種類の通知。 グラフ自体に追加の矢印があります。 履歴を再描画せずに、キャンドルのクローズに取り組みます。 M5以上のTFを推奨します。 パラメータの使用と設定が簡単です。 異なるパラメータを持つ 2 つのインジケーターを使用する場合、他のインジケーターなしで使用できます。 入力パラメータは2つあります 周期性と信号持続時間 これら 2 つのパラメータは、チャート構造の処理を扱います。 Cyclicity - 反転サイクルが変化する頻度を調整し、サイクルを滑らかにします。 Signal duration - 最小数では価格変動の衝動を検出し、最大数では長期的なトレンドの動きを検出します。
Adaptive Volatility Range [AVR] is a powerful tool for identifying key trend reversal points. AVR accurately reflects the Average True Range (ATR) of volatility, taking into account the Volume-Weighted Average Price (VWAP). The indicator adapts to any market volatility by calculating the average volatility over a specific period, ensuring a stable rate of profitable trades. You receive not just an indicator but a professional automated trading system , AVR-EA . Advantages: Automated Trading Sys
NAM Order Blocks
NAM TECH GROUP, CORP.
3.67 (3)
MT4マルチタイムフレームオーダーブロック検出インジケーター。 特徴 -チャートコントロールパネルで完全にカスタマイズ可能で、完全な相互作用を提供します。 -必要な場所でコントロールパネルを表示および非表示にします。 -複数の時間枠でOBを検出します。 -表示するOBの数量を選択します。 -さまざまなOBユーザーインターフェイス。 -OBのさまざまなフィルター。 -OB近接アラート。 -ADRの高線と低線。 -通知サービス(画面アラート|プッシュ通知)。 概要 注文ブロックは、金融機関や銀行からの注文収集を示す市場行動です。著名な金融機関と中央銀行が外国為替市場を牽引しています。したがって、トレーダーは市場で何をしているのかを知る必要があります。市場が注文ブロックを構築するとき、それは投資決定のほとんどが行われる範囲のように動きます。 注文の構築が完了すると、市場は上向きと下向きの両方に向かって急激に動きます。注文ブロック取引戦略の重要な用語は、機関投資家が行っていることを含むことです。それらは主要な価格ドライバーであるため、機関投資家の取引を含むあらゆる戦
The Nihilist 5.0 Indicator includes Forexalien and Nihilist Easy Trend trading strategies and systems. It is composed of an MTF Dashboard where you can analyze the different input possibilities of each strategy at a glance. It has an alert system with different types of configurable filters. You can also configure which TF you want to be notified on your Metatrader 4 platform and Mobile application The indicator has the option to view how could be a TP and SL by using ATR or fixed points, even w
Ultimate Market Master Trend Master the Market’s Direction with Precision The Ultimate Market Master Trend indicator is an all-in-one market sentiment analyser designed for traders who demand clarity, accuracy, and confidence in every move. It combines smart trend detection, multi-timeframe stochastic momentum, and dynamic visual cues to help you identify high-probability entries and exits with ease.  Key Features  1. Smart Trend System (Main Chart) Uses a 200-period LWMA baseline to determine
PipFinite Breakout EDGE
Karlo Wilson Vendiola
4.93 (487)
The Missing Edge You Need To Catch Breakouts Like A Pro. Follow a step-by-step system that detects the most powerful breakouts! Discover market patterns that generate massive rewards based on a proven and tested strategy. Unlock Your Serious Edge Important information here www.mql5.com/en/blogs/post/723208 The Reliable Expert Advisor Version Automate Breakout EDGE signals using "EA Breakout EDGE" Click Here Have access to the game changing strategy that will take your trading to the next l
作者のその他のプロダクト
The MACD Area indicator is developed based on the system's built-in MACD indicator to enhance its functionality. The main enhancement is: average algorithm+four-color column+area value. By default, the Exponential Average Algorithm (EMA) is used, and any of the four algorithms can be selected. Algorithm 1: Fundamentals of Simple (SMA arithmetic moving average) SMA, The abbreviation for arithmetic moving average is calculated by adding the closing prices of the last N days, dividing by N, and as
フィルタ:
レビューなし
レビューに返信