RaysFX Intraday Fibo
- インディケータ
- バージョン: 1.0
- アクティベーション: 5

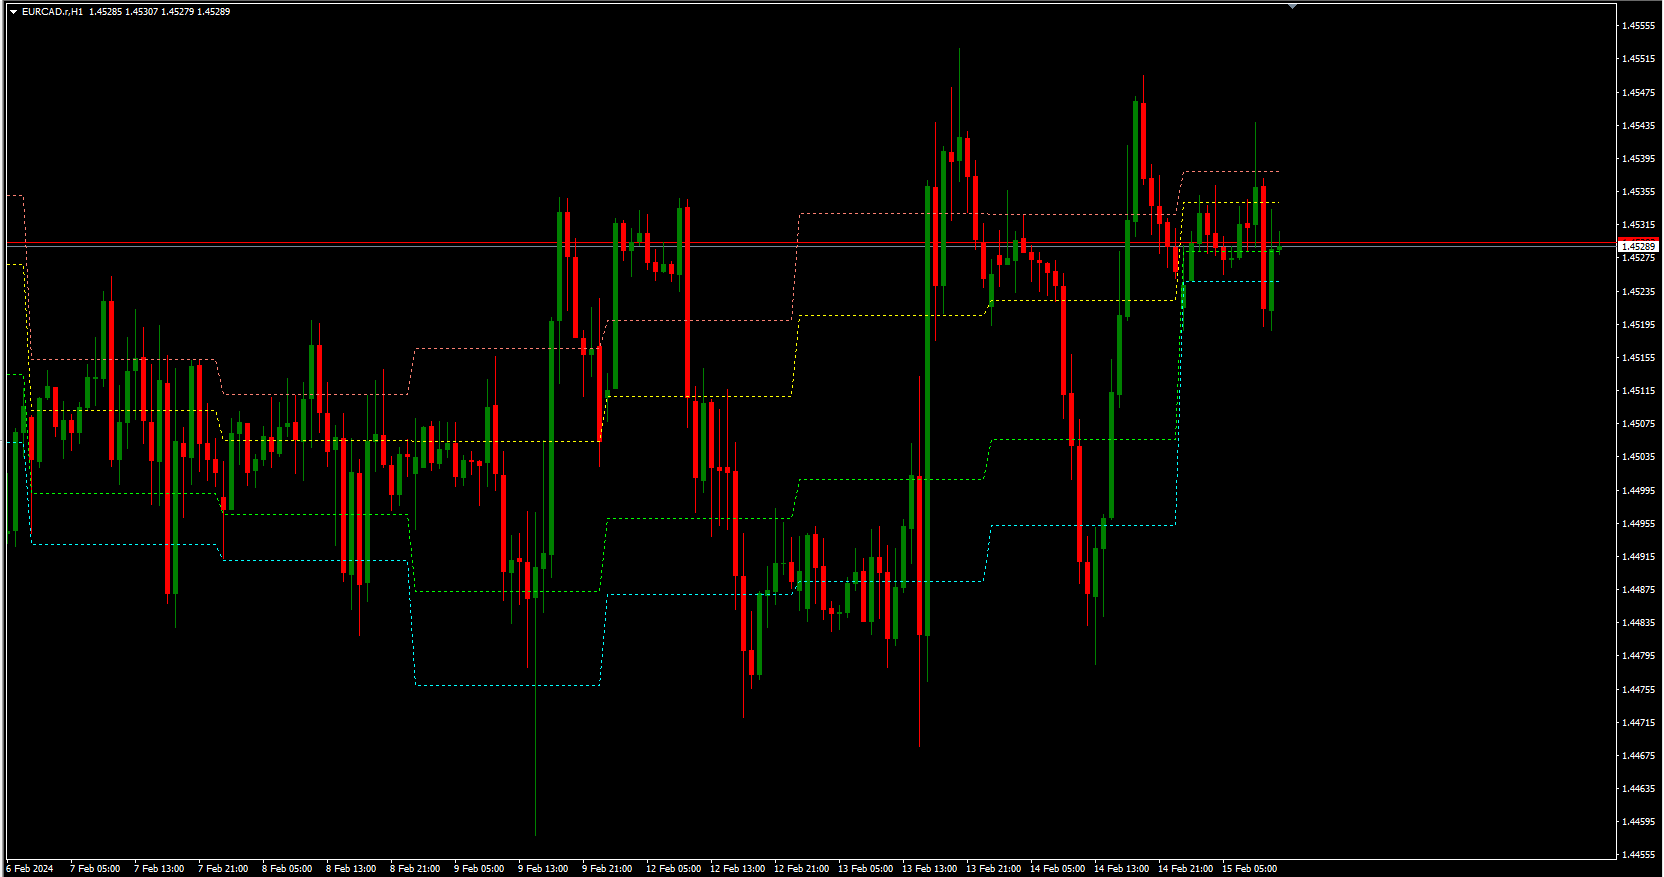
RaysFX Intraday Fibo
RaysFX Intraday Fibo è un indicatore di trading Forex di alta qualità, progettato con precisione e attenzione ai dettagli. Questo indicatore è il risultato di anni di esperienza nel trading Forex e nella programmazione MQL4, ed è stato creato con l’obiettivo di fornire ai trader un vantaggio competitivo nel mercato.
Caratteristiche principali:
-
Precisione: L’indicatore RaysFX Intraday Fibo utilizza un algoritmo avanzato per identificare i punti di ingresso e di uscita ottimali, aiutando i trader a massimizzare i loro profitti e a minimizzare le perdite.
-
Facilità d’uso: Con un’interfaccia intuitiva e facile da usare, questo indicatore è adatto sia ai trader principianti che a quelli esperti.
-
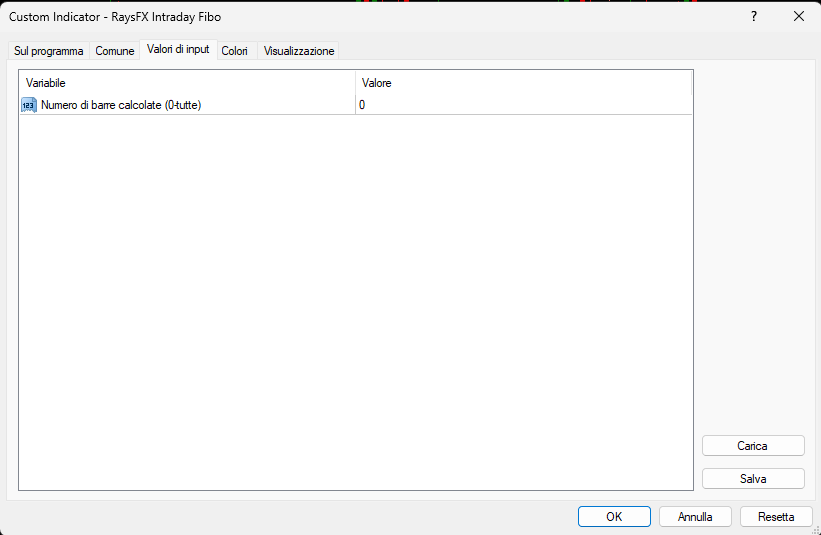
Personalizzabile: L’indicatore offre la possibilità di personalizzare il numero di barre calcolate, permettendo ai trader di adattare l’indicatore alle loro specifiche strategie di trading.
-
Compatibilità: L’indicatore è compatibile con tutte le piattaforme di trading che supportano la programmazione MQL4.