IQ FX Correlation Matrix
- インディケータ
- バージョン: 1.7
- アップデート済み: 20 9月 2025
- アクティベーション: 5

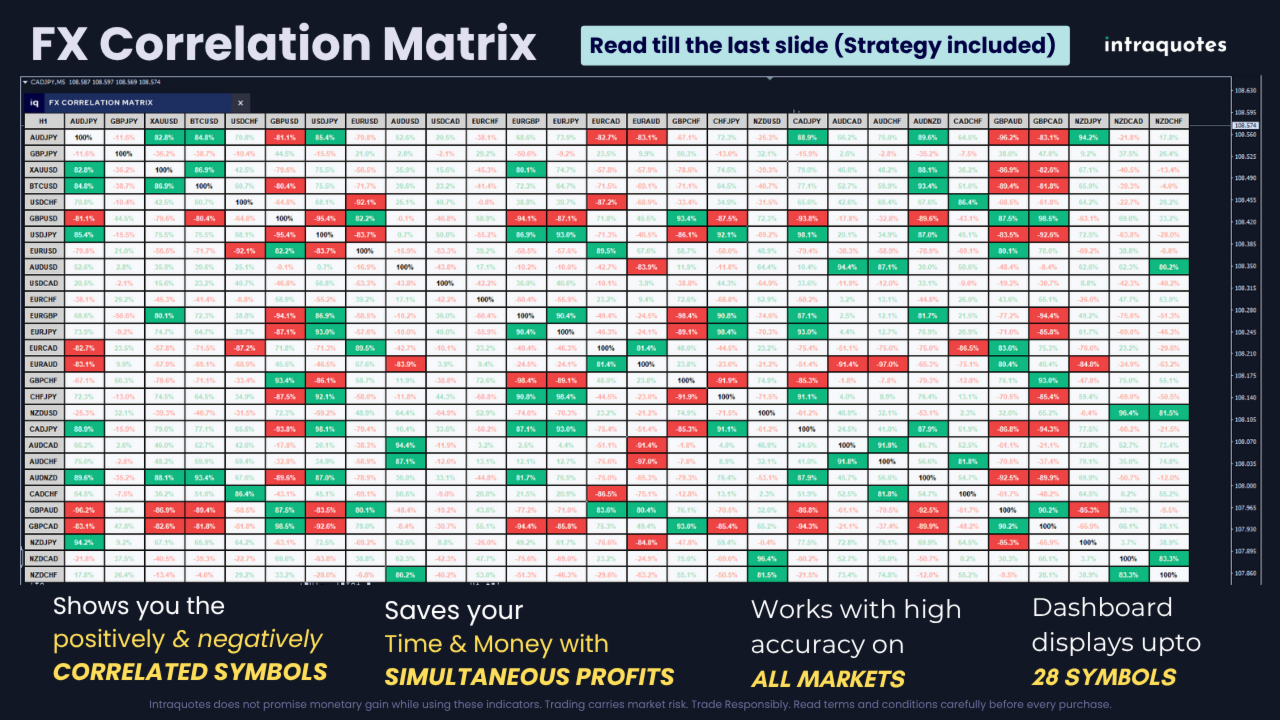
FX Correlation Matrix is a powerful multi-timeframe dashboard that helps traders analyze real-time currency correlations of up to 28 symbols at a glance. With customizable settings, sleek design, and manual symbol selection option, it enhances trade accuracy, reduces risk, and identifies profitable correlation-based opportunities.
Setup & Guide:
Download MT4 Version here.
Follow our MQL5 channel for daily market insights, chart, indicator updates and offers! Join here.
Disclaimer:
- Due to regulatory and compliance restrictions, our service, including personalized technical support and one-on-one troubleshooting, is unavailable in India, Pakistan, and Bangladesh. Products purchased from these regions are ineligible for these services after purchase.
- Our products are available only on mql5.com.
- We never contact anyone or sell our products privately.
- We do not provide any personal trading advice.
- We do not sell any of the Intraquotes products on Telegram or any other platform, or website.
- This product operates only on standard MetaTrader 4 / MetaTrader 5 platforms. Third-party or modified environments are not supported.
- Not compatible with offline charts or custom/synthetic symbols.
- Does not provide Data Window values or buffers for EA integration.
- Intended strictly for manual trading; automated or algorithmic usage is not supported.
- Multi-Timeframe, Multi-Currency Dashboard – Analyze correlation across multiple forex pairs and timeframes in one dashboard at a glance.
- Adaptable Dashboard Sizes – Supports SD, HD, Full HD, and 4K monitors for an optimized trading experience.
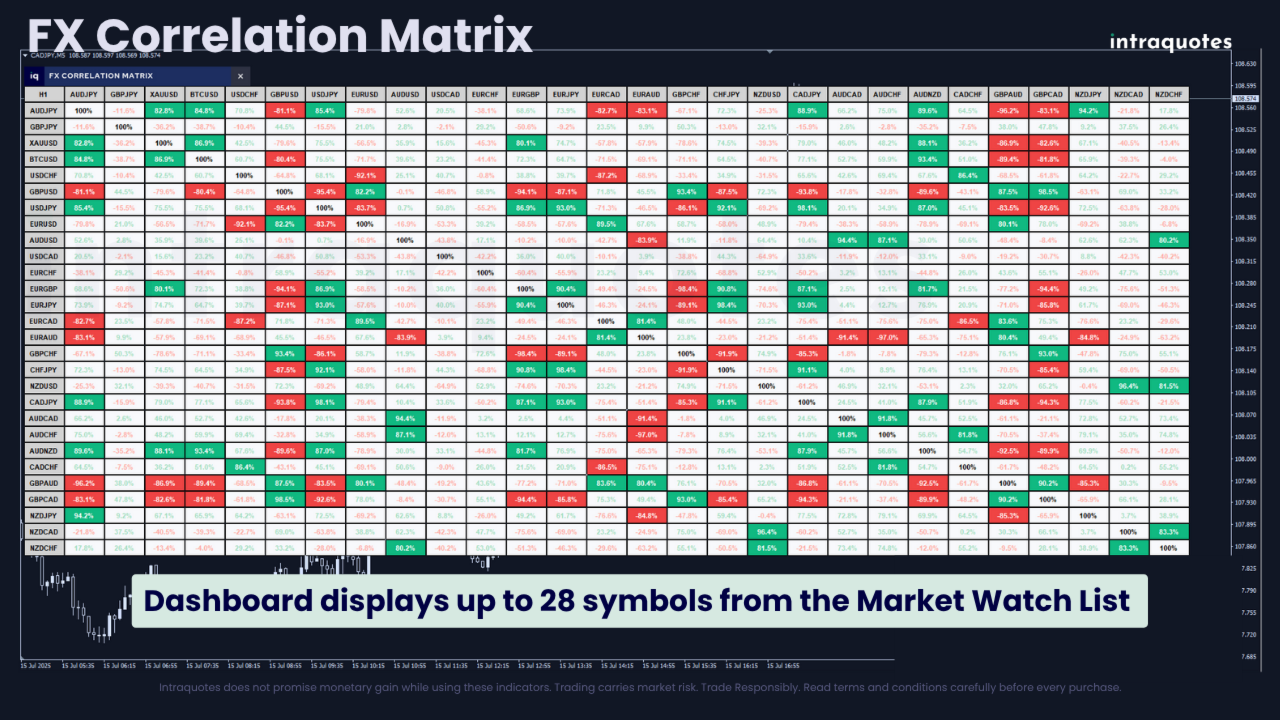
- Auto-Adjusting Dashboard Layout – The dashboard dynamically resizes in real time based on the available Market Watch symbols. If only four symbols are listed, the dashboard instantly adjusts to display a 4-symbol view without manual changes.
- User-Friendly Interface – Reposition and customize the dashboard for seamless trading.
- 5 PC Activation – Use the indicator across multiple brokers and devices for greater flexibility.
Recommendation: Use this indicator on a separate chart for optimal performance.
1. Why is the FX Correlation Matrix Indicator Extremely Useful?- Enhances trading accuracy – Identify strong and weak currency correlations to make better trading decisions.
- Maximizes profitable trade opportunities – Detect positively and negatively correlated pairs to capitalize on profits.
2. Who is This Indicator For?
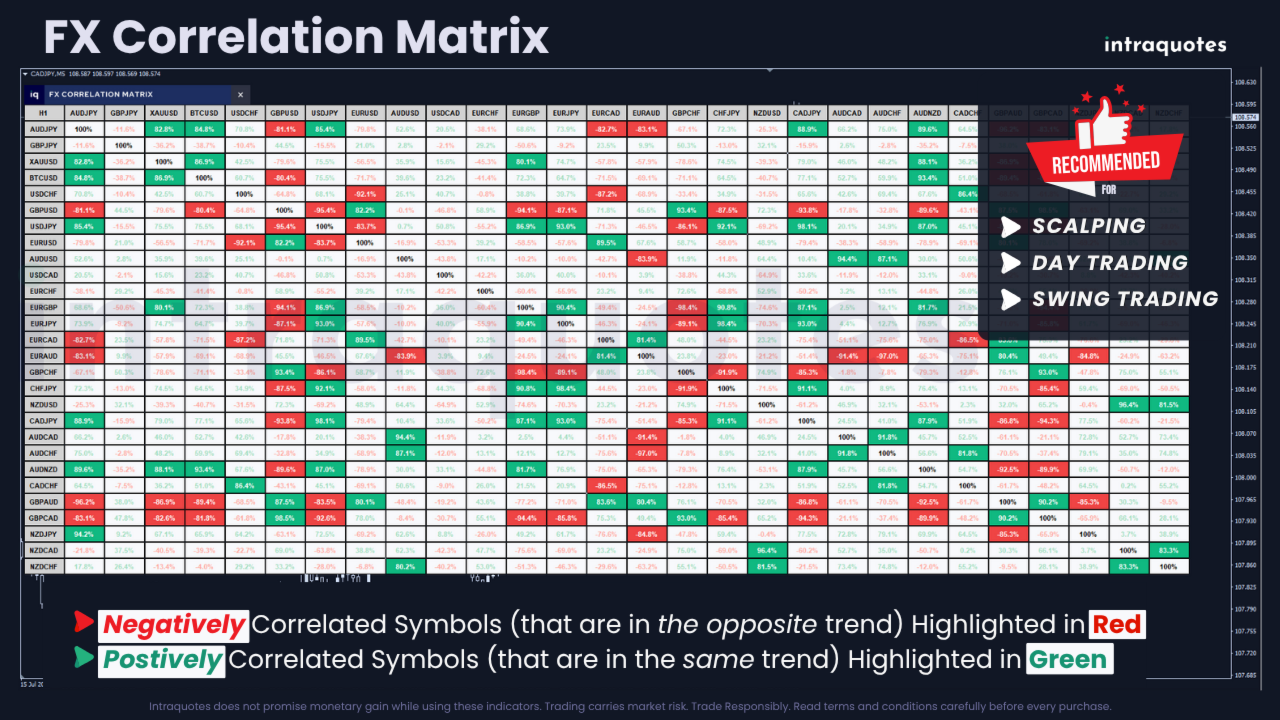
This tool is perfect for traders who understand forex correlation and want to enhance trade accuracy, minimize risk, and maximize profits. Whether you're a scalper, intraday trader, or swing trader, the FX Correlation Matrix helps you trade smarter.
Note: This indicator cannot be used solely to make any final trading decision. This tool helps to confirm your trading decision before you place your trade. You must place a trade after analysing trend direction, price action formation, and nearby support and resistance levels to avoid financial loss.
3. Supported Symbols List
Works with forex major and minor pairs, metals, indices, cryptocurrencies, and more across all timeframes.
4. Symbol Limit
The indicator supports up to 2 dashboards across 2 charts at a time, allowing you to monitor up to 56 symbols simultaneously.
5. Applicable Timeframes
Applicable across all 9 timeframes: 1M, 5M, 15M, 30M, 1H, 4H, 1D, 1W, MN.
6. Backtesting Note
In Strategy Tester, only one symbol displays. Custom symbols and full 28-symbol data aren’t supported.
7. How to Get Started with FX Correlation?
- After purchasing, open MetaTrader Software, log in to your account, and open Toolbox - Market - Purchased.
- Install the indicator.
- Open Navigator - Market - Drag and drop the indicator to the chart.
- Follow the matrix dashboard to track the correlation for confident trading.
- Monitors multi-currency correlations – Provides real-time correlation values in percentage format.
- Positive and negative correlation signals – Green highlights strong positive correlations, while red indicates negative correlation of divergent pairs.
- Supports basket trading strategies – Helps traders manage multiple trades across correlated assets.
- Multi-Timeframe, Multi-Currency Dashboard - Visualize correlations across multiple symbols and timeframes with ease. This dashboard gives a clear picture of how currency pairs move in relation to one another, allowing you to capitalize on cross-pair opportunities and enhance your trading strategy.
- 5 PC Activation for Multiple Brokers - Trade across multiple broker platforms with the flexibility of five PC activations. Whether you're working with different brokers or switching between accounts, this feature ensures smooth and uninterrupted access to the indicator.
- Enhanced Correlation Dashboard - The design has been upgraded for improved readability, cleaner layout, and a more professional look to help you interpret data faster and more accurately.
- Dark & Light Theme Options - Switch between dark and light modes for optimal visibility and comfort based on your trading environment.
- Customizable Theme Colors - Fully personalize correlation highlighters and dashboard elements for both dark and light themes, including positive and negative correlation text, neutral/highlight/strong backgrounds, headers, borders, and default text colors.
- Smart Tooltips on Highlighted Cells - Hover over any highlighted correlation cell to instantly view the exact symbol pair and correlation value (for example, EURUSD vs GBPUSD = 90%), providing instant clarity at a glance.
- User Conveniences - A highly intuitive interface simplifies your trading experience, providing easy navigation, quick access to data, and seamless functionality.
- Adaptable Dashboard Sizes - Whether you’re using a standard monitor or a 4K display, the indicator adjusts perfectly with four different dashboard sizes to choose from. This adaptability ensures you can monitor the market in the way that best suits your needs.
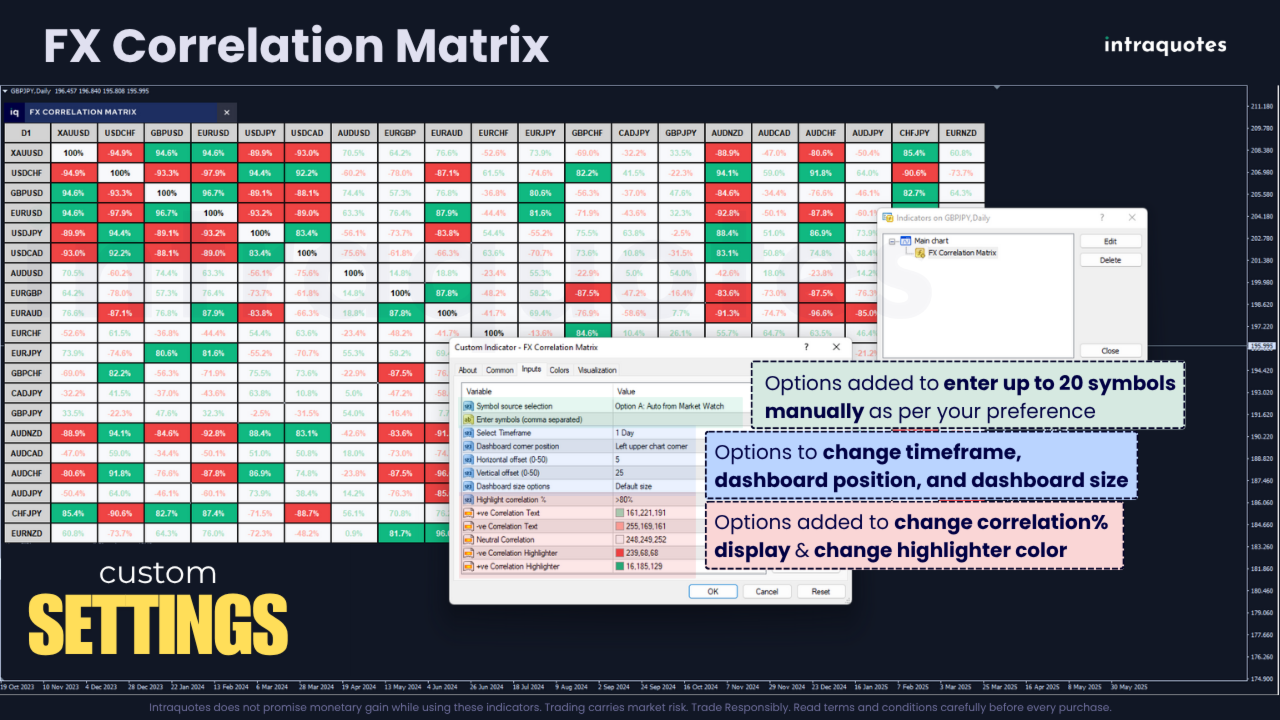
- Manual Symbol Selection – Auto-select up to 20 symbols from Market Watch or manually enter preferred symbols.
- Customizable Timeframes – Choose any timeframe for instant correlation analysis.
- Correlation Percentage Adjustment – Change the correlation % starting from greater than 50% to greater than 90% to suit your trading strategy.
- Symbols Rearrangement – Drag and move the symbols up or down in the Market Watch list to change their position in the indicator dashboard.
- Changing Symbol Highlighter Color – Adjust the symbol highlighter color as per your preference.
Note: Indicator does not have buffer output for EA integration.
11. Indicator Strategies: Boost Profits with Correlation AnalysisIdentifying Strong Currency Correlations
Symbols are often interrelated, and understanding these correlations can be the key to unlocking profitable trades. By analyzing how pairs move in relation to one another, you can identify strong correlations that help you predict price movements across multiple pairs.
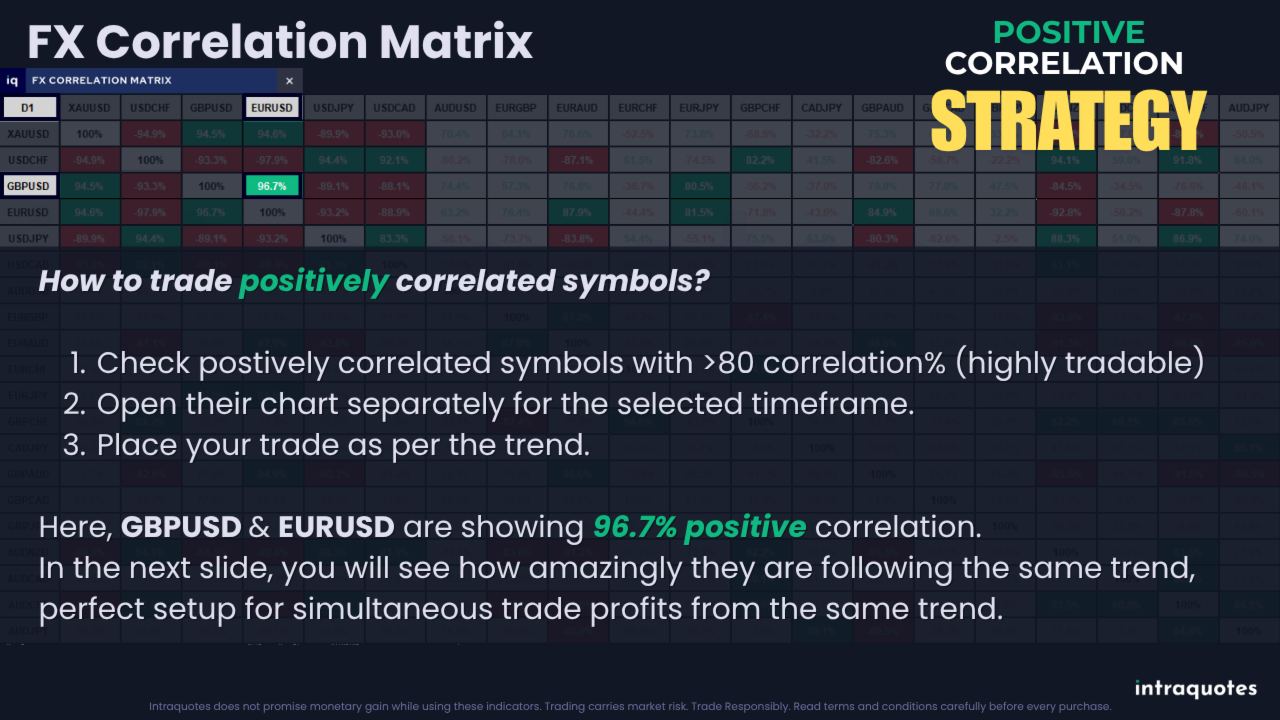
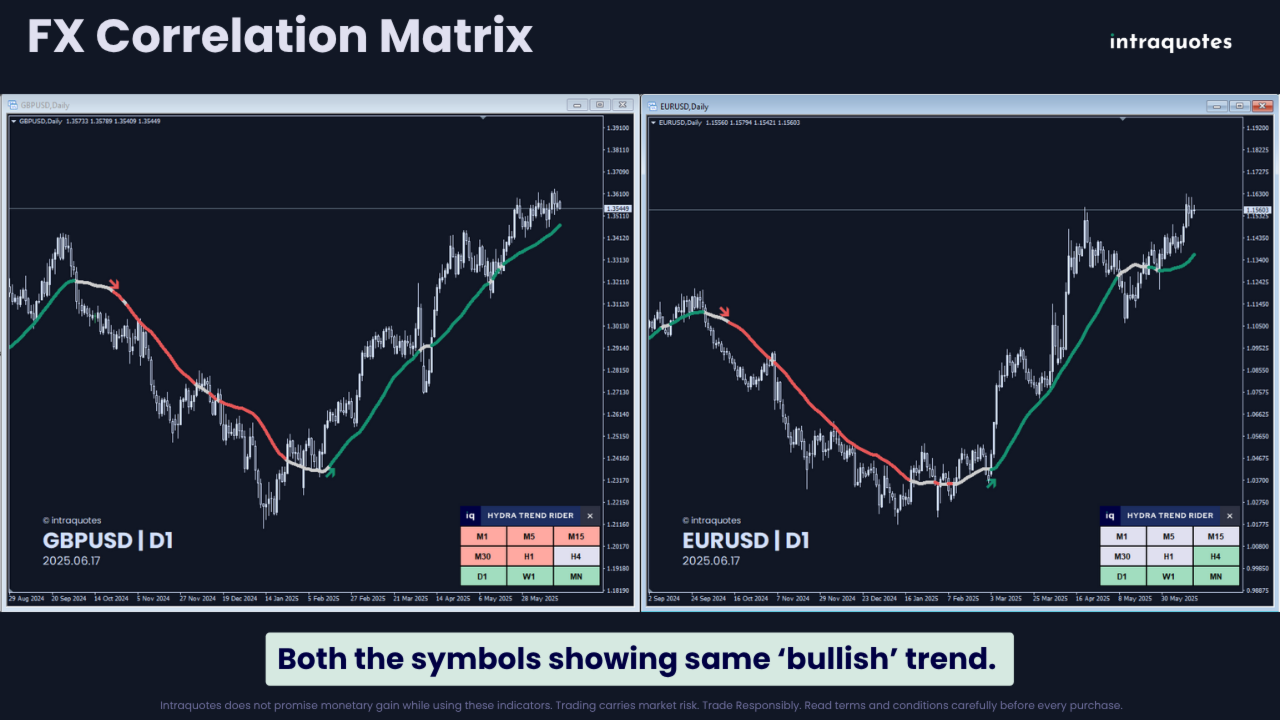
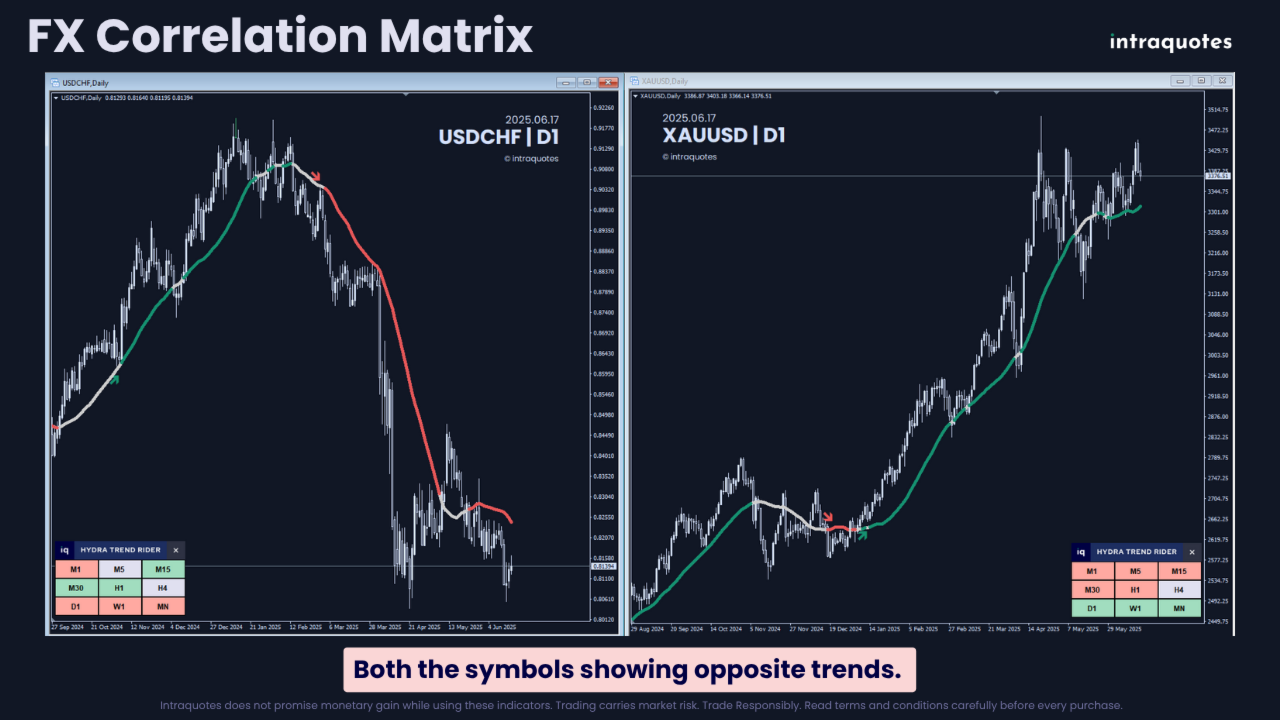
Understanding Positive CorrelationIf two symbols are highlighted in green with a high correlation %, it means both symbols follow the same trend (either both are bullish or both are bearish). If you plan to place a trade in one, you can trade the other to maximize profits and gain from both trades.
- Correlation less than 50% – Not so tradable.
- Correlation between 50% to 60% – Tradable but not preferred.
- Correlation between 60% to 90% – Tradable (following similar trend).
- Correlation greater than 90% – Highly tradable (strongly following similar trend).
Understanding Negative Correlation
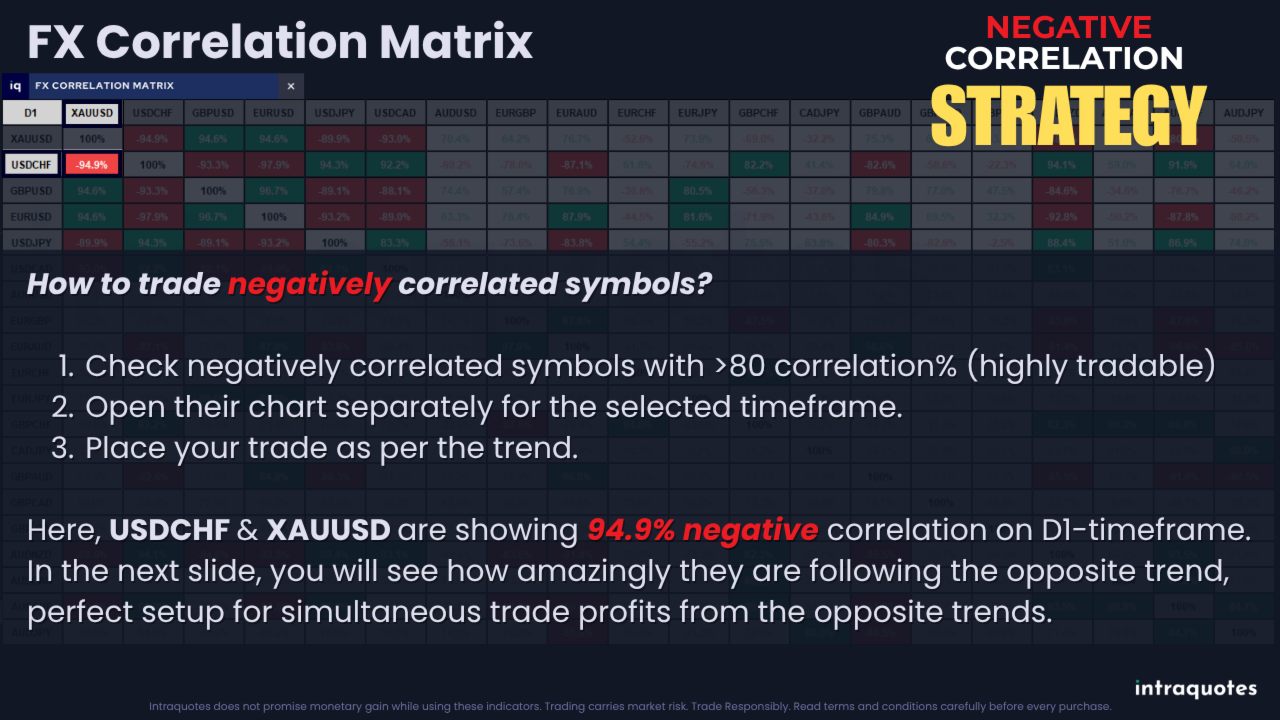
If two symbols are highlighted in red with a high correlation %, it means both symbols follow opposite trends (if one is bullish, the other is bearish). If you plan to place a buy trade in one, you will have to place a sell trade in the other to gain simultaneously from both trades showing divergent movement.- Correlation less than 50% – Not so tradable.
- Correlation between 50% to 60% – Tradable but not preferred.
- Correlation between 60% to 90% – Tradable (following opposite trend).
- Correlation greater than 90% – Highly tradable (strongly following opposite trend).
Reducing Risk through Diversification
Currency correlations allow you to reduce risk by spreading trades across correlated pairs. With the Forex Correlation Dashboard Indicator, you can easily spot opportunities for positively and negatively correlated pairs and build a more balanced trading portfolio.
Capitalizing on DivergencesWhen two positively correlated pairs begin to diverge, it can signal potential trade opportunities. This indicator helps you spot such divergences early, giving you a head start in capturing profitable trades when the pairs realign.
12. Merging it with other Indicators
This indicator is a tool to confirm and validate your decision. You need to have a strategy that works based on trend analysis, candlesticks, and price action. Often traders enter a trade at a wrong time and suffer financial loss. Check out the IQ Gann levels indicators (for both FX and Gold) to know the powerful Gann Support & Resistance levels where the market reacts accurately. This paired with the Hydra Trend Rider Multi-Timeframe dashboard can provide solid trend confirmation.
13. Indicator TroubleshootingIssue with symbol order: Symbols may display in reverse order and not start from the first ten of the market list.
Solution: Prioritize the symbols you frequently use for trading by placing them at the top of the Market Watch section. Conceal unnecessary symbols to enhance indicator performance.
Issue with loading data correctly on Indicator.
Solution: Load all desired symbols in your Market Watch before applying the indicator. Ensure MetaTrader historical data is loaded for the chosen symbols. If encountering "Data not synchronized" issues, allow 5-10 minutes for your terminal to load.
How to Do a Visual Backtest with Our Indicator?
Step 1: Download the entire history center database first (press F2 to access History Center).
Step 2: Click on the download button.
Step 3: After the download completes, close and restart MetaTrader.
Possible Issues with Backtesting.
Problem 1: "Waiting for update" message while backtesting.
Solution: This means insufficient data or poor internet connection. Download the full History Center data as explained above.
Problem 2: MetaTrader freezes during backtest.
Solution: This also happens because of insufficient data or a bad internet connection. Fix the connection before starting and follow the steps again.
14. Learn More at intraquotes MQL5 Channel
- For assistance, send us a direct message on MQL5.
- If you encounter any technical issues with the indicator, contact us directly on MQL5.