BreakHarmony MTF BreakOut BreakDown Indicator MT4
- インディケータ
-
Andras Salamon
 „Everything should be made as simple as it can be, but not simpler.”
 - バージョン: 1.1
- アップデート済み: 3 2月 2024
- アクティベーション: 5
BreakHarmony Multi-Timeframe Breakout Indicator for MT4
The BreakHarmony Multi-Timeframe Breakout Indicator for MT4 is a highly advanced tool providing information on breakout points across different timeframes, aiding traders in decision-making and understanding market movements.
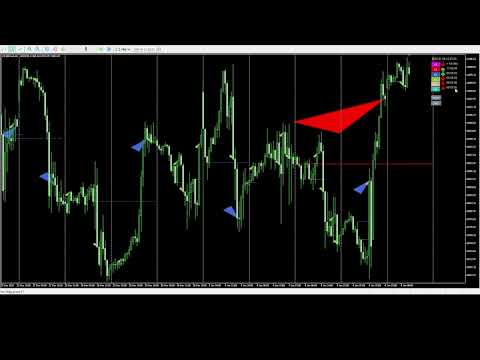
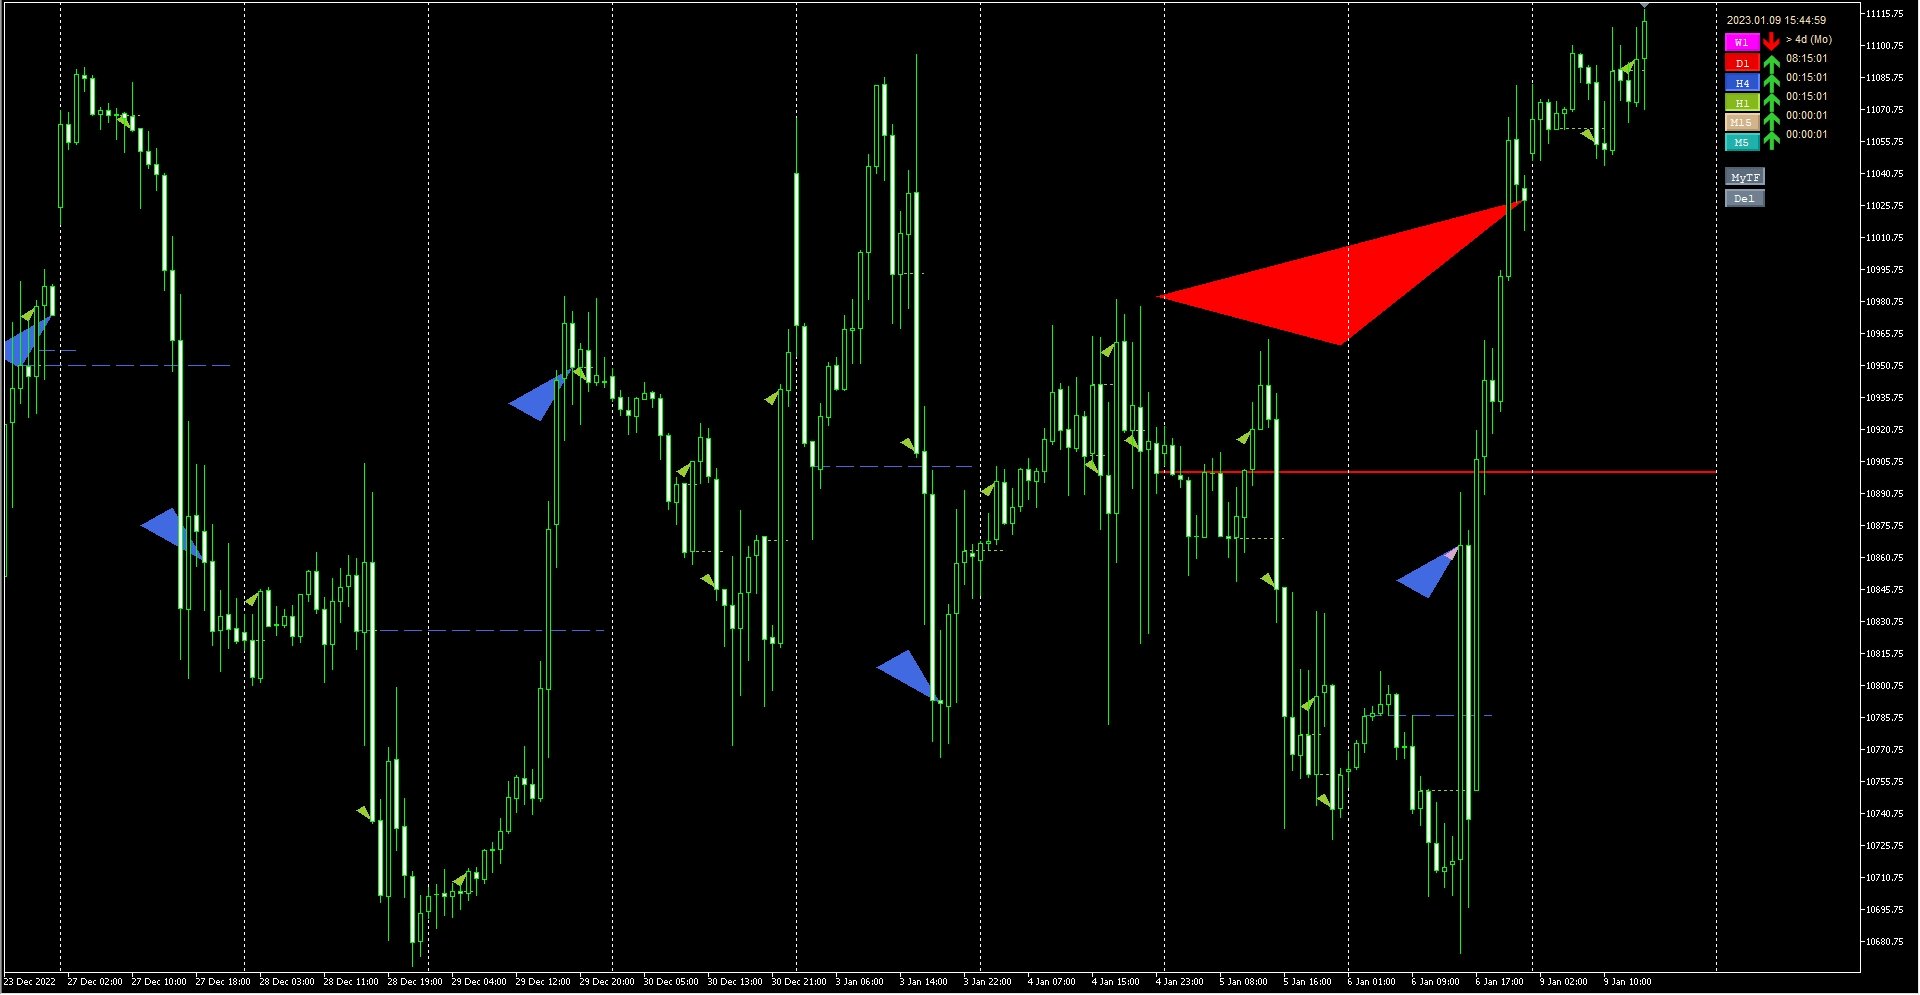
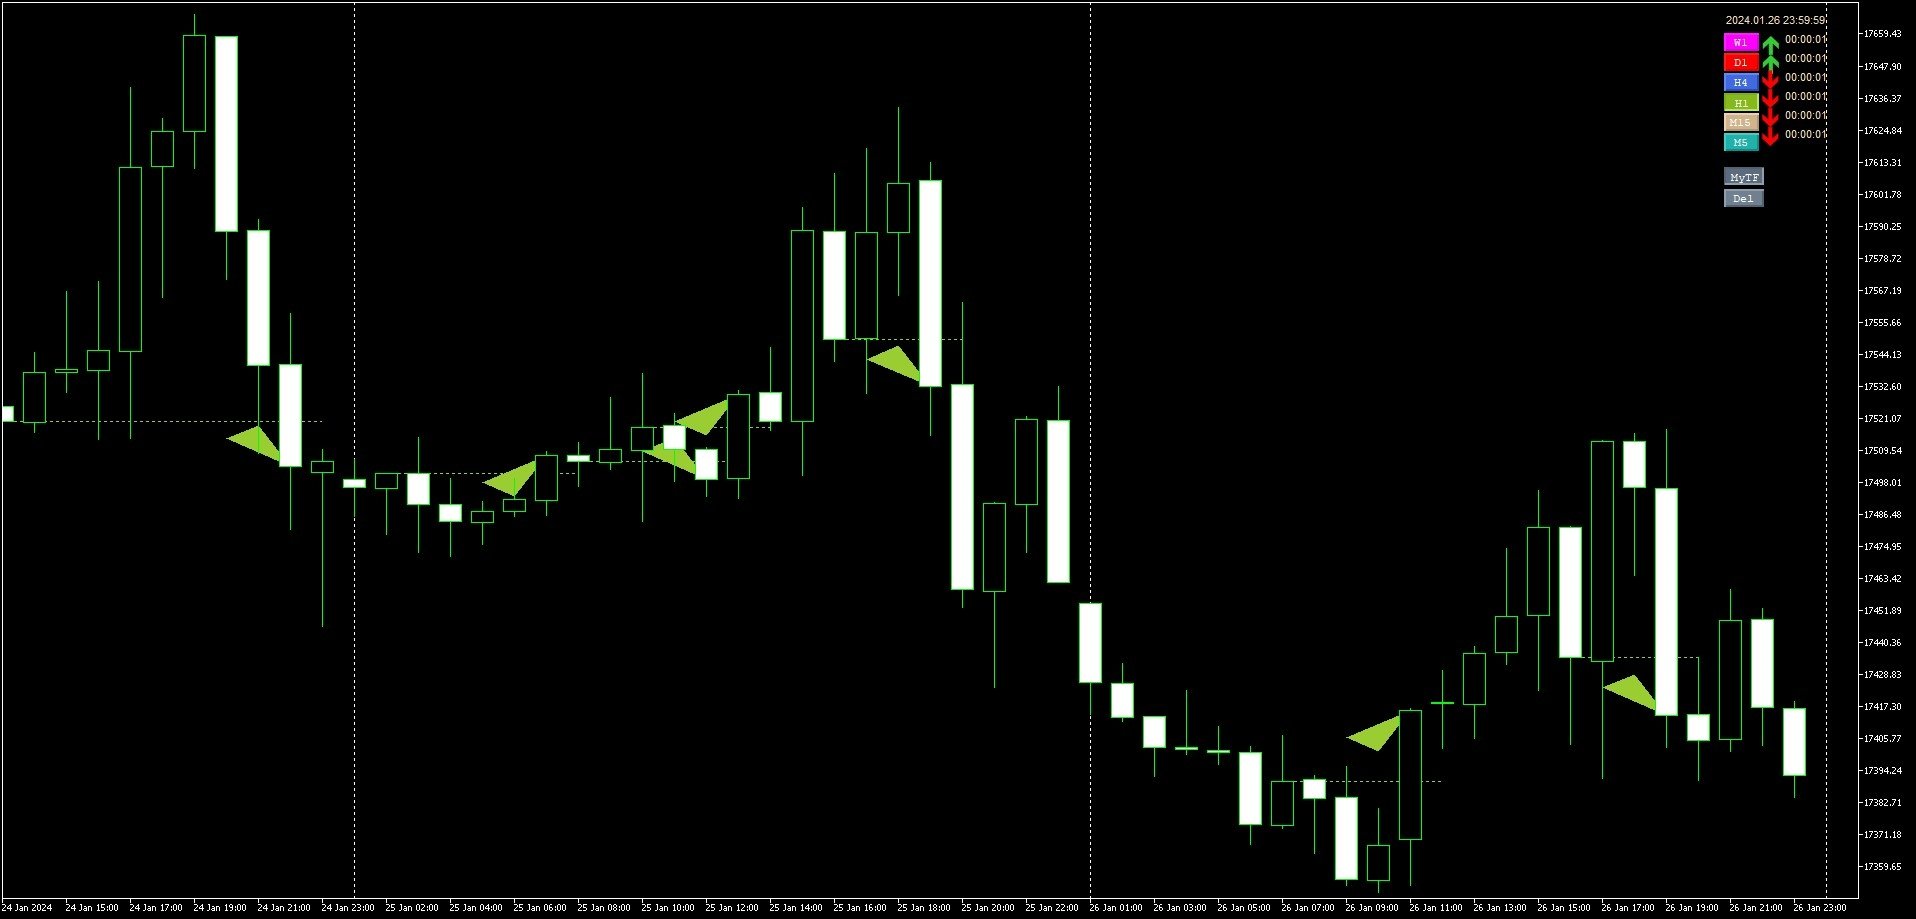
The indicator tracks breakout points on price charts across 6 timeframes. Breakout prices are indicated with the closing price of the corresponding candle, while broken resistance and support prices are also signalized by horizintal lines at the candles that have been broken above or below.
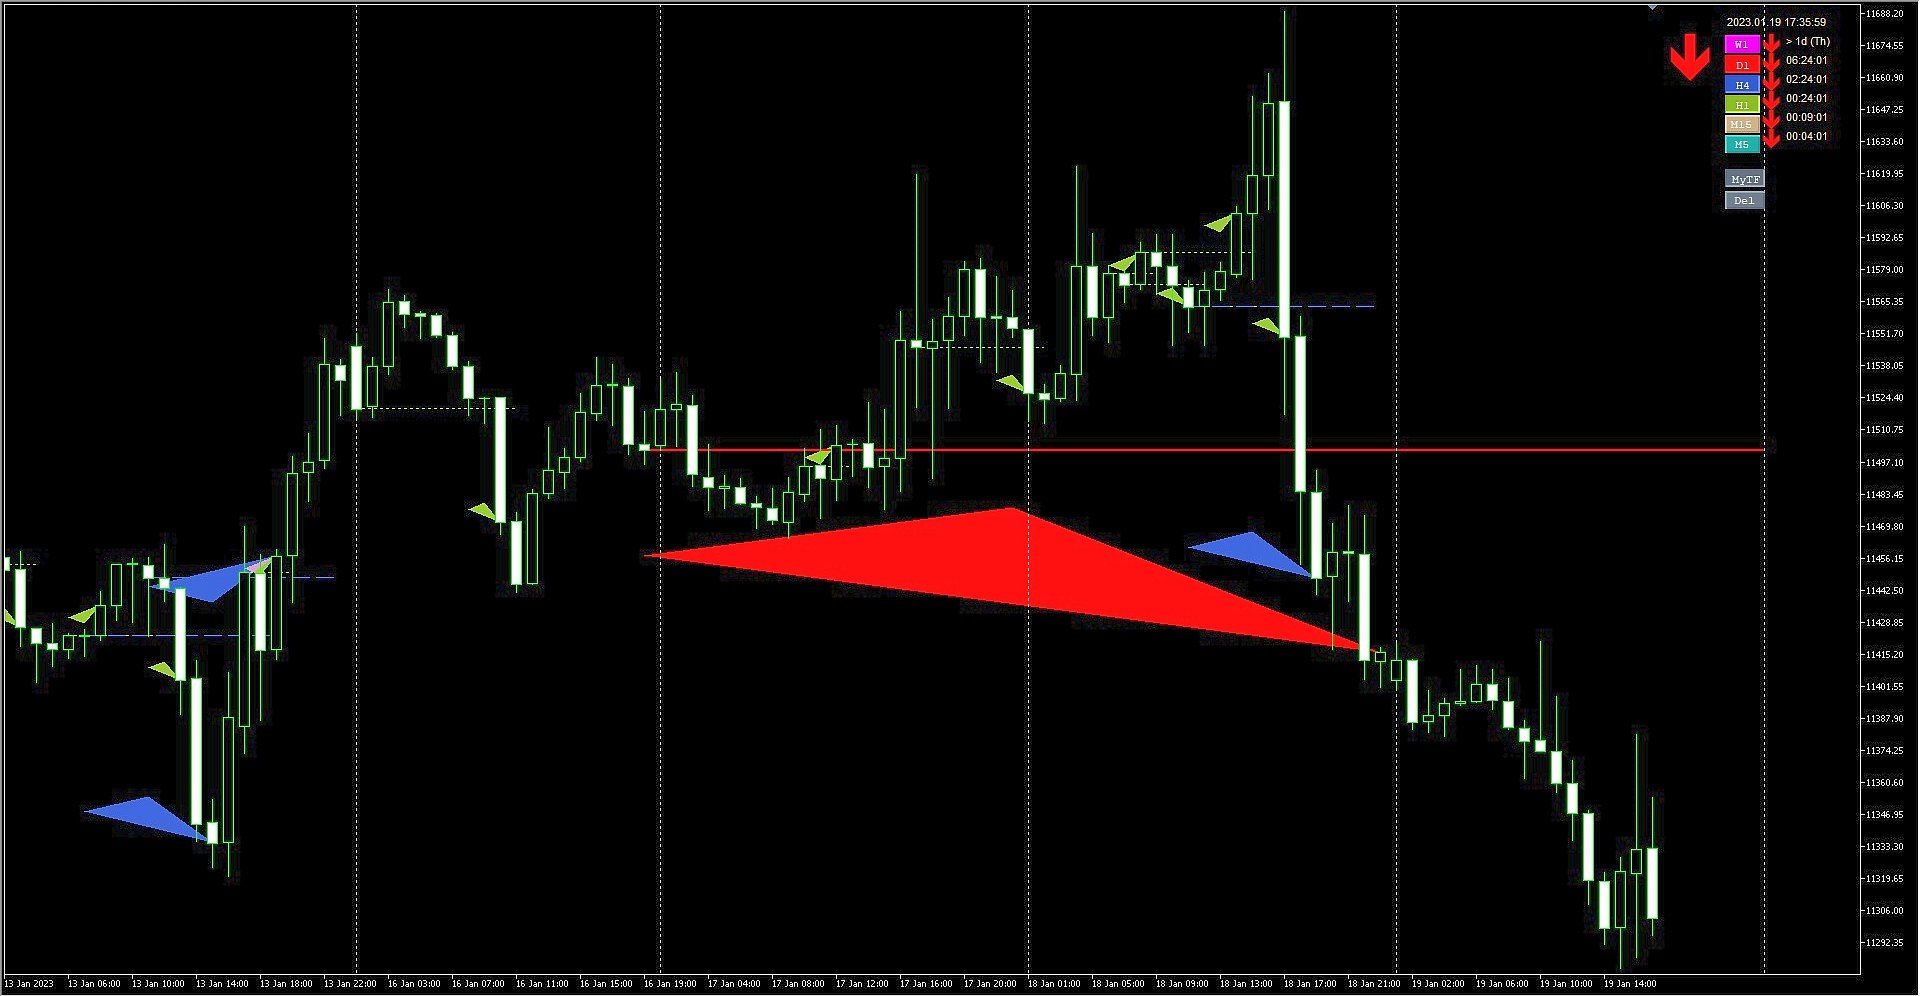
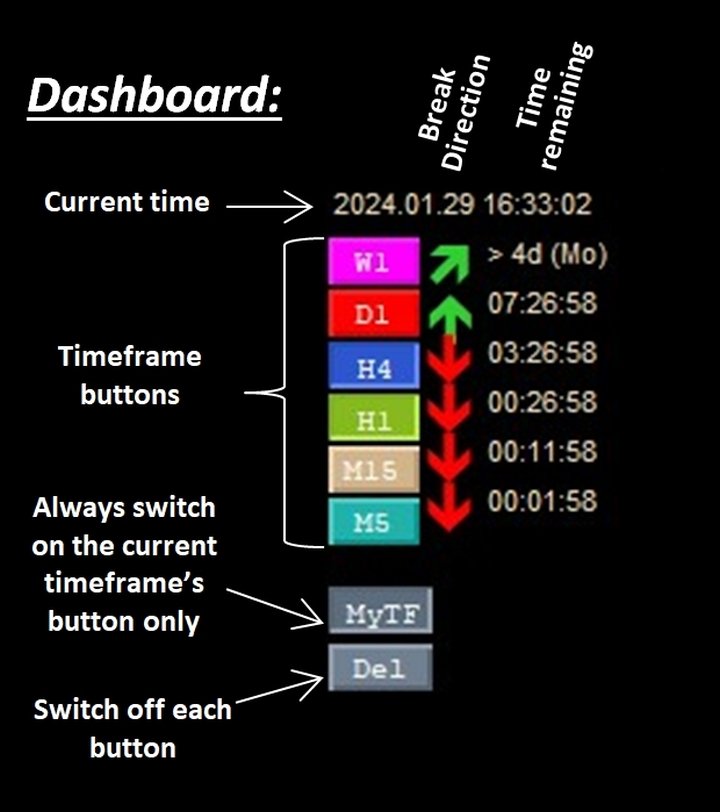
Results of the analysis conducted on each timeframe are summarized in a consolidated panel, allowing traders to quickly interpret the market situation. This feature is particularly useful, providing an instant overview of the prevailing breakout direction on each timeframe.
An additional advantage of the indicator is its display of the time remaining until the candle closes on each timeframe. This helps traders react to market events in a timely manner, optimizing their trading strategies based on the remaining time horizon.
The indicator goes a step further by providing advance signals on potential breakouts before the candle closes. On each timeframe, the directional arrow gradually shifts towards the anticipated breakout direction as the candle approaches its closure. This forward-looking feature serves as a valuable tool for traders, offering insight into the likely market direction before the candle is finalized. The change of the directional arrow as the candle progresses towards closure allows traders to preemptively gauge potential shifts in market sentiment, empowering them to make timely and informed trading decisions. This dynamic forecasting element adds a predictive dimension to the tool, enhancing its usability for traders seeking a proactive approach to market analysis.
The combination of an intuitive interface and detailed information enables traders to navigate efficiently across different timeframes, optimizing their trading decisions and increasing the likelihood of success. The indicator offers a comprehensive view of market dynamics, uniquely facilitating more accurate and informed trading.
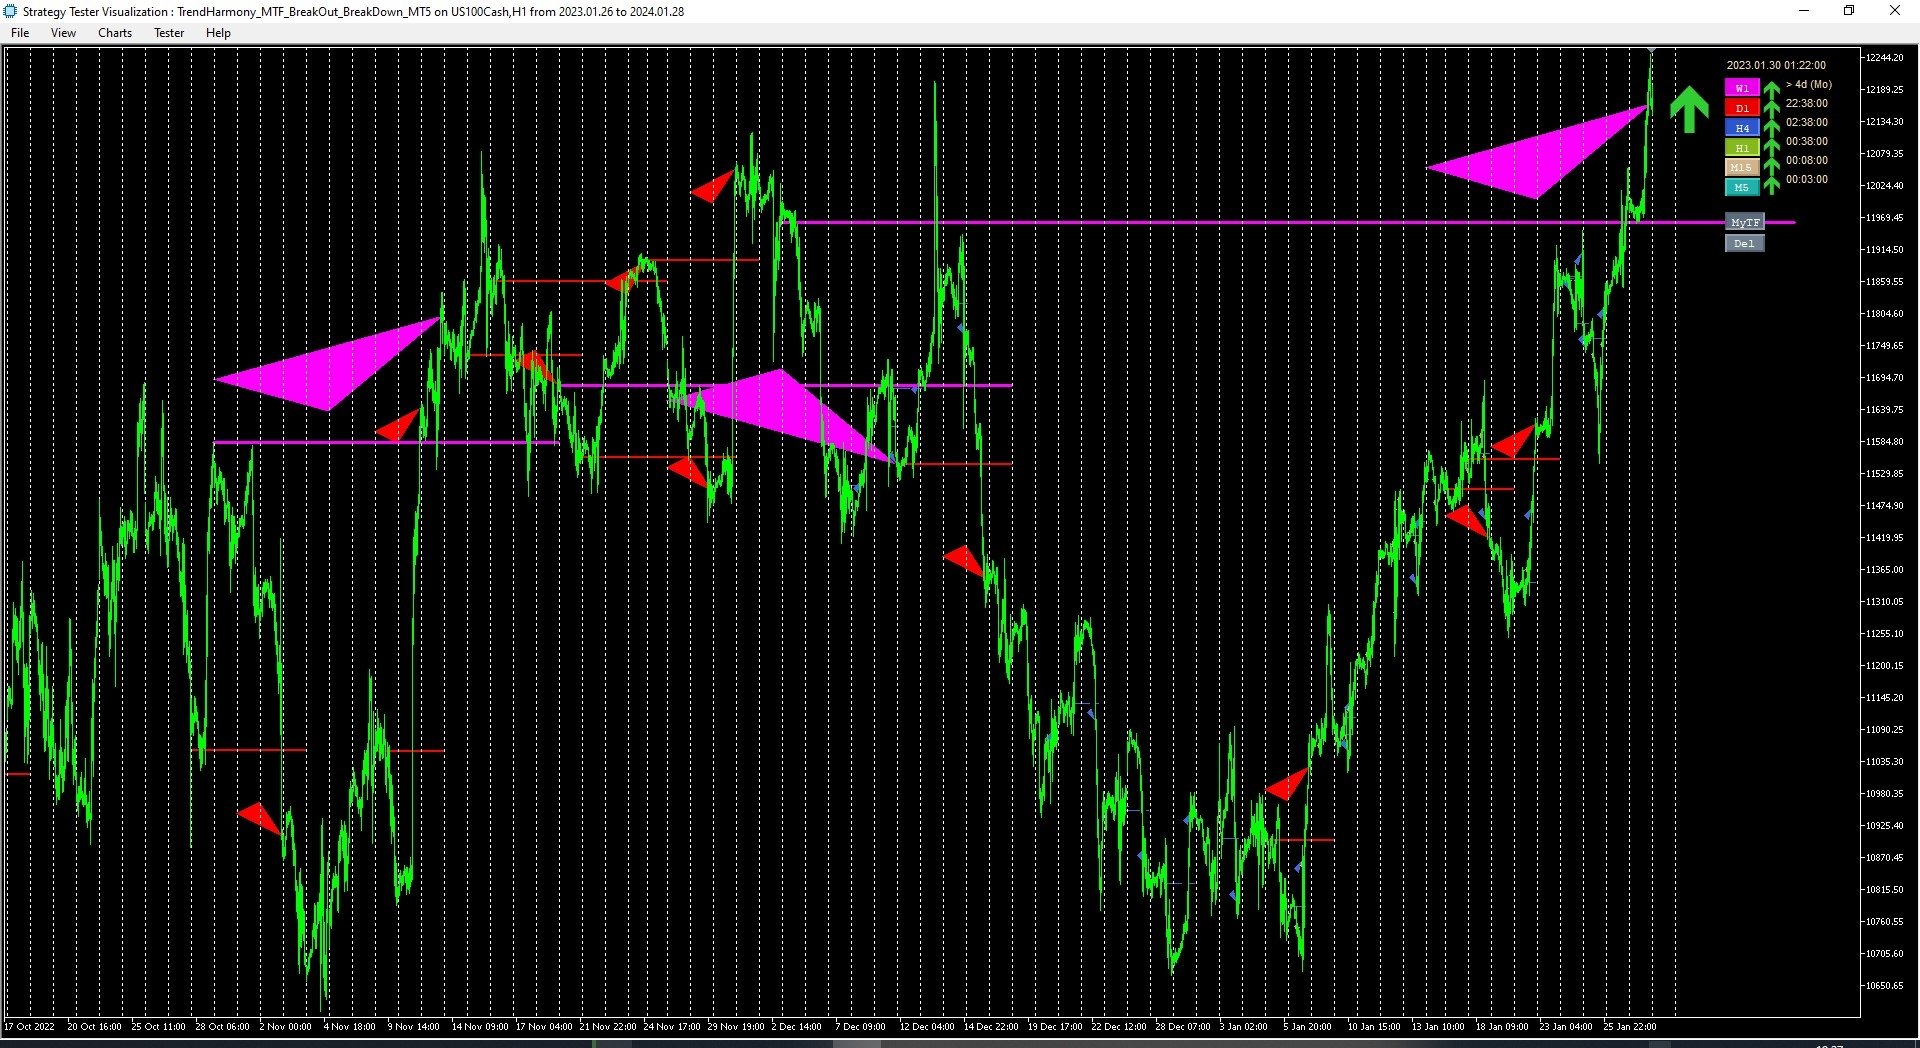
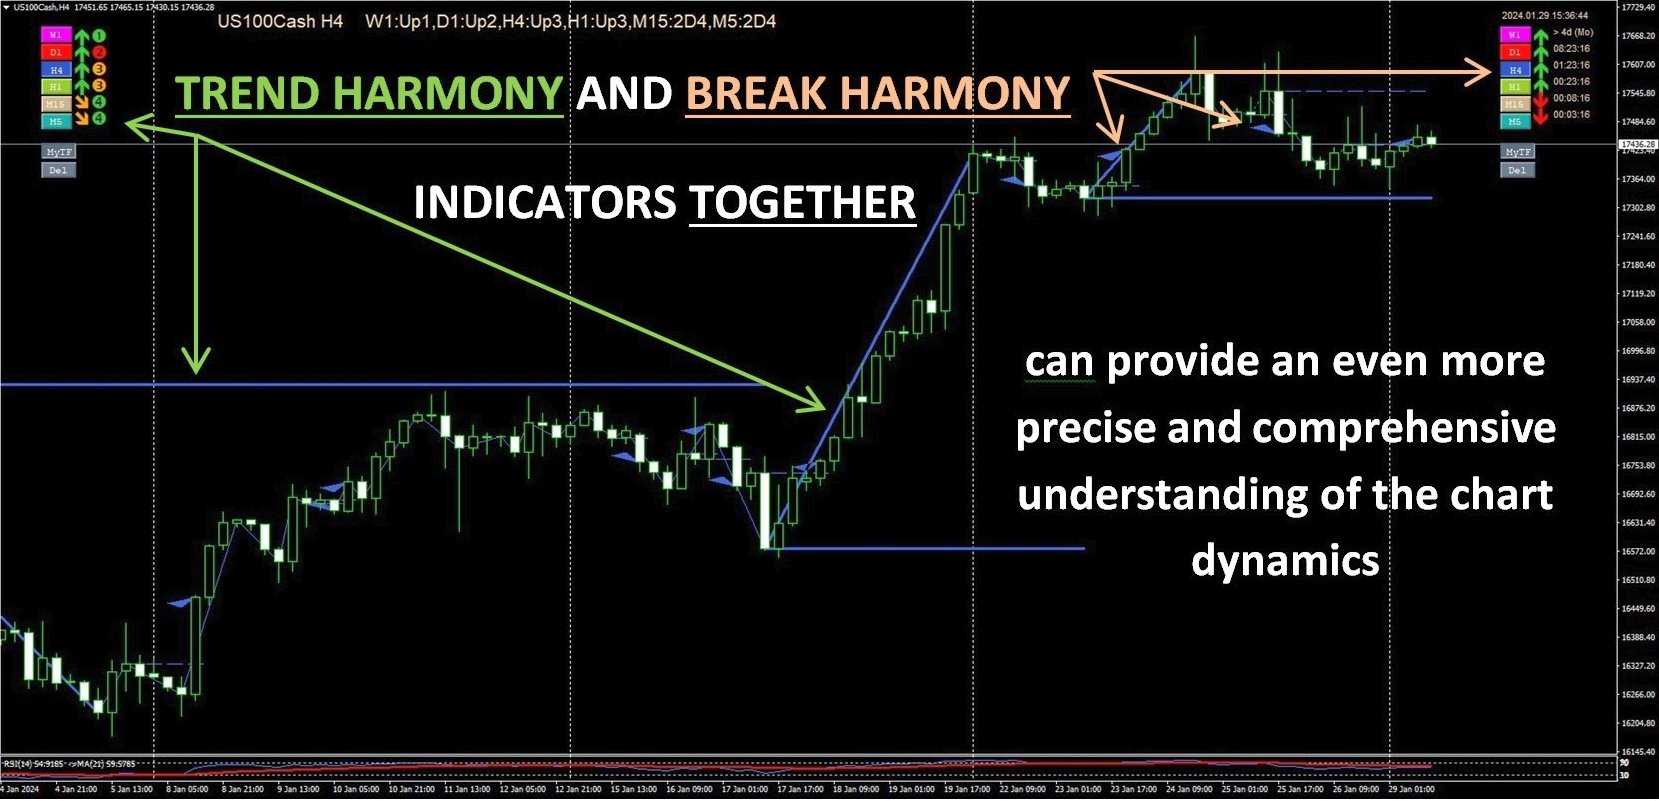
By combining the Trend Harmony indicator with the Break Harmony indicator, traders can attain an even more precise and comprehensive understanding of the chart dynamics. The Trend Harmony indicator, with its ability to identify and emphasize prevailing trends across multiple timeframes, works synergistically with the Break Harmony indicator's capacity to pinpoint breakout and breakdown points. Together, these indicators create a holistic view of the market, integrating trend analysis with breakout signals.
As the Trend Harmony indicator highlights the overarching market direction, the Break Harmony indicator complements this information by identifying critical points where significant price movements are likely to occur. The synergy between the two indicators enables traders to align their strategies with both the broader trend and potential breakout opportunities.
**For proper operation please make sure historical data is downloaded for every timeframe or reduce analyzed period (at HOW_MUCH_TIME_TO_ANALYSE inputs)**
NOTE: BREAK HARMONY - MTF BreakOut Indicator is compatible with MetaTrader 4 and is designed to enhance, not replace, your trading strategy. Trade responsibly!
For MT5 Version: Click here.
For more detail please Click here.