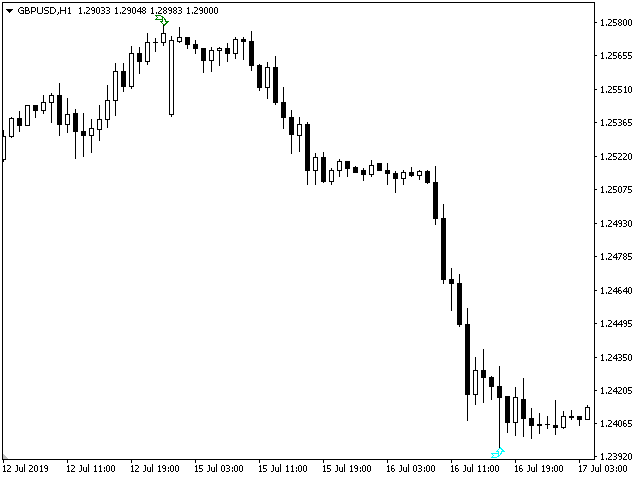
• 概要
  • レビュー
  • コメント

Trend Oracle

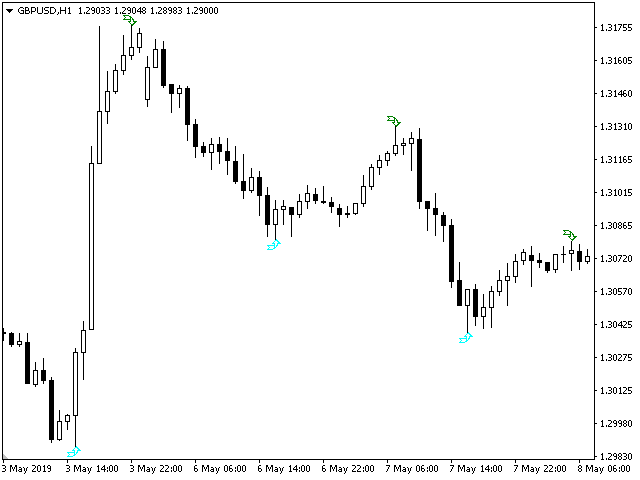
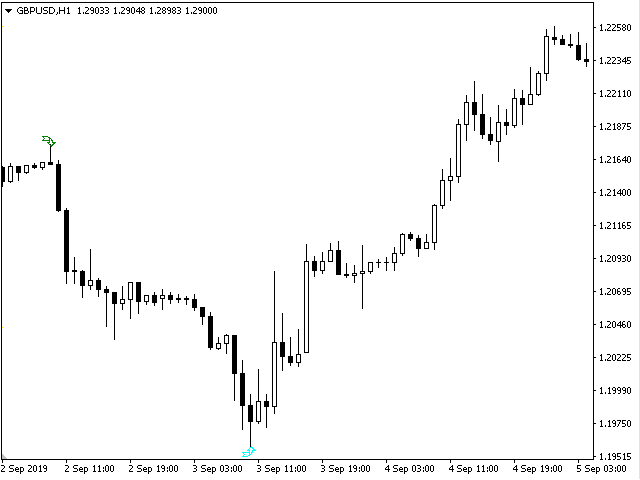
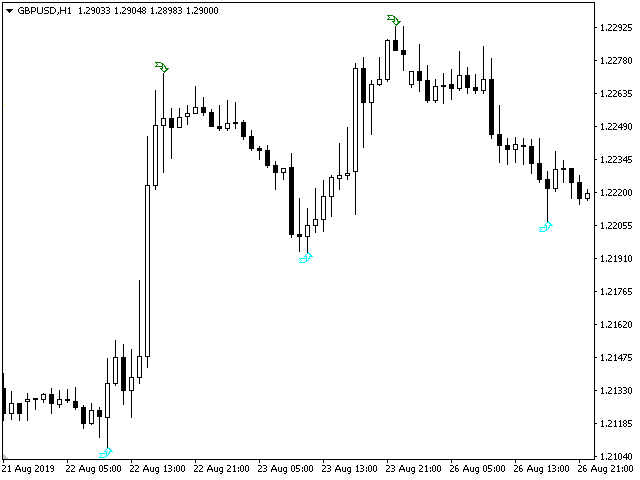
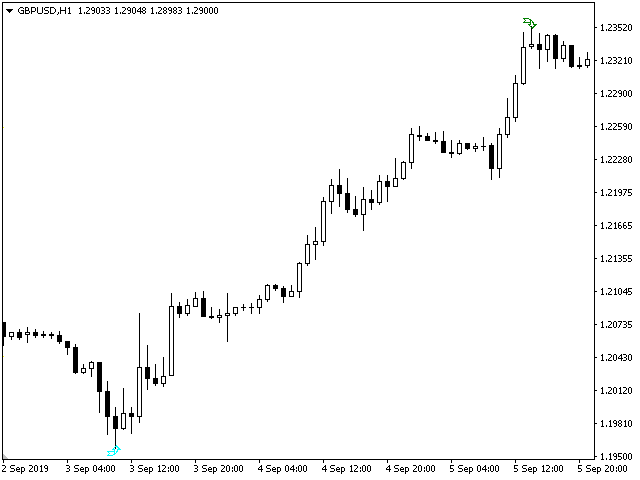
Trend Oracle trend indicator, shows entry signals. Displays both entry points and the trend itself. Shows statistically calculated moments for entering the market with arrows. When using the indicator, it is possible to optimally distribute the risk coefficient. The indicator can be used for both short-term pipsing and long-term trading. Uses all one parameter for settings. Length - the number of bars to calculate the indicator. When choosing a parameter, it is necessary to visually similarize so that there is a slight projection of extrema on the corresponding chart. Works on all currency pairs and on all timeframes. When using, it is recommended to look at the additional indicator of the filter of possible false signals.
おすすめのプロダクト
Fibonacci Currency Strength Meter (FCSM) Early Access Sale!! This new product is still in the process of adding new features and settings. For early bird buyers. The Price will be 50% Sale. In a few weeks, the product will be done. Go Grab your copy while it's still cheap. More details will be added soon. Things to be added. Alert Levels Mobile and Email Alert From it's name, Fibonacci Currency Strength Meter is a combination of Fibonacci levels and Currency Strength Meter. The plot of Fib
APP System Signalsは、金融市場で活動するトレーダー向けに設計された洗練された指標です。この指標は、高度なテクニカル分析に基づいて正確な売買シグナルを提供し、トレーダーが賢明な取引を行うのを可能にします。指標は指数移動平均線(EMA)、単純移動平均線(SMA)、基本的なトレンドの組み合わせを使用して信頼性の高いシグナルを生成します。パラメータは完全にカスタマイズ可能であり、トレーダーは自分の取引戦略に指標を適合させることができます。さらに、この指標は使いやすく、すべての経験レベルのトレーダーにとって不可欠なツールです。初心者であっても経験豊富なトレーダーであっても、APP System Signalsは取引のパフォーマンスを向上させ、市場でより賢明な決定をするのに役立ちます。
WPR by Profile, or WPR for Professionals Geo_WprPro is one of the well-known currency profile indicators. It simultaneously displays two WPR indicators with different parameters in the matrix form on all timeframes of multiple currency pairs forming the currency profile . As follows from the description, " WPR is a leading indicator that often goes ahead of the price chart. The oscillator frequently reaches extreme values before the price reversal as if anticipating that event: it almost always
Indicator for binary options arrow is easy to use and does not require configuration works on all currency pairs, cryptocurrencies buy signal blue up arrow sell signal red down arrow tips do not trade during news and 15-30 minutes before their release, as the market is too volatile and there is a lot of noise it is worth entering trades one or two candles from the current period (recommended for 1 candle) timeframe up to m 15 recommended money management fixed lot or fixed percentage of the depo
Cancer indicator is great for trend trading! An intelligent indicator algorithm with high probability shows the points of potential market reversal. If you are trading in a trend, then a trading strategy built on the basis of this indicator is perfect for you. The indicator filters out market noise, almost everything and all the necessary functions for working with a thread are built into one tool. It works on all currency pairs and on all timeframes, indicator setting - according to your desire
Strong Retracement Points Pro demo edition! SRP (Strong Retracement/Reversal Points) is a powerful and unique support and resistance indicator. It displays the closest important levels which we expect the price retracement/reversal! If all level are broken from one side, it recalculates and draws new support and resistance levels, so the levels might be valid for several days depending on the market! If you are still hesitating to start using this wonderful tool, you can check this link to see h
Hi Trader, We are strategy development for Binary and Forex tools, our product have success for binary trading 1 min - 2 min experation. At the moment I build indicator for trading all day, not like Bonosu series with specific time. We launch A-Boss Stats Indicator for trading 1 minute to 5 minutes experation is mean can trade from 1 minutes - 5 minutes. Specification of A Boss Stats trading binary option: Work with all MT4 broker. Chart Time Frame M1 only, can use M5 Experation time for contact
The indicator displays signals on the chart of the classic RVI indicator with an alert. The indicator signals after confirmation of the strategy at the opening of a new bar. I recommend watching my advisor -   Night Zen EA In the settings, you can select the following strategies: The main line crosses the signal line The main line crosses the zero level In the settings, you can change the period of the classic RVI indicator. I also recommend to look at my other developments in the market:
FREE
Ema Dashboard is an innovative dashboard that allows you to monitor Moving Average on multiples symbols and different timeframes. This dashboard allows you to analyze information on 28 pairs on an unique chart. Its functionality includes analysis of All Time Frames. This configuration allows you to identify the Long Term Trend with extreme ease. This panel allows you to take very important directional movements. A click on button opens a new chart (symbol and timeframe). Graphic Object Symbol
[75% OFF! - SALE ENDS SOON] -  RevCan Trend Entry Point is a trend based trade alert indicator for serious traders. It does all the price and chart analysis all by itself, and whenever it finds any potential high quality trading opportunity(Buy or Sell) using its revolutionized price prediction algorithms, it sends instant trade alert directly on the chart, MT4 terminal and on the mobile device.  The trade signals will be visible on the chart as Up and Down arrows, while the instant audible aler
This indicator continuously changes the color of candlestick borders and bodies, as well as the color of volumes in real time. The indicator is easy to use. The palette of colors is diverse. This product is a graphical solution, so it is difficult to describe what it does by text, it is easier to see by downloading it, besides the product is free. The indicator is suitable for bloggers who want to create a beautiful picture of a chart for video editing or traders who want to make their chart al
FREE
スキャルピングインスタントインジケーター。 インディケータの地下値と一緒に売買するシグナルは矢印で示されます。 矢印と4つの時間枠を表示する地下インジケーターが予測で一致する場合、強い信号が考慮されます。 このインディケータには、1つの結果にまとめられた多くのアルゴリズムとタスクが含まれています。これは、Skalpingインスタントインディケータが提供します。つまり、トレーダーに市場の方向性を通知します。したがって、彼は与える 1.スキャルピングシグナル(図1)図1-D1に示すように、D1チャートの選択された期間とインジケーターの地下セクションに買いシグナルがあります。信号は遅滞なく到着します。この場合、スキャルピング戦略を使用して取引することをお勧めします。 2.信号補正またはトレンド。 図2に示すように、地下室のグラフのすべての期間。すべての期間はレッドゾーン->売りポジションにあります。チャート自体の時間枠と地下インジケーターが一致したときに色が変わるまで取引を保持します。 そのため、インジケーターは他の戦略に非常に適応できます。 主要通貨ペアで使用する
great tool for any trader for both Forex and binary options suitable for any trader no need to configure anything, everything has been perfected by time and experience The tool combines 5 indicators and 3 proprietary strategies works great during flats and trends It indicates a trend reversal at its very beginning, it works well with the trend Trading Recommendations The signal is formulated on the current candle You should enter the trade at the next Possible recount (rare)
SWING X Blackは、MetaTrader 4(MT4)インジケーターの画期的なツールです。バイナリーオプションと外国為替の両方の手動および自動取引に対応するように精巧に作られています。比類のない精度とさまざまな時間枠への適応性が、利益を最大化したいトレーダーにとって強力なツールとなっています。SWING X Blackは15分の時間枠に最適化されており、迅速な意思決定と迅速な取引実行に最適です。また、トレーダーはマーチンゲール戦略を後続の信号に使用することを選択できるため、金融市場のダイナミックな世界に参入する際のリスク管理が強化されます。 主な特長: バイナリーオプションと外国為替の互換性: SWING X Blackは、バイナリーオプションと外国為替取引のギャップを調和的に埋め、トレーダーが両方の市場でその強力な洞察を活用できる多様性を提供します。このクロス互換性により、トレーダーは自分の好みの取引スタイルに関係なく、情報に基づいた意思決定をすることができ、成功の可能性を高めることができます。 正確な信号生成: SWING X Blackの核となる強みは、その非の打ちどこ
Introducing the Donchian Channels indicator for MQL4, a powerful technical analysis tool designed to boost your trading success. This indicator consists of four lines that represent the upper and lower boundaries of price movement over a specified period. With the Donchian Channels indicator, you can easily identify potential breakouts and reversals in the market. The upper line shows the highest high of the specified period, while the lower line represents the lowest low. The space between thes
The indicator is a trading system for AUDUSD or NZDUSD currency pairs. The indicator was developed for time periods: M15, M30. At the same time, it is possible to use it on other tools and time periods after testing. "Kangaroo Forex" helps to determine the direction of the transaction, shows entry points and has an alert system. When the price moves in the direction of the transaction, the maximum length of the movement in points is displayed. The indicator does not redraw, all actions o
Binary Options Assistant (BOA) ICE Signals Indicator provides signals based on gkNextLevel Binary Options Strategy.  Indicators: 2 Bollinger Bands & Stochastic Stop missing trades, stop jumping from chart to chart looking for trade set-ups and get all the signals on 1 chart! U se any of the BOA Signals Indicator with the  Binary Options Assistant (BOA) Multi Currency Dashboard .   All BOA Signal Indicator settings are adjustable to give you more strategy combinations. The signals can be
FREE
Introducing the "KFX Trade Manager" expert advisor for MetaTrader 4 (MT4), a comprehensive solution for advanced trade management and risk control. This powerful tool is designed to enhance your trading experience by automating various aspects of order handling, profit optimization, and alert notifications. With the "KFX Trade Manager," you can take your trading to the next level and streamline your operations for improved efficiency and better risk management. Key Features: Trade Management Set
TREND HARMONY MT4 –  Multi Timeframe Trend and Phase and Pullback Level Visualizer indicator for Metatrader4 The TREND HARMONY indicator automates deep trend analysis and generates visualizations for you. Take control of your trades by eliminating uncertainty! Revolutionize your trading experience with precision and insight through the TREND HARMONY Multi Timeframe Trend Indicator – your ultimate MT4 trend visualization indicator. Are you tired of missing trading opportunities or consistently e
PipFinite Exit EDGE
Karlo Wilson Vendiola
4.89 (160)
Did You Have A Profitable Trade But Suddenly Reversed? In a solid strategy, exiting a trade is equally important as entering. Exit EDGE helps maximize your current trade profit and avoid turning winning trades to losers. Never Miss An Exit Signal Again Monitor all pairs and timeframes in just 1 chart www.mql5.com/en/blogs/post/726558 How To Trade You can close your open trades as soon as you receive a signal Close your Buy orders if you receive an Exit Buy Signal. Close your Sell orde
This system never paints.   This system created by using Envolpes bands and reverse bar count.   This indicator is only working in M5 period.   This system is for long term and profitable.   Signals are shown as arrows. as an optional limit orders.   You can set a voice alarm or email notification.   You can fins our other products from link : https://www.mql5.com/en/users/drbastem/seller   Also, you can ask all your questins from email : haskayafx@gmail.com or mobile : +90 530 867 5076 or @Meh
Free informative Indicator-helper. It'll be usefull for traders who trade many symbols or using grid systems (Averaging or Martingale). Indicator counts drawdown as percent and currency separate. It has a number of settings: Count deposite drawdown according equity value and send e-mail or notifications to user if DD more than set; Sending e-mail when max open orders reached; Shows price and remaining pips amount before MarginCall on current chart and Account generally; Display summary trade lot
FREE
R Var 移動平均インジケーターは、根っからのトレンド フォロワー向けに設計されたトレンド フォロー インジケーターです。 これは、株式トレーダーや商品トレーダーの間で非常に人気のある外国為替取引指標であり、その人気は、本物のお金を稼ぐシグナルをユーザーに配信する能力に由来しています. インジケーターは、シエナ ライン上に配置された緑と赤のドットで構成されます。 緑色の点は強気のシグナルを示し、赤色の点は弱気のシグナルを示しています。 基本的な取引シグナル 買いシグナル: インディケータのシエナラインの点が緑色に変わったらロング。 売りシグナル: インジケーターのシエナ ライン上のドットが赤に変わったらショートします。 買い取引を終了する: 強気トレンドが進行している間にインジケーターのシエナ ラインに赤い点が表示された場合は、すべての買い注文を閉じます。 売りトレードを終了する: 弱気トレンドが進行中に、R Var 移動平均インジケーターのシエナ ラインに緑色の点が表示された場合は、すべての売り注文を閉じます。 チップ R Var 移動平均インジケーターを使用する
The Momentum Standard/Hidden Divergence indicator will plot the momentum, and will also identify and plot standard (regular) divergences between the indicator and the price action, OR it can be set to identify and plot hidden (reverse) divergences between the indicator and the price action. The divergences themselves are implemented as lines (default green for bullish divergence and red for bearish divergence) drawn in the indicator pane. If activated via the Inputs dialog, alerts will be genera
Market Structure Zig Zag
Lesedi Oliver Seilane
4.77 (22)
Free Market structure zig zag to assist in price action trading the screenshots describe how to use and how to spot patterns new version comes with alerts, email alert and  push notification alert can be used on all pairs  can be used on all timeframes  you can add additional confirmation indicators the indicator shows you your higher high and low highs as well as your lower lows and lower highs  the indication makes price action analysis easier to spot.
FREE
Berserk
Andrey Kolmogorov
5 (2)
There is always movement and price return in the market. Usually, the price return occurs after an abnormally large candlestick size. The main goal of the Berserker is to make money on this. In his work, Berserker uses 3 modes of opening orders: 1.   Multi - a mode in which 2 opposite orders are opened simultaneously; 2. Reverse   - a mode in which, immediately after closing an order by Stop Loss, a new order is opened in the opposite direction; 3.   Support   - Mode of operation of support orde
Be notified of every color change of Heiken Ashi (HA) candles. The indicator will trigger past and new signals every time that HA candles change their colors. Note : this tool is based on the code of Heiken Ashi indicator developed by MetaQuotes Software Corp. Features The signals are triggered at closing of last bar/opening of a new bar; Any kind of alerts can be enabled: Dialog Box, Email message, SMS notifications for smartphones and tablets, and Sound alerts; By default, up arrows are plot
ToolBox 360 is the swiss knife of all indicators. It is full packed with useful tools to help you with your trading. It can be used to find best entry and exit points and help you to decide if you should open a trade or not. It shows market trends, candlestick formations outside / inside bars and you can sett time based allerts. Main features: Time based Fibonacci lines Choose a start and end time and the indicator shows you Fibonacci lines within the selected time range including range high
This system created by using Corrected MACD,ADX, Different time zone support and resistant points,  tree Parabolic Sars,two Bollinger band, 3 moving average, stochastic oscillator and ADX. In this system, Using parabolic Sars reverse bar count,  Pips difference between closing price and last parabolic Sars in the direction of signal and Trend strength.   Note that this system is not martingale, this system is creating limit order.    Best result for the orders are 45 Pips in USD, 75 Pip
TS Prop Firm MT4
Marzena Maria Szmit
4 (4)
TS Prop Firm MT4 has been prepared for Prop Trading Firms and Forex Brokers. TS Prop Firm EA is a version that support the EURUSD, XAUUSD and US30 . There are three risk levels to choose from: Low, Medium and High. This robot is also protected during important news , when high-impact news comes out, the robot doesn't open positions for 60 minutes before and 60 minutes after the important news. TS Prop Firm is available in one version for MetaTrader 4. If you click on my profile, you can find the
このプロダクトを購入した人は以下も購入しています
まず第一に、この取引インジケーターは再描画されず、再描画されず、遅延しないことを強調する価値があります。これにより、手動取引とロボット取引の両方に理想的なものになります。 アトミックアナリストは、価格の強さとモメンタムを利用して市場でより良いエッジを見つけるためのPA価格アクションインジケーターです。ノイズや誤ったシグナルを除去し、取引ポテンシャルを高めるための高度なフィルターを備えています。複雑なインジケーターの複数のレイヤーを使用して、アトミックアナリストはチャートをスキャンし、複雑な数学的計算をシンプルなシグナルと色に変換します。これにより、どのような初心者トレーダーでも理解して使用し、一貫した取引の決定を行うことができます。 「アトミックアナリスト」は、新規および経験豊富なトレーダー向けにカスタマイズされた包括的な取引ソリューションです。プレミアムインジケーターとトップノッチの機能を1つの取引戦略に組み合わせ、すべてのタイプのトレーダーにとって汎用性のある選択肢にします。 デイリートレーディングとスキャルピング戦略:高速で正確なデイトレーディングおよび短期トレード
TPSpro TRENDPRO  - is a trend indicator that automatically analyzes the market and provides information about the trend and each of its changes, as well as giving signals for entering trades without redrawing! The indicator uses each candle, analyzing them separately. referring to different impulses - up or down impulse. Exact entry points into transactions for currencies, crypto, metals, stocks, indices!  -  Version MT5               DETAILED DESCRIPTION        /       TRADING SETUPS           
現在26%オフ 初心者やエキスパートトレーダーに最適なソリューション! このインジケーターは、独自の機能と新しい計算式を取り入れた、ユニークで高品質、かつ手頃な価格のトレーディングツールです。たった1枚のチャートで28の為替ペアの通貨強度を読み取ることができます。新しいトレンドやスキャルピングチャンスの引き金となるポイントを正確に特定することができるので、あなたのトレードがどのように改善されるか想像してみてください。 ユーザーマニュアルはこちら  https://www.mql5.com/en/blogs/post/697384 これが最初の1本、オリジナルだ! 価値のないクローンを買わないでください。 特別な サブウィンドウの矢印で強い通貨の勢いを表示 GAPがあなたのトレードを導く! 基準通貨や気配値が売られすぎ・買われすぎのゾーン(外相フィボナッチレベル)にあるとき、個別チャートのメインウィンドウに警告表示。 通貨がレンジの外側から反落した場合、プルバック/リバーサルのアラート。 クロスパターンの特別なアラート 複数の時間枠を選択可能で、トレンドを素早く
現在20%OFF! 初心者やエキスパートトレーダーのためのベストソリューション! このダッシュボードソフトウェアは、28の通貨ペアで動作しています。それは私達の主要な指標(高度な通貨の強さ28と高度な通貨インパルス)の2に基づいています。それは全体の外国為替市場の大きい概観を与えます。それは、すべての(9)時間枠で28の外国為替ペアのための高度な通貨の強さの値、通貨の動きの速度と信号を示しています。チャート上で1つのインディケータを使用して市場全体を観察し、トレンドやスキャルピングの機会をピンポイントで見つけることができたら、あなたのトレードがどのように改善されるか想像してみてください。 このインディケータには、強い通貨と弱い通貨の識別、潜在的な取引の識別と確認がより簡単になるような機能が搭載されています。このインディケータは、通貨の強さや弱さが増加しているか減少しているか、また、すべての時間枠でどのように機能しているかをグラフィカルに表示します。 新機能として、現在の市場環境の変化に適応するダイナミックなマーケットフィボナッチレベルが追加され、すでに当社のAdvan
SALE NOW! Limited Time Offer! An exclusive indicator that utilizes an innovative algorithm to swiftly and accurately determine the market trend. The indicator automatically calculates opening, closing, and profit levels, providing detailed trading statistics. With these features, you can choose the most appropriate trading instrument for the current market conditions. Additionally, you can easily integrate your own arrow indicators into Scalper Inside Pro to quickly evaluate their statistics and
A key element in trading is zones or levels from which decisions to buy or sell a trading instrument are made. Despite attempts by major players to conceal their presence in the market, they inevitably leave traces. Our task was to learn how to identify these traces and interpret them correctly. Reversal First Impulse levels (RFI)   -  Version MT5                INSTRUCTIONS                 RUS                 ENG                                       R ecommended to use with an indicator   -  
ご紹介   クォンタム トレンド スナイパー インジケーターは 、トレンド反転を特定して取引する方法を変革する画期的な MQL5 インジケーターです。 13年以上の取引経験を持つ経験豊富なトレーダーのチームによって開発されました。     クォンタムトレンドスナイパーインジケーター   は、非常に高い精度でトレンドの反転を識別する革新的な方法で、あなたのトレーディングの旅を新たな高みに押し上げるように設計されています。 ***Quantum Trend Sniper Indicatorを購入すると、Quantum Breakout Indicatorを無料で入手できます!*** クォンタム ブレイクアウト インジケーターは、トレンドの反転を特定するとアラートを発し、矢印を示し、3 つのテイクプロフィットレベルを提案します。 初心者トレーダーにもプロのトレーダーにも適しています。 量子EAチャネル:       ここをクリック MT5のバージョン:       ここをクリック 推奨事項: 期間: すべての時間枠。最良の結果を得るには、
ご紹介     Quantum Breakout PRO は 、ブレイクアウト ゾーンの取引方法を変革する画期的な MQL5 インジケーターです。 13年以上の取引経験を持つ経験豊富なトレーダーのチームによって開発された Quantum Breakout PROは 、革新的でダイナミックなブレイクアウトゾーン戦略により、あなたの取引の旅を新たな高みに押し上げるように設計されています。 クォンタム ブレイクアウト インジケーターは、5 つの利益ターゲット ゾーンを備えたブレイクアウト ゾーン上のシグナル矢印と、ブレイクアウト ボックスに基づいたストップロスの提案を提供します。 初心者トレーダーにもプロのトレーダーにも適しています。 量子EAチャネル:       ここをクリック MT5バージョン:   ここをクリック 重要!購入後、インストールマニュアルを受け取るためにプライベートメッセージを送ってください。 推奨事項: 時間枠: M15 通貨ペア: GBPJPY、EURJPY、USDJPY、NZDUSD、XAUUSD アカウントの種類: ECN、Raw、また
Advanced Supply Demand
Bernhard Schweigert
4.92 (310)
現在33%オフ 初心者にもエキスパートトレーダーにも最適なソリューション このインジケーターは独自の機能と新しい公式を多数内蔵しており、ユニークで高品質かつ手頃な取引ツールです。このアップデートでは、2つの時間枠ゾーンを表示できるようになります。より長いTFだけでなく、チャートTFとより長いTF(ネストゾーンを表示)の両方を表示できます。すべてのSupply Demandトレーダーの皆さんのお気に召すはずです。:) 重要情報の公開 Advanced Supply Demandの可能性を最大化するには、 https://www.mql5.com/ja/blogs/post/720245 にアクセスしてください。   エントリーまたはターゲットの正確なトリガーポイントを正確に特定できれば取引がどのように改善されるか想像してみてください。新しい基盤となるアルゴリズムに基づいて構築されているため、買い手と売り手の間の潜在的な不均衡をさらに簡単に特定できます。これは、最も強い需要と供給のゾーンと、過去のパフォーマンス(古いゾーンを表示)がグラフィカルに表現されるためです。これらの機能は、最適
驚異的なFXインジケーター「Miraculous」をご紹介します。完璧な結果を得るための1時間足を含むすべてのタイムフレームで効果的に機能する、最強の強力な特殊MT4フォレックスインジケーターです。 すべてのタイムフレームで優れた結果を提供する最高のFXインジケーターを探し続けるのに疲れましたか?これ以上探す必要はありません!「Miraculous」フォレックスインジケーターをご紹介します。このインジケーターは、トレーディングの経験を変革し、収益を新たなレベルに引き上げるために設計されました。 先進のテクノロジーと長年にわたる緻密な開発に基づいて構築された「Miraculous」フォレックスインジケーターは、FX市場における力と正確さの頂点となります。この素晴らしいツールは、すべてのレベルのトレーダーのニーズを満たすように設計されており、一貫した収益性を追求する上で比類のない優位性を提供します。 「Miraculous」フォレックスインジケーターの他との違いは、その非常に適応性にあります。デイトレーダー、スウィングトレーダーであろうと、長期ポジションを好む方であろうと、このインジケータ
これはMT4のインジケーターで、再描画なしで取引に参入するための正確なシグナルを提供します。 外国為替、暗号通貨、金属、株式、インデックスなど、あらゆる金融資産に適用できます。かなり正確な見積もりを提供し、取引を開始して終了するのに最適な時期を教えてくれます。1つのシグナルを処理しただけでインジケーターの元が取れた例の 動画 (6:22)をご覧ください。Entry PointsPro インジケーターの助けを借りたほとんどのトレーダーの最初の1週間の結果が改善しています。 Telegramグループ に登録してください。Entry Points Proインジケーターのメリットは次の通りです。 再描画のないエントリーシグナル 再描画されるインジケーターでは一度表示されたシグナルが削除されて大きな金銭的損失につながることがありますが、これと異なり、表示されて確認されたシグナルは消えることがありません。 エラーなしの取引開始 インジケーターアルゴリズムによって取引を開始する(資産を売買する)理想的な瞬間を見つけることができます。それを使用するすべてのトレーダーの成功率が向上します。
TrendMaestro
Stefano Frisetti
5 (2)
note: this indicator is for METATRADER4, if you want the version for METATRADER5 this is the link: TRENDMAESTRO recognizes a new TREND in the bud, he never makes mistakes. The certainty of identifying a new TREND is priceless. DESCRIPTION TRENDMAESTRO identifies a new TREND in the bud, this indicator examines the volatility, volumes and momentum to identify the moment in which there is an explosion of one or more of these data and therefore the moment in which prices have strong probability of f
FX Volume
Daniel Stein
4.6 (35)
mql5と Telegramの モーニング・ブリーフィングで、詳細とスクリーンショットを含む毎日のマーケット・アップデートをご覧 ください! FX Volumeは、ブローカーの視点から市場のセンチメントをリアルに洞察する、最初で唯一の出来高インジケーターです。 ブローカーのような機関投資家が外国為替市場でどのようなポジションをとっているか、COTレポートよりもはるかに速く、素晴らしい洞察を提供します。 この情報をチャート上で直接見ることは、あなたの取引にとって真のゲームチェンジャーであり、画期的なソリューションです。 以下のようなユニークなマーケットデータ洞察から利益を得てください。 比率は 、通貨のロングポジションとショートポジションの比率をパーセントで表示します。 比率の変化は 、選択した期間内のロング比率とその変化率を表示します。 Volumes Totalは 、通貨の取引量(ロングとショート)の合計をロット単位で表示します。 Volumes Long :全通貨のロングポジションの取引量を表示します。 Volumes(ショート )は、全通貨のショートポジションの取引量を表示
Price Action Entry Alerts
Stephen Sanjeeve Sahayam
5 (3)
このインジケーターは、売買圧力についてすべてのバーをスクリーニングし、最大量の 4 種類のローソク足パターンを特定します。次に、これらのローソク足はいくつかの線形フィルターを使用してフィルター処理され、買いまたは売りのシグナルが表示されます。シグナルは、より高い時間枠の方向と組み合わせて、取引量が多い時間帯に取引される場合に最も効果的に機能します。すべてのフィルターはカスタマイズ可能で、独立して動作します。ボタンをクリックするだけで単一方向の信号を表示できます。 このインジケーターには、意思決定プロセスに役立つ最も重要な価格アクションとスマート マネーの概念も組み込まれています。 シグナルとトレードに関する教育をすべて 1 つのツールにまとめました。 特徴: 信号は再描画されません。 飲み込むキャンドル、拒否キャンドル、拡張範囲キャンドル、ピンバーを識別します。 有効なシグナルごとに複数のエントリー、ストップロス、複数のテイクプロフィットレベルを表示します。 大容量セッションでフィルタリングします。 サポート/レジスタンスレベルとローソク足の構造でフィルターします。 MACD ヒ
How to use Pair Trading Station Pair Trading Station is recommended for H1 time frame and you can use it for any currency pairs. To generate buy and sell signal, follow few steps below to apply Pair Trading Station to your MetaTrader terminal. When you load Pair Trading Station on your chart, Pair Trading station will assess available historical data in your MetaTrader platforms for each currency pair. On your chart, the amount of historical data available will be displayed for each currency pai
mql5と Telegramの モーニング・ブリーフィングで、詳細とスクリーンショットを含む毎日のマーケット・アップデートをご覧 ください! FX Power MT4 NGは 、長年の人気を誇る通貨強度計FX Powerの次世代モデルです。 この次世代ストレングスメーターは何を提供するのでしょうか?初代FXパワーの魅力すべて プラス GOLD/XAUの強さ分析 より正確な計算結果 個別に設定可能な分析期間 カスタマイズ可能な計算上限値により、さらに優れたパフォーマンスを実現 もっと見たい人のための特別なマルチインスタンス設定 すべてのチャートでお好みの色を無限に設定可能 数え切れないほどの通知オプションにより、重要なことを見逃すことはありません。 Windows 11とmacOSのスタイルで角を丸くした新しいデザイン 魔法のように動くインジケーターパネル FXパワーの主な機能 すべての主要通貨の強さの完全な履歴 すべての時間枠における通貨の強さの履歴 すべてのブローカーとチャートで同一の計算結果 100%信頼できるリアルタイム計算 -> リペイントなし ドロップダウン・リストから
Cycle Sniper
Elmira Memish
4.4 (35)
NEW YEAR SALE PRICE FOR LIMITED TIME!!! Please contact us after your purchase and we will send you the complimentary indicators to complete the system Cycle Sniper is not a holy grail but when you use it in a system which is explained in the videos, you will feel the difference. If you are not willing to focus on the charts designed with Cycle Sniper and other free tools we provide, we recommend not buying this indicator. We recommend watching the videos about the indiactor and system before pu
プレシジョン・インデックス・オシレーター(Pi-Osc)は、Precision Trading SystemsのRoger Medcalfによるものです。 バージョン2は、チャートにスーパーファストでロードされるように注意深く再コードされ、その他の技術的な改良も組み込まれて、エクスペリエンスを向上させています。 Pi-Oscは、市場が強制的に行かなければならない、すべての人のストップを取り除くためのポイントである、極限のエクソースト・ポイントを見つけるために設計された正確な取引タイミング信号を提供するために作成されました。 この製品は、極限のポイントがどこにあるかを知るという古代の問題を解決し、トレーダーの生活をはるかにシンプルにします。 これは、業界標準のオシレーターとは異なる強力な要素を持つ高度なコンセンサス・インジケーターです。 使用されている一部の機能には、需要指数、マネーフロー、RSI、スティリング、パターン認識、出来高分析、標準偏差の極値などがあり、異なる長さでこれらのバリエーションが多く含まれています。 初めて見ると、訓練されていない目には、他の
TakePropips Donchian Trend Pro
Eric John Pajarillaga Aldana
4.82 (17)
TakePropips Donchian Trend Pro   (MT4) は、ドンチャン チャネルを使用してトレンドの方向を自動的に検出し、エントリーとエグジットの取引シグナルを提供する強力で効果的なツールです! この多機能インジケーターには、トレンド スキャナー、取引シグナル、統計パネル、スクリーナー、取引セッション、およびアラート履歴ダッシュボードが含まれます。取引シグナルを提供し、チャートを分析する時間を節約するように設計されています! ユーザー マニュアルとインストール ガイドは、ブログ投稿 (   https://www.mql5.com/en/blogs/post/751368   ) からダウンロードできます。 今日は 50% オフ! 98ドルから49ドルに値下げ! このインジケーターは、ストラテジー テスターでテストできます (ビジュアル モードを有効にします)。ライブ チャートでテストしたい場合は、7 日間の試用版を入手するようにメッセージを送ることもできます。 詳細については、説明の下にあるビデオ チュートリアルも利用できます。 ご不明な点やサポートが必
このインディケータは、当社の2つの製品 Advanced Currency IMPULSE with ALERT  +   Currency Strength Exotics . のスーパーコンビネーションです。 このインジケーターは全ての時間枠で作動し、8つの主要通貨と1つのシンボルの強弱のインパルスをグラフで表示します。 このインジケータは、金、エキゾチックペア、商品、インデックス、先物など、あらゆるシンボルの通貨強度の加速度を表示することに特化されています。金、銀、原油、DAX、US30、MXN、TRY、CNHなどの通貨強度の加速度(インパルスまたは速度)を表示するために、任意のシンボルを9行目に追加できる、この種の最初のものです。 新しいアルゴリズムに基づいて構築され、潜在的な取引の特定と確認がさらに容易になりました。これは、通貨の強さや弱さが加速しているかどうかをグラフィカルに表示し、その加速の速度を測定するためです。加速すると物事は明らかに速く進みますが、これはFX市場でも同じです。つまり、反対方向に加速している通貨をペアリングすれば、潜在的に利益を生む取
PTS - Precision Trading Systemsによるダイバージェンスバイファインダー Precision Divergence Finderは、市場の底を非常に正確に見つけることを目的としており、頻繁に成功しています。 テクニカル分析において、底を選ぶ技術は通常、トップを選ぶよりもはるかに簡単です。このアイテムは、まさにこのタスクのために設計されました。ブルシューダイバージェンスが識別された後、買い物をする前にトレンドが上向きに転換するのを待つのが賢明です。10本または20本のバーの高値を入力するか、移動平均15-30を上昇中に使用してトレンドの変化を特定できます。 この複雑なアルゴリズムは、リアルタイムのバーバーベースでアクティブなデマンドインデックスのダイバージェンスの数を検出し、カウントします。 モデルは、市場価格が新しい安値を付けており、デマンドインデックスが新しい安値を付けていないときに、ダイバージェンスが発生していると観察します。 このインジケーターは、2つの設定を使用します。 1. デマンドインデックス(DI)の長さは、インジケー
Roger MedcalfによるPTS Divergence Finder Sell Indicator - Precision Trading Systems。 このインジケーターは売りの指示のみを提供します。 まず第一に、なぜ私が多くの年にわたり購買シグナルのダイバージェンスファインダーを提供する一方で、売買ダイバージェンスのインジケーターを提供しなかったのか、何度も質問されました。 私は売買ダイバージェンスが買いダイバージェンスよりも信頼性が低いという答えをしましたが、それは今も真実です。 この問題を解決するいくつかの方法が見つかりましたが、これはピアプレッシャーに屈せず、または私が15年以上前に作成したこのインジケーターの修正によるものではなく、デフォルト設定をより厳格に変更することで実現しました。 PTS Divergence Finder Sell Indicatorはどのように動作しますか? PTS Divergence Finder Sell Indicatorは、トレードボリュームに基づくDemand Indexで発生したダイバージェンスの数を正確に測定します。MT4
TPA True Price Action indicator reveals the true price action of the market makers through 100% non-repainting signals (except early signals mode) strictly at the close of a candle! TPA shows entries and re-entries, every time the bulls are definitely stronger than the bears and vice versa. Not to confuse with red/green candles. The shift of power gets confirmed at the earliest stage and is ONE exit strategy of several. There are available now two free parts of the TPA User Guide for our custo
Indicator : RealValueIndicator Description : RealValueIndicator is a powerful tool designed specifically for trading on the EURUSD pair. This indicator analyzes all EUR and USD pairs, calculates their real currency strength values, and displays them as a single realistic value to give you a head start on price. This indicator will tell you moves before they happen if you use it right. RealValueIndicator allows you to get a quick and accurate overview of the EURUSD currency pair tops and bottoms,
Reversal Sniper is designed to find the extreme reversals of the price. Indicator collects data of Cycle Sniper Indicator. NOTE: REVERSAL SNIPER Indicator is made for Cycle Sniper Users as an additional tool.  However, it can be used by the traders who look for finding out strong reversal levels. Indicator works on all timeframes and all instruments. Reversal  Sniper  Checks: Harmonic Patterns RSI Zig Zag and Harmonic Swings Cycle Sniper Indicator's Buy / Sell Signals The complex algo i
Step into the realm of Forex trading with confidence and precision using XQ, a cutting-edge Forex indicator designed to elevate your trading game to unprecedented heights. Whether you're a seasoned trader or just stepping into the world of currency exchange,   XQ Forex Indicator   empowers you with the insights and signals needed to make informed trading decisions. The signal conditions are a combination of three indicators, and XQ Forex Indicator only display  medium and long-term trends . The
XPointer is a completely ready trading system. It shows the trader when to open and close a trade. It works on all currency pairs and all time frames. Very easy to use and does not require additional indicators for its operation. Even a beginner trader can start working with XPointer. But it will also be useful for professional traders to confirm the opening of orders. Features of the XPointer indicator It does not redraw its values. It works on all currency pairs and all time frames. It has a
ON Trade Waves Patterns Harmonic Elliot Wolfeをご紹介します。これは手動および自動の方法を使用して市場のさまざまなパターンを検出するために設計された高度なインジケーターです。以下はその動作方法です: ハーモニックパターン: このインジケーターは、チャートに表示されるハーモニックパターンを識別できます。これらのパターンは、Scott Carneyの「Harmonic Trading vol 1および2」で説明されているように、ハーモニックトレーディング理論を実践するトレーダーにとって重要です。手動で描画するか、自動検出に頼るかにかかわらず、ON Trade Waves Patternsがお手伝いします。 コントロールパネル: このインジケーターはユーザーフレンドリーなコントロールパネルを備えています。チャートと時間枠の設定を保存し、異なる構成間をスムーズに切り替えることができます。チャートスペースを最大限に活用するために最小化することもできます。他の分析ツールで作業することを好む場合、閉じるボタンをクリックするだけで、すべてのインジケーターデ
NO REPAINT ADVANCED CHART PATTERN INDICATOR By definition, a price ( chart)  pattern is a recognizable configuration of price movement that is identified using a series of  trendlines  and/or curves. When a price pattern signals a change in trend direction, it is known as a reversal pattern; a continuation pattern occurs when the trend continues in its existing direction following a brief pause. Advanced Chart Pattern Tracker is designed to find the MOST ACCURATE patterns. A special script is
現在20%OFF! 初心者やエキスパートトレーダーに最適なソリューションです。 このインディケータは、エキゾチックペア・コモディティ・インデックス・先物など、あらゆるシンボルの通貨の強さを表示することに特化したインディケータです。金、銀、原油、DAX、US30、MXN、TRY、CNHなどの通貨の強さを表示するために、9行目にどのシンボルでも追加することができます。独自の機能を多数搭載し、新しい計算式を採用したため、ユニークで高品質、かつ手頃な価格のトレーディングツールとなっています。新しいトレンドやスキャルピングチャンスのトリガーポイントを正確に把握することができるため、あなたのトレードがどのように改善されるか想像してみてください。 ユーザーマニュアル:ここをクリック   https://www.mql5.com/en/blogs/post/708876 すべての時間枠に対応します。あなたはすぐにトレンドを見ることができるようになります! 新しいアルゴリズムに基づいて設計されているため、潜在的な取引の特定と確認がより簡単になります。これは、8つの主要通貨と1つのシンボ
作者のその他のプロダクト
Description of the Doctor Winston bot General characteristics: Name: Doctor Winston Type: Ultramodern Forex trading bot Instruments: Trades on most currency pairs and instruments Timeframe: Can be set to any timeframe Bot settings: Money Management (Capital Management): MMOn: Enabling/disabling capital management (true/false) DefaultVolume: Default transaction volume (0.01) MMCalc: Base amount for capital management (1000) Indicators: ALength, BLength, CLength, DLength, ELength: Parameters
Gyroscope        professional forex expert   (for EURUSD, GBPUSD, USDJPY, AUDUSD, USDCHF, EURGBP, EURJPY, NZDUSD, USDCAD, EURCHF, AUDJPY, CADJPY pairs)   alyzing the market using the Elliot Wave Index. Elliott wave theory is the interpretation of processes in financial markets through a system of visual models (waves) on price charts. The author of the theory, Ralph Elliott, identified eight variants of alternating waves (of which five are in the trend and three are against the trend). The mo
The   Milioron   robot, developed for the Forex market, has significant flexibility and offers many mechanisms for maintaining a series of orders. It allows traders to automate and optimize their trading using built-in strategies and risk management approaches. Some of the main features and capabilities of the Milioron robot include: 1. **Flexibility of settings**: The robot provides traders with a wide range of parameters and settings that can be adapted to specific trading strategies and
I suggest that everyone who is interested in the Smoking indicator try to trade. Smoking is a technical analysis tool that uses mathematical calculations to determine various aspects of price movement and is based on historical data. Smoking reveals special aspects of price movement and allows traders to make the right decision. All trading indicators analyze the price from different angles based on historical data. Therefore, it is not entirely correct to say that they can predict the future
The Fracture indicator uses many moving averages that are with a given Length step. As a result of the work, the resulting lines are formed, which are displayed on the price chart as blue and red lines. The simplest use case for the indicator is to open a trade in the direction of an existing trend. The best result is obtained by combining the indicator with fundamental news; it can act as a news filter, that is, show how the market reacts to this or that news. The indicator lines can also be in
Looking for a quality pivot point indicator? So Prosecution is what you need! To identify pivot points, the Prosecution indicator analyzes many conditions, as the aggregate analysis provides a more accurate picture of the market situation. What are pivot points? Pivot point analysis is often used in conjunction with the calculation of support and resistance levels, as is the case with trend line analysis. When analyzing pivot points, the first support and resistance levels are calculated usin
The Before indicator predicts the most likely short-term price movement based on complex mathematical calculations. Most of the standard indicators commonly used in trading strategies are based on fairly simple calculations. This does not mean that there were no outstanding mathematicians in the world at the time of their creation. It is just that computers did not yet exist in those days, or their power was not enough for the sequential implementation of complex mathematical operations. Nowa
AnalizatorMTF is an oscillator indicator, a more progressive version of the indicator, with easy customization and ease of use. The following levels are used to identify signals: 0; 0.75 / -0.75; 0.9 / -0.9, as well as the configuration of the indicator curve itself. The difference from other similar indicators is in the pointers of entry points in the form of arrows of the corresponding direction and color and the possibility of displaying higher timeframes on lower ones. The indicator can b
AnalizatorSSRC is an oscillator indicator that is easy to set up and easy to use. The following levels are used to identify signals: 0; 0.75 / -0.75; 0.9 / -0.9, as well as the configuration of the indicator curve itself. Its main difference is the absence of a signal line and signals associated with its intersections. The indicator can be used as part of various strategies. Like other oscillators, it shows trend and flat zones, as well as oversold and overbought areas.
The correlation coefficient reflects the relationship between two values. It shows the dependence of changes in one value on changes in another. For example, from changes in the price of EURUSD and EURNZD. The correlation coefficient in trade, currency relations is constantly changing. Special indicators of correlation help to define it, trace changes, draw correct conclusions. One of them is the Hubbles Correlator indicator. The indicator allows you to simultaneously display several other char
Trend Indicator, a revolutionary trend trading and filtering solution with all the important trend tool features built into one tool! The Step Success indicator is good for any trader, suitable for any trader for both forex and binary options. You do not need to set up anything, everything is perfected with time and experience, it works great during a flat and a trend.
The Analytical cover trend indicator is a revolutionary trend trading and filtering solution with all the important features of a trend tool built into one tool! The Analytical cover indicator is good for any trader, suitable for any trader for both forex and binary options. You don’t need to configure anything, everything is perfected by time and experience, it works great during a flat and in a trend. The Analytical cover trend indicator is a tool for technical analysis of financial markets
What are "pivot points"? Pivot point analysis is often used in conjunction with the calculation of support and resistance levels, as is the case with trend line analysis. Pivot point analysis calculates the first support and resistance levels using the trading range width between the pivot point and the previous day's high or low price. The second support and resistance levels are calculated using the entire width between the previous day's high and low prices. Looking for a quality pivot poi
The Trend Live indicator is a development for trend trading. Trend indicators make it possible to classify the direction of price movement by determining its strength. Solving this problem helps investors enter the market on time and get a good return. The Trend Live indicator helps to analyze the market on the selected time interval. They define the mainstream. Easy to set up and works on all pairs and all time frames. Trend Live is a trend trading and filtering solution with all the important
With the help of the Impulses Enter forex indicator algorithm, you can quickly understand what kind of trend is currently developing in the market. The Elephant indicator accompanies long trends, can be used without restrictions on instruments or timeframes. With this indicator, you can try to predict future values. But the main use of the indicator is to generate buy and sell signals. The indicator tracks the market trend, ignoring sharp market fluctuations and noises around the average price.
Using the Trend alternate indicator algorithm, you can quickly understand what kind of trend is currently developing on the market. The Trend Alternate Indicator accompanies lengths, can be used without instruments or timframes. With this indicator, you can try to predict future values. But the main application of the indicator is to generate signals for the purchase and sale. The indicator monitors the market trend with ignoring the sharp fluctuations in the market and the noise around the aver
B ot Speed Forex trading advisor is an automatic scalping system that opens and closes deals using a special tick analysis algorithm programmed in code without human intervention. The main task of the ego is to instantly make a deal where a person loses time for analysis and decision making. They also automate trading, removing the emotional burden from a person and allowing you to save time. Scalping is one of the varieties of short-term strategies, moreover, the shortest of them. Using this t
Using the Arrow Effect forex indicator algorithm, you can quickly understand what kind of trend is currently developing in the market. The Elephant indicator accompanies long trends, can be used without restrictions on instruments or timeframes. With this indicator, you can try to predict future values. But the main use of the indicator is to generate buy and sell signals. The indicator tracks the market trend, ignoring sharp market fluctuations and noises around the average price. The indicator
The Riko Trend indicator is a revolutionary trend trading and filtering solution with all the important features of a trend tool built into one tool! The Riko Trend indicator is good for any trader, suitable for any trader for both forex and binary options. You don’t need to configure anything, everything is perfected by time and experience, it works great during a flat and in a trend. The Riko Trend indicator is a technical analysis tool for financial markets that reflects the current price
With the help of the Fine Market Forex indicator algorithm, you can quickly understand what kind of trend is currently developing in the market. Fine Market is a combined indicator based on several instruments. Fine Market is based on classic basic technical indicators - MA, RSI, MACD, Bollinger Bands, Stochastic. A trader does not need to impose several lines on Forex charts and set up each indicator separately. Fine Market is already successfully combined and has simplified settings, convenie
It is no secret that the movements of currency pairs for a certain part of the time occur in a certain price corridor, which is called a channel. The lower limit is considered the level of support, the upper one - resistance. Do not confuse with horizontal support and resistance levels! The distance between the support and resistance levels of a channel is called the range or channel width. The key difference between the Channel Mirosh indicator and other channel indicators (for example, from th
Профессиональный эксперт форекс   Associate Manager   (для пар EURUSD, GBPUSD, USDJPY, AUDUSD, USDCHF) ализирующий рынок при помощи индекса волн эллиота. Волновая теория Эллиотта — интерпретация процессов на финансовых рынках через систему визуальных моделей (волн) на ценовых графиках.  Автор теории Ральф Эллиотт выделил восемь вариантов чередующихся волн (из них пять по тренду и три против тренда). Движение цен на рынках принимает форму пяти волн. Три из них (1, 3, 5) вызывают направленное д
With the help of this Practica Trend forex indicator algorithm, you can quickly understand what kind of trend is currently developing in the market. The Practical Trend indicator accompanies long trends, can be used without restrictions on instruments or timeframes. With this indicator, you can try to predict future values. But the main use of the indicator is to generate buy and sell signals. The Practical Trend indicator is used in the forex markets. One of the main definitions for monitori
Trend analysis is perhaps the most important area of technical analysis and is the key to determining the overall direction of an instrument's movement. The Quest Trend indicator determines the prevailing trend. They help analyze the market on a selected time interval. Trends are based on the principle of higher highs, higher lows (for an uptrend) and lower highs, lower lows (for a downtrend). They can have different time periods and they can be related to each other like fractals. For example,
Forex trading advisor     Arog     is an automatic scalping system that opens and closes transactions using a special tick analysis algorithm programmed in code without human intervention. The main task is to instantly make a deal where a person wastes time on analysis and decision-making. Scalp trading or scalping is a short-term trading strategy that a trader uses to frequently make small profits from small price changes that add up to a large amount over time. This strategy is very popular i
Gyroscope        professional forex expert   (for EURUSD, GBPUSD, USDJPY, AUDUSD, USDCHF, EURGBP, EURJPY, NZDUSD, USDCAD, EURCHF, AUDJPY, CADJPY pairs)   alyzing the market using the Elliot Wave Index. Elliott wave theory is the interpretation of processes in financial markets through a system of visual models (waves) on price charts. The author of the theory, Ralph Elliott, identified eight variants of alternating waves (of which five are in the trend and three are against the trend). The mo
Using the Neo Forex indicator algorithm, you can quickly understand what trend is currently developing in the market. The NeoX indicator accompanies long trends and can be used without restrictions on instruments or timeframes. Using this indicator you can try to predict future values. But the main use of the indicator is to generate buy and sell signals. The indicator tracks the market trend, ignoring sharp market fluctuations and noise around the average price. The indicator implements a type
Description of the Doctor Winston bot General characteristics: Name: Doctor Winston Type: Ultramodern Forex trading bot Instruments: Trades on most currency pairs and instruments Timeframe: Can be set to any timeframe Bot settings: Money Management (Capital Management): MMOn: Enabling/disabling capital management (true/false) DefaultVolume: Default transaction volume (0.01) MMCalc: Base amount for capital management (1000) Indicators: ALength, BLength, CLength, DLength, ELength: Parameters
Barry Hood's leading trend indicator is designed to more accurately determine the direction of the trend in financial markets. Here are the main characteristics and operating principles of this indicator: Adaptive Four-Level Smoothing: The indicator uses a mechanism that allows it to effectively adapt to changing market conditions. This allows you to more accurately determine the current trend. Characteristics and features: Redraws only on the zero candle: This means that the indicator is r
" Billi " is an advanced trading bot designed for modern traders in the Forex market. This innovative tool serves as a reliable assistant for anyone aiming for efficient and automated trading. Key Features of " Billi ": Reliability and Stability: " Billi " is developed using cutting-edge technologies to ensure its reliability and stability in the market. Smart Risk Management: With built-in Money Management, " Billi " allows controlling the risk level and optimizing trading strategies. Real-T
フィルタ:
レビューなし
レビューに返信