Consolidation detect ICT
- インディケータ
- バージョン: 1.2
- アップデート済み: 30 11月 2023
- アクティベーション: 5

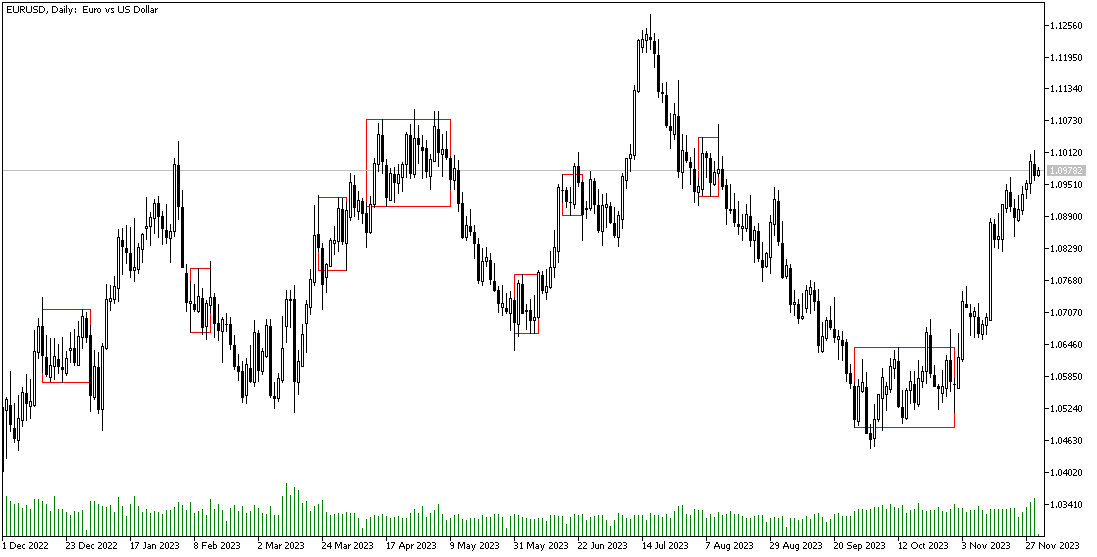
Consolidation is when price is moving inside a clear trading range.
When prices are consolidated it shows the market maker placing orders on both sides of the market. This is mainly due to manipulate the un informed money.
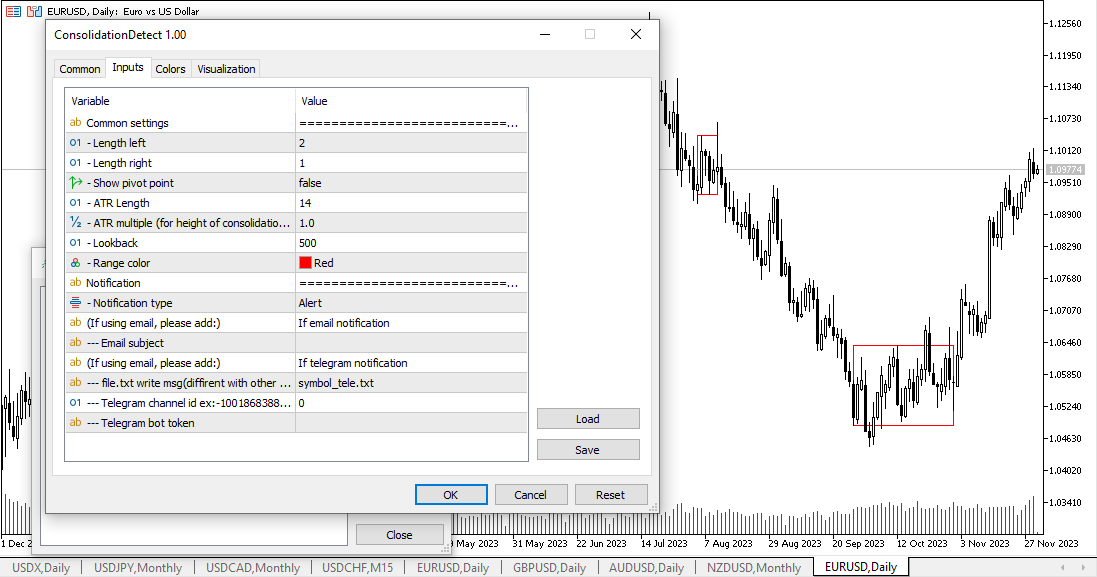
This indicator automatically identifies consolidation zones and plots them on the chart. The method of determining consolidation zones is based on pivot points and ATR, ensuring precise identification. The indicator also sends alert notifications to users when a new consolidation zone is formed or when it ends.
The identification of consolidation zones plays a crucial role in ICT's strategies. For example, in the 2022 entry.