PP Super Trend MT4
- インディケータ
- バージョン: 1.0
- アクティベーション: 5

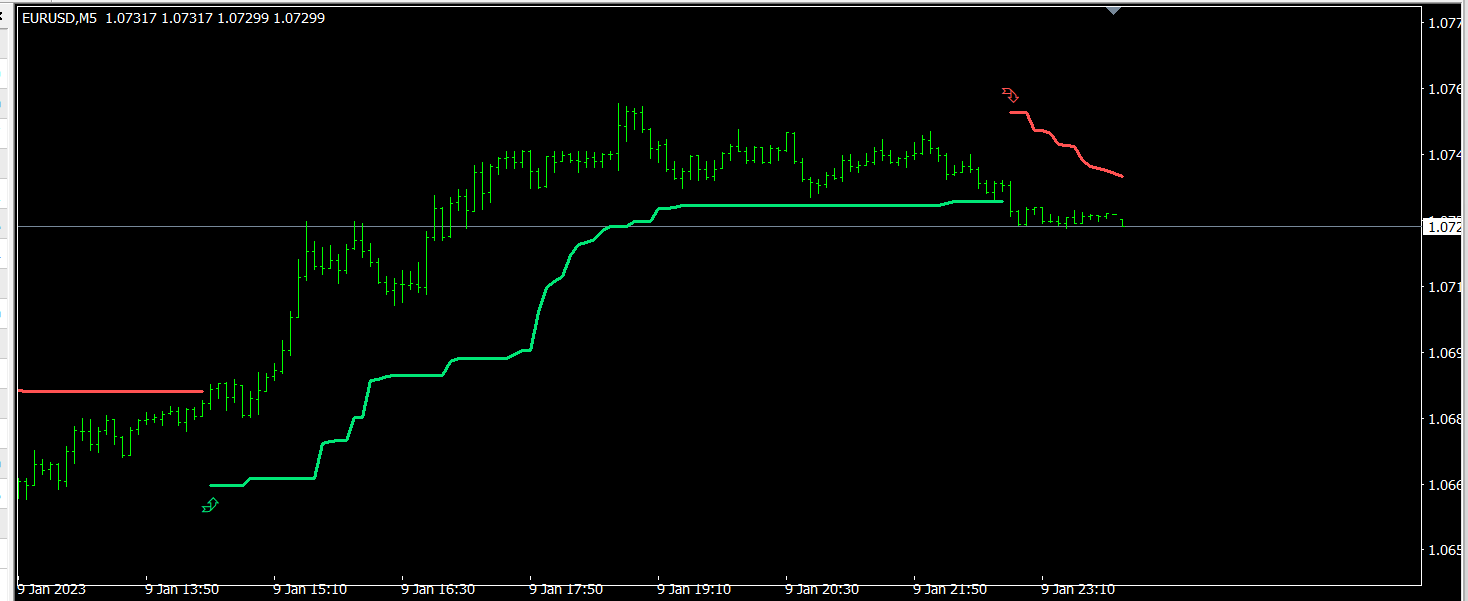
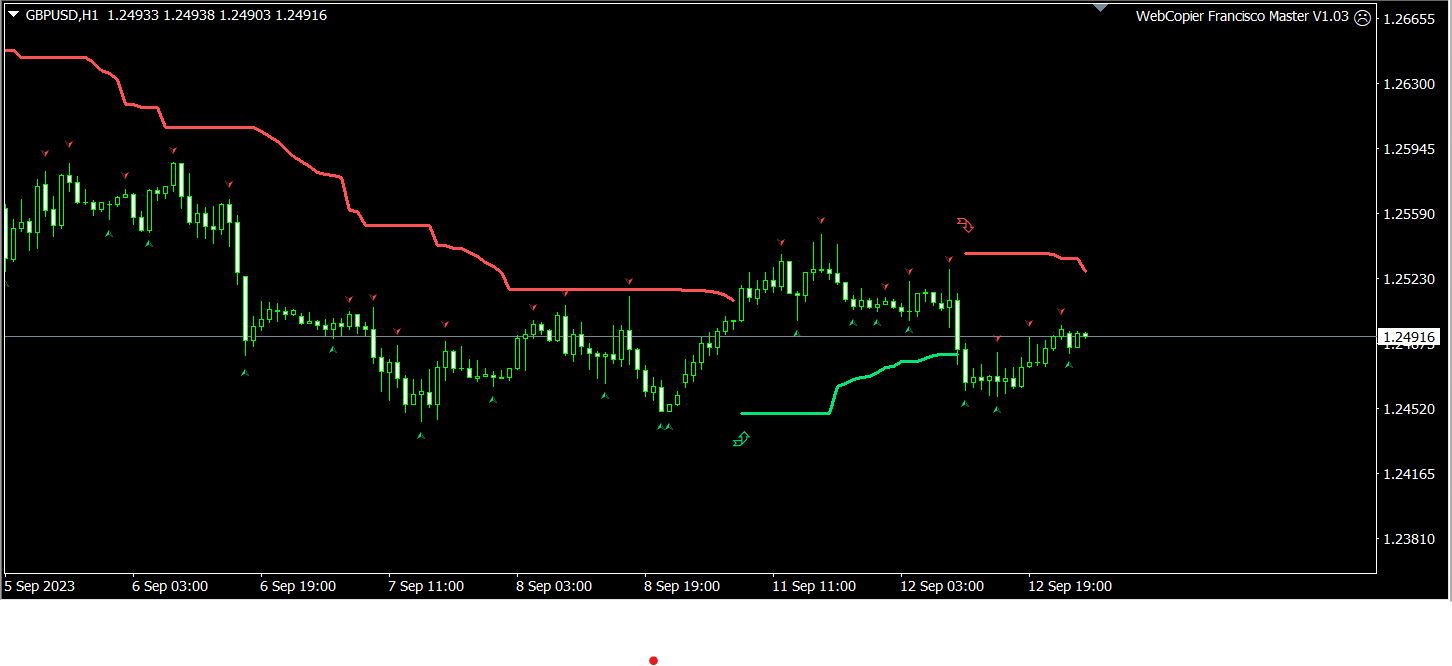
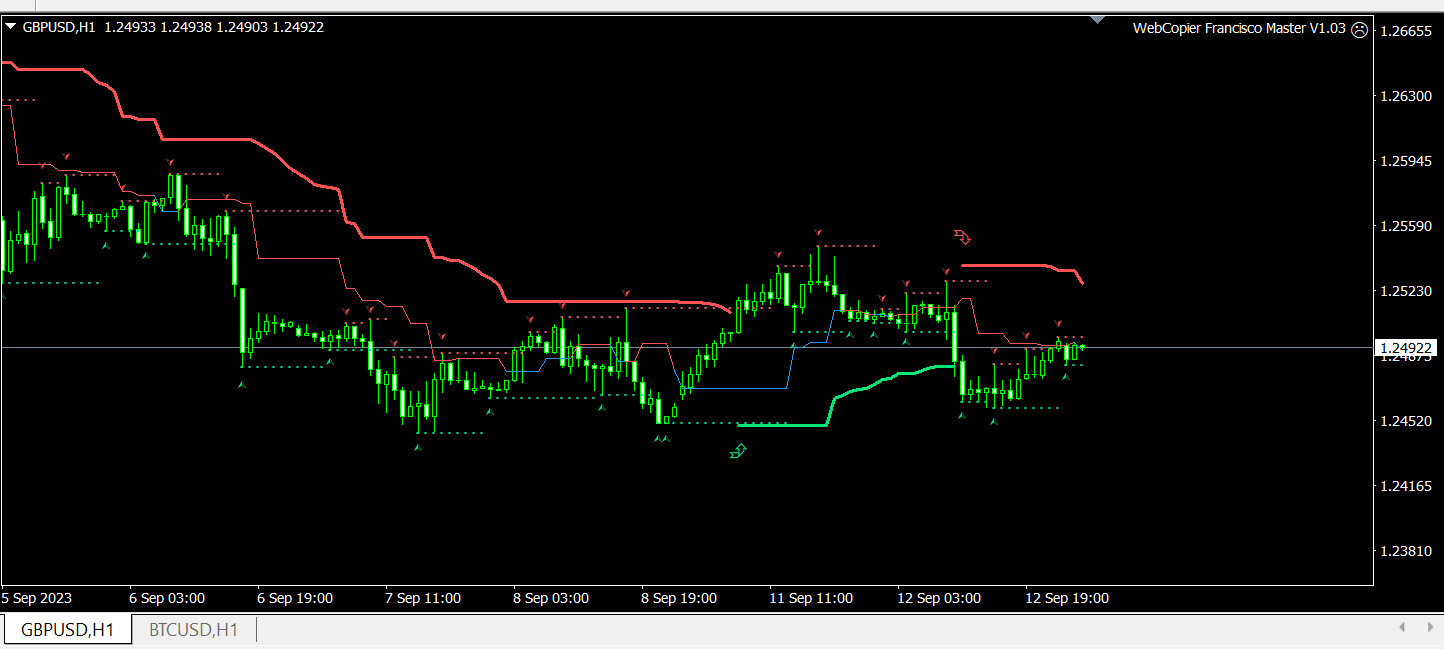
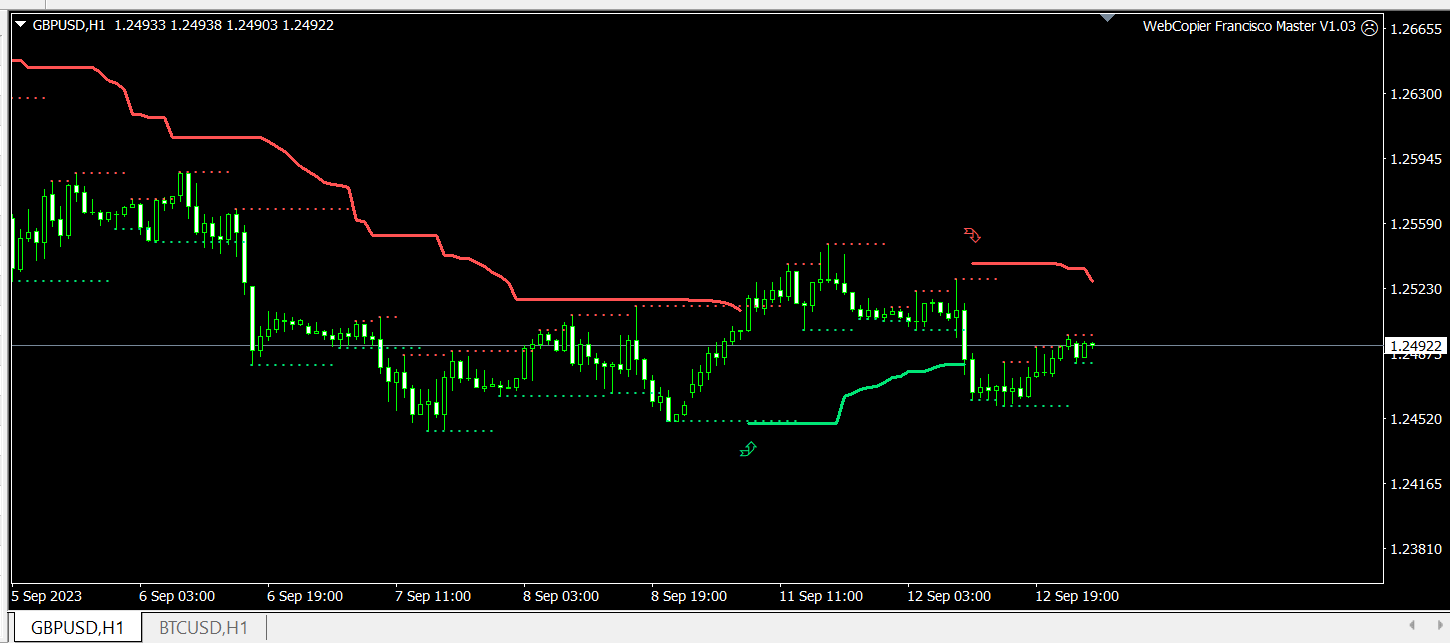
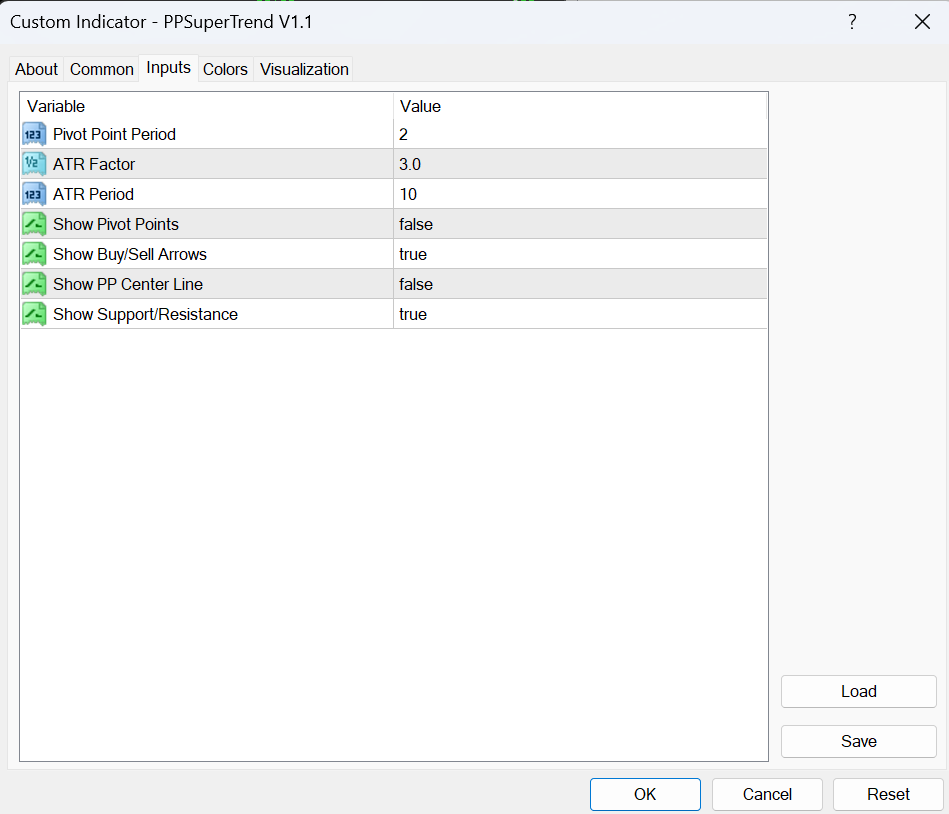
Pivot Point Super Trend is another type of famous super trend indicator which is equipped with pivot points in different way.
this indicator used to be available in the Trading view and this is converted from there to the MT4 language.
MT5 version of the indicator is also available and you can find in my products.
there are also buy/sell signals shown on the screen.