QQE MOD of Trading View 5
- インディケータ
- バージョン: 1.0
- アクティベーション: 5

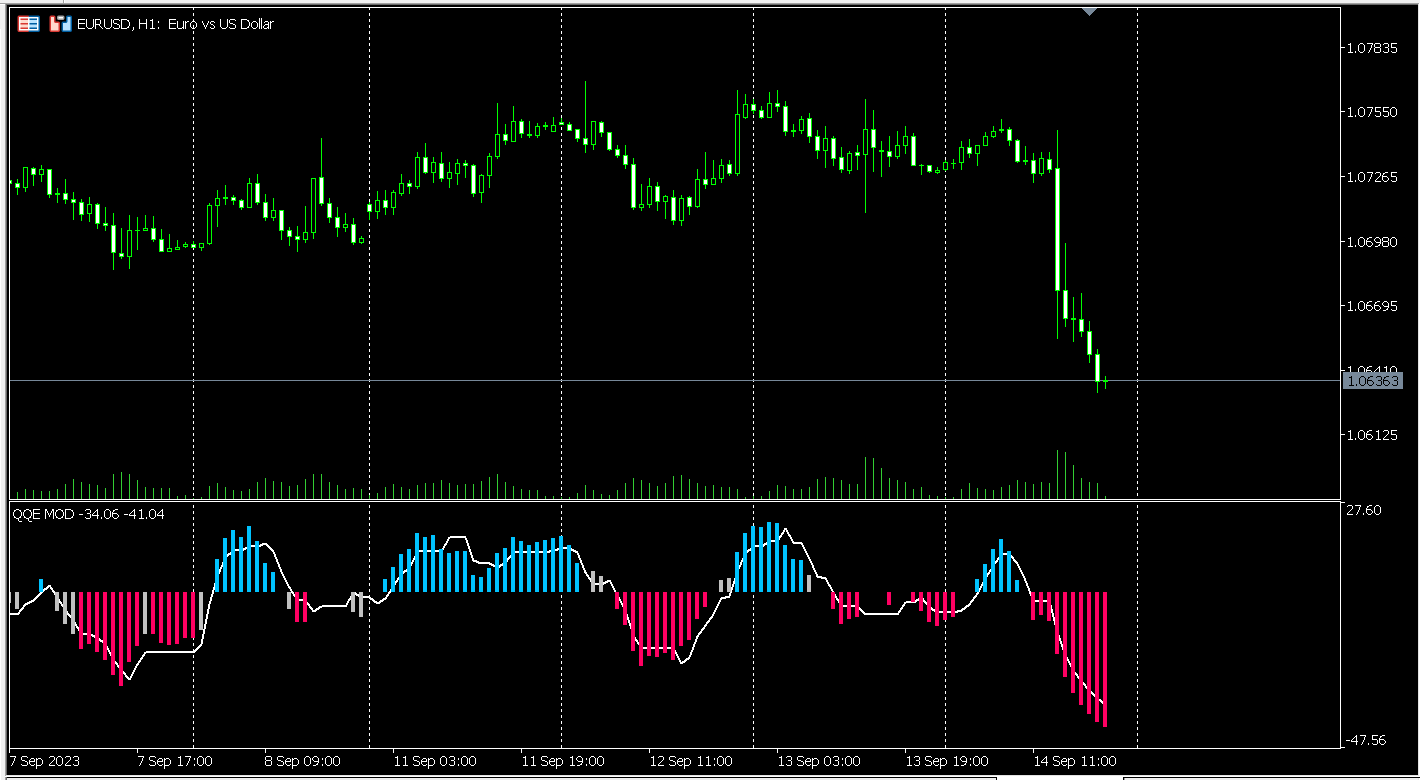
The QQE indicator is a momentum-based indicator used to identify trends and sideways. The Qualitative Quantitative Estimate (QQE) indicator works like a smoothed version of the popular Relative Strength Index (RSI) indicator. QQE extends the RSI by adding two volatility-based trailing stops.
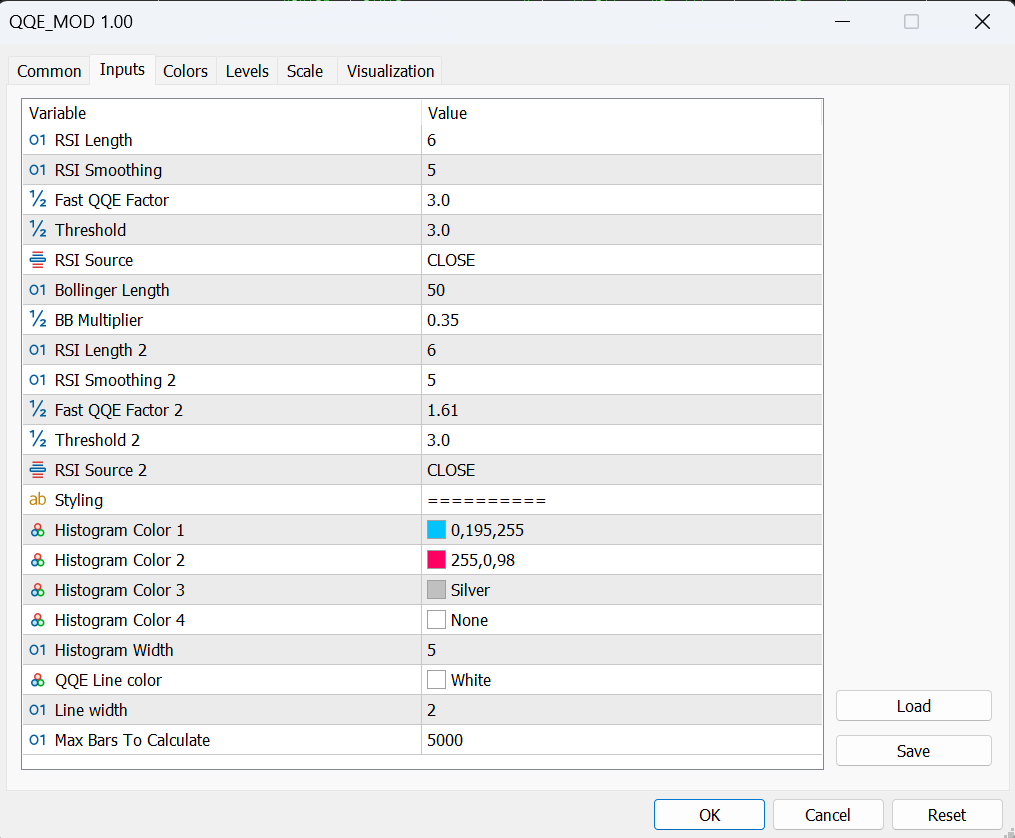
This indicator is converted Qfrom Trading View QQE MOD by Mihkel00 to be used in MT5 Version.