AskSpread line

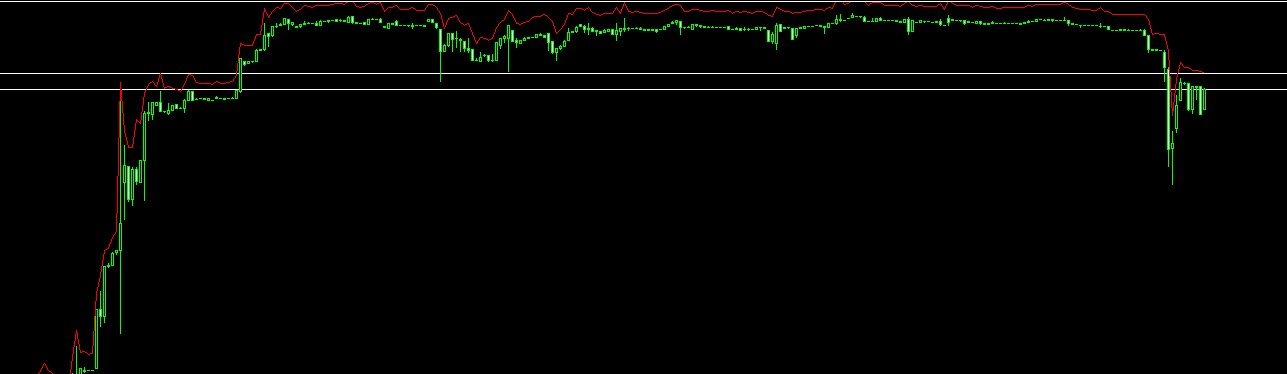
It is super imporant to know what the spread is on your charts!


This indicator displays the Ask High of the past bars, similar to that of the backtester. This allows you to see the spread of bars in real time.


The spread of the bar is the ask-bid price. The spread of a bar is the minimum spread of any ticks found within that bar. I hope this makes sense.

If you have any questions or feedback, let me know - thank you. 

おすすめのプロダクト
Trading Room Indicator is a professional market-structure tool built to give traders a clear, complete trading framework — combining CPR levels, dynamic targets, and trend direction in one clean view. Instead of guessing direction or overloading the chart with indicators, Trading Room Indicator focuses on what actually matters : levels, direction, and potential price expansion. What This Indicator Provides CPR Structure BUY level SELL level Pivot Point (PP) Designed to highlight equilibrium
マトリックスアローインジケーターマルチタイムフレームパネルMT5 は無料のアドオンであり、マトリックスアローインジケーターMT5の優れた資産です。これは、5つのユーザーがカスタマイズした時間枠と合計16の変更可能なシンボル/機器の現在のマトリックスアローインジケーターMT5信号を示しています。ユーザーは、マトリックスアローインジケーターMT5で構成される10の標準インジケーターのいずれかを有効/無効にするオプションがあります。マトリックスアローインジケーターMT5のように、10の標準インジケーター属性もすべて調整可能です。マトリックスアローインジケーターマルチタイムフレームパネルMT5には、16個の変更可能なシンボルボタンのいずれかをクリックすることで、現在のチャートを変更するオプションもあります。これにより、異なるシンボル間ではるかに高速に作業でき、取引の機会を逃すことはありません。 この無料の マトリックスアローインジケーターマルチタイムフレームパネルMT5 アドオンを使用する場合は、ここでマトリックスアローインジケーターMT5を別途購入する必要があります: https://w
FREE
MultiFrame Volume Trend (MFVI) is a powerful VWAP-based indicator that displays volume trends across multiple timeframes in a clean, easy-to-read dashboard directly on your chart. Instantly capture the overall market direction in just seconds. Features Multi-timeframe VWAP analysis from M1 to MN1. Dashboard panel shows the trend state of each timeframe at a glance. Plots VWAP line and buy/sell arrows directly on the chart. Fully customizable: colors, line width, panel position, arrow symbols. Bu
FREE
One Click Trading – Auto TP SL Developer TraderLinkz Version 1.00 Category Utility What it does Adds missing TP and SL to your manual trades and pending orders Sets them once per ticket Lets you move TP and SL afterward Works on hedging and netting accounts Scans on every tick and reacts on trade events Why you want it You place faster entries You get consistent risk and exit targets You reduce fat finger errors You keep full manual control Quick start Attach the EA to any chart Keep TP and SL e
FREE
The Simple Dashboard is a dashboard where you can build your own strategy based on RSI, Stochastic, and Moving Average. You can define your own buy and sell signal conditions as you wish. For example, you can set a sell signal when RSI is at the 70 level and Stochastic is in a death cross, or even the opposite. The point is, set it however you like and apply your own custom configuration. That’s how simple it is.
FREE
Bonus when buying an indicator or an advisor from my list. Write to me in private messages to receive a bonus. Manual Assistant MT5 is a professional manual trading tool that will make your trading fast and comfortable. It is equipped with all the necessary functions that will allow you to open, maintain and close orders and positions with one click. It has a simple and intuitive interface and is suitable for both professionals and beginners. The panel allows you to place buy and sell orders w
FREE
️ Trade Manager oneclick  ( Reverse Trade,  Partial Close,  Breakeven, Close All Running Trade )   control – Smart Manual Trade Control for MT5 Trade Manager oneclick control is a powerful yet lightweight trade management utility built for manual traders who want precise control over their open positions — directly from the MT5 chart. This EA does not open or close trades automatically based on any strategy. It simply provides one-click management tools to handle your running trades efficient
FREE
この情報インジケーターは、アカウントの現在の状況を常に把握したい人にとって役立ちます。 -   より便利なインジケーター このインジケーターには、ポイント、パーセンテージ、通貨での利益、現在のペアのスプレッド、現在の時間枠でバーが閉じるまでの時間などのデータが表示されます。 チャート上に情報線を配置するには、いくつかのオプションがあります。 価格の右側 (価格の後ろにあります)。 コメントとして (グラフの左上隅に); 画面の選択した隅。 情報区切り記号を選択することもできます。 | / \ # このインジケーターは使いやすく、非常に有益です。設定で不要な情報項目を無効にすることも可能です。 設定 外観の種類     - 情報行の表示タイプ。次の 3 つのオプションがあります。 価格に従ってください     - 価格に従う。 コメントとして     - コメントとして; 画面の選択した隅に     - 画面の選択した隅にあります。 添付用グラフコーナー     - 表示タイプを選択した場合 画面の選択されたコーナーでは、この項目を使用して 4 つのスナップ コーナーの 1 つを選択
FREE
Simple and easy-to-use trading panel. Replaces the standard Meta Trader 5 panel. This new panel allows you to add stop loss and take profit (in points). It also allows you to click and drag it to any place on the screen, making it easier to view and operate. Redesigned to focus on risk control, with a limit on the margin that can be used and a limit on possible loss per stop loss. With the facility to place only the stop loss and the EA automatically calculates the allowed lot size, in order to
FREE
The   "InfoBox"   utility is designed to display the presence of open orders, the number of lots, current profit and much more in one window. The version for the MT4 platform is here . You've probably encountered a situation where you have an advisor that works on a currency pair, but information about its operation: - orders and their number, the size of the spread for the instrument, the volume of lots on the market, drawdown and much more - are scattered in different places of the terminal an
FREE
AZ ATR indicator (with volume correlation bonus) Standard ATR indicator, you can enable ignoring abnormally large candles. It is possible to change the location of the displayed text in 4 corners of the chart. You can change the calculation period (days ago). Bonus - the indicator has a correlation with volumes. Can be enabled to display a possible priority at the current moment in the market. What do the values ​​mean: Positive correlation (0.3 - 1.0): 0.3-0.7 - moderate connection
FREE
The indicator detects and displays М. Gartley's Butterfly pattern. The pattern is plotted by the extreme values of the ZigZag indicator (included in the resources, no need to install). After detecting the pattern, the indicator notifies of that by the pop-up window, a mobile notification and an email. The pattern and wave parameters are displayed on the screenshots. The default parameters are used for demonstration purposes only in order to increase the amount of detected patterns. Parameters z
Supports displaying up to 4 trading sessions with fully adjustable start and end times. Each session can be customized individually with unique colors and visual styles. Users can choose between drawing rectangles or filling areas, while the indicator clearly displays each session’s price range for better market insight. Free to use until the end of 2025. The paid version will be available starting from 2026.
FREE
Visual Dolphin Indicator
AL MOOSAWI ABDULLAH JAFFER BAQER
Visual Dolphin Indicator Unlock the rhythm of the market with the Visual Dolphin Indicator, your ultimate tool for identifying and capitalizing on market trends with clarity and confidence. Designed for both novice and experienced traders, this indicator eliminates the noise and guesswork, providing crystal-clear buy and sell signals directly on your chart. The Logic Behind the Waves The core of the Visual Dolphin Indicator is a sophisticated yet intuitive dual-wave system based on moving avera
ChartColorMT5
Thomas Pierre Maurice Moine
Customize your charts with this simple utility. Choose in the 24 pre-built color sets, or use your own colors, save them to re-use them later. You can also add a text label on your chart. --- Chart Colors-- Color Set : 24 prebuilt color sets (select "Custom" to use colors below) Background color Foreground color Grid color Chart Up color Chart Down color Candle Bull color Candle Bear color  Line color Volumes color --- Label--- Text Label : Type the text you want to appear on the chart Label P
FREE
MultiTimeframe Info Feed (MIF) Indicator Description: MultiTimeframe Info Feed (MIF) is a smart MQL5 indicator that displays a dynamic, real-time info panel directly on your chart, offering powerful insight into current market conditions. Key features include: Real-time display of Open, High, Low, Close, and live Tick price Tick Rate (ticks per second) for assessing market activity Auto-calculated Entry Price on new candle formation Signal direction detection (BUY / SELL) Price action pattern re
FREE
ZumikoFX Trading Stats - Professional Account Dashboard Overview ZumikoFX Trading Stats is a comprehensive, real-time account monitoring dashboard designed for serious traders who need complete visibility of their trading performance. This indicator displays all crucial trading statistics in an elegant, easy-to-read panel positioned in the top-right corner of your chart. Key Features Complete Account Monitoring Balance & Equity - Real-time account status with current balance and equity includ
FREE
Total Closed Trades – MT5 Indicator The Total Closed Trades indicator for MetaTrader 5 provides a quick, visual overview of your trading performance by displaying a simple and intuitive 3-value breakdown : Total Trades – The total number of closed trades. Winning Trades – Number of profitable trades. Losing Trades – Number of losing trades. Instead of digging through reports, traders can instantly monitor their historical performance with a compact and elegant pie chart-style widget. Key
FREE
The Zigzag Price Arrow indicator is an enhanced version of the classic Zigzag indicator, combining the traditional zigzag pattern with advanced visual features. It not only identifies major market turning points but also provides clear trading signals through: • Directional arrows: Displays colored arrows (green for buy, magenta for sell) indicating potential trend directions. • Price labels: Shows the exact price values at each pivot point directly on the chart. • Improved visual clarity: Make
FREE
Hi you, I need your help! Be my Patron, let's make it possible! https://www.patreon.com/joaopeuko https://github.com/Joaopeuko/Mql5-Python-Integration Channel: English version - Versão Inglês: https://www.mql5.com/en/channels/Mql5_Python_Integration_EN Portuguese version - Versão Português: https://www.mql5.com/en/channels/Mql5_Python_Integration_PT Paid version with 38 indicator: https://www.mql5.com/en/market/product/58056 I believe that development in PYTHON is easier and simpler
FREE
https://youtu.be/KHhg88fXWTk?si=ZoVtpc-wpfTVImSL 5-Minute Trading Strategy | Quick & Effective for Beginners Welcome to our trading channel- the deepak trading In this video, we'll be exploring a simple 5-minute trading strategy that can help you capture quick market movements and make profitable trades. Whether you're a beginner or an experienced trader, this strategy is designed to give you clear entry and exit points using technical indicators like EMA, RSI, and Stochastic Oscillator.
FREE
Position Size Calculator Lite MT5 – 無料リスク管理インジケーター 重要事項 チャート上でのマウス操作(ドラッグ&ドロップ)によるインタラクティブなストップロス/テイクプロフィット設定、証拠金計算、ブレイクイーブン、詳細なリスク指標を備えたアドバンスド・パネルが必要な場合は、マーケットで Position Size Calculator PRO MT5 を検索してください。このLiteバージョンは、ポジションサイズ計算に特化した無料の簡易版です。 概要 Position Size Calculator Lite MT5 は、以下の要素から推奨ロット数を計算する無料のインジケーターです: 口座残高に対するリスクパーセンテージ ATR(平均真の範囲)に基づいたストップロス 目標リスク報酬比(RR比) インジケーターは、推定リスク、計算されたロット数、および予測されるストップロス・テイクプロフィット価格を軽量なパネルでチャート上に表示します。ボタン一つでBUY(買い)とSELL(売り)を素早く切り替えることができます。 主な機能 (Liteバージョン) 口座
FREE
Breakeven Bot
Gabriel Paul Ange Perrin
Optimize your trading management with Breakeven Bot, the essential tool for active traders managing multiple positions at once. No more wasting time manually adjusting your stops—one click is all it takes to secure your profits! Main Feature: ️ "BREAKEVEN" Button – Instantly set all profitable positions to breakeven and protect your gains quickly. ️ Customization Options: Set breakeven in pips or currency, depending on your preference. Choose whether breakeven should be at the entr
FREE
This indicator will mirror the assets in use in another metatrader, being able to choose the timeframe and a template. This is the Metatrader 5 Client, it needs the Metatrader 4 or 5 Server versions: Metatrader 4 Mirror Chart Server:   https://www.mql5.com/en/market/product/88644 Metatrader 5 Mirror Chart Server: https://www.mql5.com/en/market/product/88652 Details of how it works in the video.
FREE
The utility opens copies of open trades. It is very convenient if you use the   Signals   service and want to increase the volume of transactions. Settings: Symbols: all symbols only current symbol Orders: Buy Sell Magic Any Magic Input Magic Lot size Original - lot size from original order; Fix Lot - fix lot size (input); Lot X Mult - lot size X koef; Stop Loss From sender - Stop Loss from original; Without - without Stop Loss; Plus Fix - Stop Loss from original order + fix points; Fix Point -
FREE
Position Size Tool – Smart Risk Management & Trade Execution Panel The Position Size Tool is a powerful and intuitive MT5 panel that simplifies your trading by combining position sizing , risk calculation , risk/reward visualization , and order placement —all in one place. ️ Clean & Functional Interface The tool features a compact, real-time panel with the following: Balance & Equity display Live Price tracking Customizable Risk % input Auto-calculated Lot Size based on SL and Risk Input for S
FREE
The Monthly Weekly Open Line is an indicator that plots: The current month open line that will extend till the last week on the month. Weekly lines that span the look back days period that you have set . Each line will extend from the respective weekly Monday zero GMT till friday of the respective week. Monthly and Weekly open lines can be used to build very powerfull anc consistent trading strategies. They act as natural S/R price barriers.
FREE
You can change the time period of the chart at the touch of a button. You can also change multiple charts at the touch of a button. You can also change multiple charts at the touch of a button,   saving you the trouble of changing time periods. We are live-streaming the actual operation of the system. Please check for yourself if it is usable. Please check it out for yourself. https://www.youtube.com/@ganesha_forex We do not guarantee your investment results. Investments should be made at you
The idea of the system is to indentify the reversal patterns using the calculation of the composite candle. The reversal patterns is similar to the "Hammer" and "Hanging Man" patterns in Japanese candlestick analysis. But it uses the composite candle instead the single candle and doesn't need the small body of the composite candle to confirm the reversal. Input parameters: Range - maximal number of bars, used in the calculation of the composite candle. Minimum - minimal size of the composite can
FREE
MACD Colored ZeroLag
Farzin Sadeghi Bonjar
4.73 (11)
It is the MQL5 version of zero lag MACD that was available for MT4 here: https://www.mql5.com/en/code/9993 Also there was a colored version of it here but it had some problems: https://www.mql5.com/en/code/8703 I fixed the MT4 version which has 95 lines of code. It took me 5 days to write the MT5 version.(reading the logs and testing multiple times and finding out the difference of MT5 and MT4!) My first MQL5 version of this indicator had 400 lines of code but I optimized my own code again and n
FREE
このプロダクトを購入した人は以下も購入しています
ARIPoint
Temirlan Kdyrkhan
1 (1)
ARIPoint is a powerful trading companion designed to generate high-probability entry signals with dynamic TP/SL/DP levels based on volatility. Built-in performance tracking shows win/loss stats, PP1/PP2 hits, and success rates all updated live. Key Features: Buy/Sell signals with adaptive volatility bands Real-time TP/SL/DP levels based on ATR Built-in MA Filter with optional ATR/StdDev volatility Performance stats panel (Success, Profit/Loss, PP1/PP2) Alerts via popup, sound, push, or email Cu
このインジケーターを購入すると、プロ仕様のトレードマネージャーを無料で差し上げます。 まず第一に、このトレーディングシステムがノンリペイント、ノンリドロー、ノンラグのインジケーターであることを強調する価値がある。これにより、手動取引とロボット取引の両方に理想的なものになっています。 オンラインコース、マニュアル、プリセットのダウンロード。 「スマートトレンドトレーディングシステム MT5」は、新規および経験豊富なトレーダー向けにカスタマイズされた包括的なトレーディングソリューションです。10以上のプレミアムインジケーターを組み合わせ、7つ以上の堅実なトレーディング戦略を備えており、多様な市場状況に対応する多目的な選択肢となっています。 トレンドフォロー戦略:トレンドを効果的に乗り越えるための正確なエントリーとストップロス管理を提供します。 リバーサル戦略:潜在的なトレンドの反転を特定し、トレーダーがレンジ相場を活用できるようにします。 スキャルピング戦略:高速で正確なデイトレードおよび短期取引のために設計されています。 安定性:すべてのインジケーターはノンリペイント、ノンリドロー、ノ
Power Candles – あらゆる市場に対応した強度ベースのエントリーシグナル Power Candles は、Stein Investments が長年培ってきた強度分析を価格チャート上に直接反映します。価格だけに反応するのではなく、各ローソク足は実際の市場の強さに基づいて色分けされ、モメンタムの蓄積、強度の加速、明確なトレンド転換を瞬時に把握できます。 すべての市場に共通する単一ロジック Power Candles は すべての取引シンボル で自動的に動作します。現在のシンボルが Forex か非 Forex 市場かを自動判別し、内部で適切な強度モデルを適用します。 Forex および Gold :FX Power のデルタ値を使用(絶対値レンジ最大 100) 指数、暗号資産、CFD :IX Power の強度値を使用(絶対値レンジ最大 50) 必要な強度計算は Power Candles に直接組み込まれています。ローソク足のカラーリングやシグナルロジックに、追加のインジケーターは不要です。 価格ノイズではなく「強度状態」 各ローソク足は、以下の 9 つの明確に定義された強
このインジケーターを購入された方には、以下の特典を 無料 で提供しています: 各トレードを自動で管理し、ストップロスとテイクプロフィットを設定し、戦略ルールに基づいてポジションを決済する補助ツール 「Bomber Utility」 様々な銘柄に合わせたインジケーターの設定ファイル(セットファイル) 「最小リスク」、「バランスリスク」、「待機戦略」 の3つのモードで使用できる Bomber Utility 用の設定ファイル このトレーディング戦略をすぐに導入・設定・開始できる ステップバイステップのビデオマニュアル ご注意: 上記の特典を受け取るには、MQL5のプライベートメッセージシステムを通じて販売者にご連絡ください。 オリジナルのカスタムインジケーター 「Divergence Bomber(ダイバージェンス・ボンバー)」 をご紹介します。これは、MACDのダイバージェンス(乖離)戦略に基づいた 「オールインワン」型のトレーディングシステム です。 このテクニカルインジケーターの主な目的は、価格とMACDインジケーターの間に発生するダイバージェンスを検出 し、将来の価格の動きを示す
Entry In The Zone and SMC Multi Timeframe は、Smart Money Concepts(SMC)に基づいて開発された リアルタイム市場分析ツール です。 本システムは、トレーダーがマーケットストラクチャーを体系的に分析し、市場全体の方向性をより明確に把握できるよう設計されています。 システムは複数の時間軸にわたり、 反転ポイント(Reversal Points)・主要ゾーン(Key Zones)・マーケットストラクチャー を自動的に解析します。さらに、 POI(Point of Interest)・ノーリペイントシグナル・Auto Fibonacci Levels を表示し、プルバックや反転ポイントを高精度で検出します。 リアルタイムシグナルとアラートにより、価格が主要ゾーンに到達したときや、ゾーン内で反転シグナルが発生した際に、重要な機会を逃すことはありません。 また、本システムは インジケーター と シグナルシステム の両方の機能を兼ね備えた 2-in-1ツール であり、ゾーン分析とリアルタイムエントリーシグナルを一体化しています。 さらに
SuperScalp Pro — 高度なマルチフィルター対応スキャルピングインジケーターシステム SuperScalp Pro は、クラシックな Supertrend と複数のインテリジェントな確認フィルターを組み合わせた高度なスキャルピング用インジケーターシステムです。M1〜H4 のすべての時間足で効率的に機能し、特に XAUUSD、BTCUSD、および主要なFX通貨ペアに適しています。単体のシステムとして、また既存の取引戦略へ柔軟に統合して使用できます。 本インジケーターは 11 以上のフィルターを統合しており、短期・長期の EMA、トレンド判定に用いる 3 本の EMA、EMA スロープ(EMA slope)、RSI、ADX、出来高、VWAP、ボリンジャーバンドのブレイクアウト、MACD ダイバージェンスフィルターなどを含みます。スマートキャンドルフィルターはローソク足の終値を確認して弱いシグナルを排除し、3 本の EMA と MACD ダイバージェンスを組み合わせたトレンド認識メカニズムにより勝率の高いシグナルの選別を支援します。 SuperScalp Pro は ATR に基
Azimuth Pro
Ottaviano De Cicco
5 (1)
発売プロモーション Azimuth Proは先着100名様限定で 299ドル でご提供します。最終価格は 499ドル となります。 リテールとインスティテューショナルのエントリーの違いはインジケーターではなく、ロケーションにあります。 多くのトレーダーは、モメンタムを追いかけたり、遅行シグナルに反応して、任意の価格レベルでエントリーします。機関投資家は、需給が実際にシフトする構造的なレベルに価格が到達するのを待ちます。 Azimuth Proはこれらのレベルを自動的にマッピングします:スイングアンカーVWAP、マルチタイムフレーム構造ライン、高確率ロケーションにのみ出現するABCパターン。 Azimuth Proは、構造分析とインテリジェントな自動化の両方を求めるプロフェッショナルトレーダー向けに構築されています。 Azimuthが外科的精度で市場構造をマッピングする一方、Azimuth Proはインテリジェンスレイヤーを追加します:トレーディングスタイルの自動検出、スマート設定された移動平均線、20年のデータでバックテストされた最適化パラメータ。その結果、お使いの銘柄と
無料の AUX インジケーターと EA サポ   直接ダウンロード — ここをクリック [ D.I.C.E ] The DICE Indicator Divergence in Chaos Environment は、エリオット波動理論とトレーディングカオス手法を組み合わせて使用するトレーダーのために設計された MT5 専用ツールです。価格変動の中の隠れたおよび通常のダイバージェンスを検出し、ビル・ウィリアムズが説明したカオス市場環境と同期します。 主な特徴 エリオット波動に対応したダイバージェンス検出:波動構造と調和した強気・弱気ダイバージェンスを識別。 カオス手法の統合:AO(オーサムオシレーター)と市場構造に整合。 マルチタイムフレームスキャン:異なる時間枠でダイバージェンスを分析し、トレンドの転換を確認。 視覚的アラートとオブジェクト:チャート上の矢印、ライン、マーカーで即座に識別。 市場適応読解:カオス的状況に自動適応し、ノイズを除去して有効なセットアップを維持。 ブレイクプルバックエントリー手法:シンプルなフィボナッチリトレースメントとピボットポイントを使用。 利点 ダイ
まず第一に、この取引インジケーターは再描画されず、再描画されず、遅延しないことを強調する価値があります。これにより、手動取引とロボット取引の両方に理想的なものになります。 ユーザーマニュアル:設定、入力、戦略。 アトミックアナリストは、価格の強さとモメンタムを利用して市場でより良いエッジを見つけるためのPA価格アクションインジケーターです。ノイズや誤ったシグナルを除去し、取引ポテンシャルを高めるための高度なフィルターを備えています。複雑なインジケーターの複数のレイヤーを使用して、アトミックアナリストはチャートをスキャンし、複雑な数学的計算をシンプルなシグナルと色に変換します。これにより、どのような初心者トレーダーでも理解して使用し、一貫した取引の決定を行うことができます。 「アトミックアナリスト」は、新規および経験豊富なトレーダー向けにカスタマイズされた包括的な取引ソリューションです。プレミアムインジケーターとトップノッチの機能を1つの取引戦略に組み合わせ、すべてのタイプのトレーダーにとって汎用性のある選択肢にします。 デイリートレーディングとスキャルピング戦略:高速で正確なデイ
Smart Stop Indicator – チャート上で実現するインテリジェントなストップロス精度 概要 Smart Stop Indicator は、ストップロスを勘や感情ではなく、明確で体系的に設定したいトレーダーのために設計されています。本ツールは、クラシックなプライスアクション(高値更新・安値切り下げ)と最新のブレイクアウト認識ロジックを組み合わせ、次に来るべき論理的なストップレベルを正確に特定します。トレンド相場、レンジ、急速なブレイクアウト局面のいずれであっても、最適な SL ゾーンとその状態(“new”、“broken”、“valid”)をチャート上に直接表示します。さらに今回、SL 距離の %ADR 表示も新たに追加されています。 主な特徴 マーケット構造に基づく自動ストップ配置 • 市場構造とリアルタイムの値動きに基づき、意味のあるストップロスレベルを自動検出します。 スマートなブレイクアウト感知 • 急激な方向転換やブレイクアウトにも柔軟に対応し、早すぎるストップ調整を避けます。 SL %ADR の表示 • ストップロスまでの距離を ADR(Averag
FX Power: 通貨の強弱を分析して、より賢い取引を実現 概要 FX Power は主要通貨と金の実際の強弱をあらゆる市場状況で理解するための必須ツールです。強い通貨を買い、弱い通貨を売ることで、 FX Power は取引の意思決定を簡素化し、高い確率の取引機会を見出します。トレンドを追従する場合でも、極端なデルタ値を使用して反転を予測する場合でも、このツールはあなたの取引スタイルに完全に適応します。ただ取引するだけではなく、 FX Power で賢く取引をしましょう。 1. なぜ FX Power がトレーダーにとって非常に有益なのか 通貨と金のリアルタイム強弱分析 • FX Power は主要通貨と金の相対的な強弱を計算し、マーケットダイナミクスに関する明確な洞察を提供します。 • どの資産がリードしているか、または後れを取っているかを監視して、取引するペアを賢く選びましょう。 マルチタイムフレームの包括的なビュー • 短期、中期、長期のタイムフレームで通貨と金の強弱を追跡し、マーケットトレンドに基づいて取引戦略を調整できます。 • スキャルピングからスイングトレード
トレンド スクリーナー インジケーターでトレンド取引の力を解き放ちます。ファジー ロジックと複数通貨システムを活用した究極のトレンド取引ソリューションです。 ファジー ロジックを活用した革新的なトレンド インジケーターである Trend Screener を使用して、トレンド取引を向上させます。 これは、13 を超えるプレミアム ツールと機能、および 3 つの取引戦略を組み合わせた強力なトレンド追跡インジケーターであり、Metatrader をトレンド アナライザーにする多用途の選択肢となります。 期間限定オファー : トレンド スクリーナー インジケーターは、わずか 100 ドルで生涯ご利用いただけます。 (元の価格 50$ ) (オファー延長) Trend Screener の 100% 非再描画精度の揺るぎない精度を体験して、取引の決定が過去の価格変動の影響を受けないようにしてください。 マルチタイムフレームおよびマルチ通貨機能の多用途性を解放し、比類のない自信を持って外国為替、商品、暗号通貨、インデックスの世界を取引できるようにします。 Trend Screener の包括的な
これはMT5のインジケーターで、再描画なしで取引に参入するための正確なシグナルを提供します。 外国為替、暗号通貨、金属、株式、インデックスなど、あらゆる金融資産に適用できます。かなり正確な見積もりを提供し、取引を開始して終了するのに最適な時期を教えてくれます。1つのシグナルを処理しただけでインジケーターの元が取れた例の 動画 (6:22)をご覧ください。Entry PointsPro インジケーターの助けを借りたほとんどのトレーダーの最初の1週間の結果が改善しています。 Telegramグループ に登録してください。Entry Points Proインジケーターのメリットは次の通りです。 再描画のないエントリーシグナル 再描画されるインジケーターでは一度表示されたシグナルが削除されて大きな金銭的損失につながることがありますが、これと異なり、表示されて確認されたシグナルは消えることがありません。 エラーなしの取引開始 インジケーターアルゴリズムによって取引を開始する(資産を売買する)理想的な瞬間を見つけることができます。それを使用するすべてのトレーダーの成功率が向上します。 あら
Super Signal – Skyblade Edition プロ仕様のノンリペイント / ノーラグ・トレンドシグナルシステム。卓越した勝率を実現 | MT4 / MT5 対応 1分足、5分足、15分足などの低い時間足で最も効果を発揮します。 主な特徴: Super Signal – Skyblade Edition は、トレンド取引に特化したスマートなシグナルシステムです。マルチレイヤーのフィルターロジックを用いて、明確な方向性と実際のモメンタムに支えられた強力なトレンドのみを検出します。 このシステムは 天井や底を予測するものではありません 。次の3つの条件がすべて満たされた場合にのみシグナルを発生させます: 明確なトレンド方向 モメンタムの増加 健全なボラティリティ構造 市場セッションに基づく流動性分析と組み合わせることで、シグナルの精度とタイミングがさらに向上します。 シグナルの特性: すべての矢印シグナルは 100% 非リペイント / 遅延なし 一度出現したシグナルは固定され、点滅・消失しません チャート上の矢印、情報パネル、ポップアップ通知、音声アラート、プッシュ通知
このインジケーターは、市場で 関心が示されたゾーン をハイライトし、その後に 注文の蓄積ゾーン を表示します。 これは、大規模な**板情報(オーダーブック)**のように機能します。 これは、 巨大な資金 のためのインジケーターです。その性能は卓越しています。 市場にどんな関心が存在していても、 必ず目に見えるようになります 。 (これは 完全に再設計され、自動化されたバージョン です。もはや手動分析は必要ありません。) トランザクションスピード(取引速度) は新しい概念のインジケーターで、市場で大口注文が どこに・いつ 集中しているかを示し、それに基づいたチャンスを提供します。 トレンドの変化を 非常に早い段階 で察知することができます。 FXでは「出来高」と呼ばれているものは誤解されています。実際には、これは 時間あたりの価格変動量 です。したがって、正しい名称は トランザクションスピード です。 考え方・行動・分析の仕方すべてが問われます。 分析パラダイムの転換は非常に重要です。 このインジケーターは、FXにおける出来高の考え方を 根本から再定義 し、論理的な形で正確に活用する、
FX Levels: あらゆる市場における非常に高精度なサポート&レジスタンス 概要 通貨ペア、株式指数、個別銘柄やコモディティなど、どのような市場でも信頼できるサポートとレジスタンスを特定したいですか? FX Levels は伝統的な “Lighthouse” メソッドと先進的な動的アプローチを融合し、ほぼ汎用的な精度を実現します。ブローカーの実務経験を活かし、自動化されたデイリー更新とリアルタイム更新を組み合わせることで、 FX Levels は反転ポイントを見つけ、利益目標を設定し、自信をもってトレードを管理するための手助けをします。今すぐ試してみて、サポート/レジスタンス分析の正確性がどれほどトレードを向上させるかを実感してください! 1. FX Levels がトレーダーにとって非常に有用な理由 非常に正確なサポート&レジスタンスゾーン • FX Levels は異なるブローカー環境でもほぼ同一のゾーンを生成するよう設計されており、データフィードの差異や時刻設定のずれによる不一致を解消します。 • つまり、どのブローカーを利用していても一貫したレベルが得られるため、戦
まず第一に、この取引ツールはノンリペイント、ノンリドロー、ノンラグの指標であり、プロの取引に理想的ですことを強調する価値があります。 オンラインコース、ユーザーマニュアル、デモ。 スマートプライスアクションコンセプトインジケーターは、新米から経験豊富なトレーダーまで、非常 に強力なツールです。Inner Circle Trader AnalysisやSmart Money Concepts Trading Strategiesなど、20以上の有用な指標を1つに組み合わせています。このインジケーターはスマートマネーコンセプトに焦点を当て、大手機関の取引方法を提供し、彼らの動きを予測するのに役立ちます。 特に、流動性分析に優れており、機関がどのように取引しているかを理解しやすくしています。市場のトレンドを予測し、価格の動きを慎重に分析するのに優れています。機関の戦略とトレードを合わせることで、市場の動向についてより正確な予測ができます。このインジケーターは多目的であり、市場構造を分析し、重要な注文ブロックを特定し、さまざまなパターンを認識するのに優れています。 このインジケーター
優れたテクニカルインジケーター「Grabber」をご紹介します。これは、すぐに使える「オールインワン」トレーディング戦略として機能します。 ひとつのコードに、市場のテクニカル分析ツール、取引シグナル(矢印)、アラート機能、プッシュ通知が強力に統合されています。 このインジケーターを購入された方には、以下の特典を無料で提供します: Grabberユーティリティ:オープンポジションを自動で管理するツール ステップバイステップのビデオマニュアル:インジケーターのインストール、設定、取引方法を解説 カスタムセットファイル:インジケーターをすばやく自動設定し、最大限の成果を出すための設定ファイル 他の戦略はもう忘れてください!Grabberだけが、あなたを新たなトレードの高みへと導いてくれるのです。 Grabber戦略の主な特徴: 推奨タイムフレーム:M5〜H4 対応通貨ペア・資産:どれでも使用可能ですが、私が実際に検証した以下を推奨します(GBPUSD、GBPCAD、GBPCHF、AUDCAD、AUDUSD、AUDSGD、AUDCHF、NZDUSD、NZDCAD、EURCAD、EURUSD、E
Shock Pullback
Suleiman Alhawamdah
5 (1)
簡単に言えば、現在のローソク足の横に「ピップス」として知られる白い数字の動きが現れ始めたら、取引を開始できます。白い「ピップス」は、買いまたは売りの取引が現在アクティブであり、白色で示されるように正しい方向に動いていることを示しています。白いピップスの動きが止まり、静的な緑色に変わったとき、それは現在のモメンタムの終了を示します。数字の緑色は、買いまたは売りの取引から得られた「ピップス」での総利益を表します。 さらに、インジケーター内の他の高度でプロフェッショナルな分析ツールに従って取引を開始することも可能です。インジケーターに表示されるシグナルや色を観察することで、高精度で多数のスキャルピングチャンスを捉えることができます。テスト中またはリアルチャート上でインジケーターの動作を理解しておくことをお勧めします。 ほとんどのFX市場に対応:金(ゴールド)や人気の株価指数市場(ダウ・ジョーンズ、S&P500、ナスダック、DAXなど)、およびEUR/USD、GBP/USD、USD/JPYなどの主要通貨ペアでの取引に最適です。また、ビットコイン、イーサリアム、ステーブルコインなどの主要な暗号
Market Structure Patterns
Samuel Manoel De Souza
4.47 (19)
Available for   MT4   and   MT5 . Join the Market Structure Patterns channel to download materials available for study and/or additional informations. Related posts: Market Structure Patterns - Introdução Market Structure Patterns   is an indicator based on   smart money concepts   that displays   SMC/ICT   elements that can take your trading decisions to the next level. Take advantage of the   alerts ,   push notifications   and   email messages   to keep informed from when an element is form
Quantum TrendPulse を ご紹介します。これは、   SuperTrend   、   RSI   、および Stochastic のパワーを 1 つの包括的なインジケーターに組み合わせて、取引の可能性を最大限に引き出す究極の取引ツールです。精度と効率を求めるトレーダー向けに設計されたこのインジケーターは、市場のトレンド、勢いの変化、最適なエントリー ポイントとエグジット ポイントを自信を持って特定するのに役立ちます。 主な特徴: SuperTrend 統合: 現在の市場動向に簡単に追従し、収益性の波に乗ることができます。 RSI精度: 買われすぎと売られすぎのレベルを検出し、市場の反転のタイミングに最適で、SuperTrendのフィルターとして使用されます。 確率的精度: 確率的振動を活用して、変動の激しい市場で隠れたチャンスを見つけます。SuperTrend のフィルターとして使用されます。 マルチタイムフレーム分析:   M5 から H1 または H4 まで、さまざまなタイムフレームで市場を常に把握します。 カスタマイズ可能なアラート: カスタム取引条件が満たされ
IX Power MT5
Daniel Stein
4.92 (12)
IX Power: 指数、商品、暗号資産、外国為替市場の洞察を発見 概要 IX Power は、指数、商品、暗号資産、外国為替市場の強弱を分析するための多用途ツールです。 FX Power が全ての利用可能な通貨ペアデータを活用して外為ペアで最高の精度を提供する一方、 IX Power は基礎資産の市場データにのみ焦点を当てています。この特性により、 IX Power は非外為市場に最適であり、単純な外為分析にも信頼性の高いツールです。どのチャートでもスムーズに機能し、取引判断を向上させるための明確で実行可能な洞察を提供します。 1. IX Power がトレーダーにとって価値がある理由 複数市場での強弱分析 • IX Power は指数、商品、暗号資産、外為シンボルの強弱を計算し、それぞれの市場に合わせた洞察を提供します。 • US30、WTI、ゴールド、ビットコイン、または通貨ペアなどの資産を監視して取引機会を発見できます。 幅広い市場に適応 • 外為取引では、 FX Power が関連する全ての通貨ペアを分析することで比類のない精度を提供します。 • IX Power
ARIScalp is a powerful trading companion designed to generate high-probability entry signals with dynamic TP/SL/DP levels based on volatility. Built-in performance tracking shows win/loss stats, PP1/PP2 hits, and success rates all updated live. Key Features: Buy/Sell signals with adaptive volatility bands Real-time TP/SL/DP levels based on ATR Built-in MA Filter with optional ATR/StdDev volatility Performance stats panel (Success, Profit/Loss, PP1/PP2) Alerts via popup, sound, push, or email Cus
ARICoin is a powerful trading companion designed to generate high-probability entry signals with dynamic TP/SL/DP levels based on volatility. Built-in performance tracking shows win/loss stats, PP1/PP2 hits, and success rates all updated live. Key Features: Buy/Sell signals with adaptive volatility bands Real-time TP/SL/DP levels based on ATR Built-in MA Filter with optional ATR/StdDev volatility Performance stats panel (Success, Profit/Loss, PP1/PP2) Alerts via popup, sound, push, or email Cust
Gold Sniper Scalper Proは、MetaTrader 5向けのプロフェッショナルなindicatorで、トレーダーがエントリーポイントを特定し、リスクを効果的に管理するために設計されています。 このindicatorは、シグナル検出システム、Entry/SL/TPの自動管理、ボリューム分析、リアルタイムパフォーマンス統計を含む包括的な分析ツールセットを提供します。 システムを理解するためのユーザーガイド   |   他の言語のユーザーガイド 主な機能 シグナル検出システム このindicatorは、price actionと市場構造の分析に基づいて潜在的なエントリーポイントを自動検出します。トレード機会を検出すると: - BUY(青)またはSELL(赤)の矢印がchart上に表示されます - ローソク足が色付けされ、シグナルゾーンが識別されます - Entry/SL/TPレベルが自動計算されます シグナルは価格がEntryレベルに触れた時のみ発動し、市場に確認されていないシグナルをフィルタリングします。 インテリジェントなEntry/SL/TP管理 - Ent
FX Dynamic: カスタマイズ可能なATR分析でボラティリティとトレンドを把握 概要 FX Dynamic は平均的な真のレンジ(ATR)の計算を活用して、日次および日中ボラティリティに関する卓越した情報をトレーダーに提供する強力なツールです。80%、100%、130%などのボラティリティ閾値を設定することで、通常の範囲を超えた際にすぐに警告を受け取ったり、有望な利益機会を素早く捉えられます。 FX Dynamic はブローカーのタイムゾーンに合わせて調整でき、安定したボラティリティ測定を維持しながら、リアルタイム分析のためにMetaTraderとシームレスに連携します。 1. なぜFX Dynamicがトレーダーにとって非常に有益か リアルタイムのATRインサイト • 日次・日中のボラティリティをひと目で把握。価格がATRの80%、100%、130%などに達したときに警告を受け取り、重要な水準にあるかどうかを確認できます。 • ボラティリティが完全に爆発する前に潜在的な反転やブレイクアウトを先取り可能。 幅広いマーケットへの適用 • 外国為替、コモディティ、株価指数な
スイングトレーディング は、トレンドの方向のスイングと可能な反転スイングを検出するように設計された最初のインジケーターです。トレーディングの文献で広く説明されているベースラインスイングトレーディングアプローチを使用します。インディケータは、いくつかの価格と時間のベクトルを調査して、全体的なトレンドの方向を追跡し、市場が売られ過ぎまたは買われ過ぎて修正の準備ができている状況を検出します。 [ インストールガイド | 更新ガイド | トラブルシューティング | よくある質問 | すべての製品 ] むち打ちを起こさずに市場スイングの利益 インジケーターは常にトレンドの方向を表示します 色付きの価格帯は機会のベースラインを表します 色付きのダッシュは、可能な反転スイングを表します この指標は、独自の品質とパフォーマンスを分析します 複数時間枠のダッシュボードを実装します カスタマイズ可能なトレンドおよびスイング期間 電子メール/サウンド/プッシュアラートを実装します インジケータは再描画またはバックペインティングではありません Swing Tradingとは Swing Tradingは
Introduction to X3 Chart Pattern Scanner X3 Cherart Pattern Scanner is the non-repainting and non-lagging indicator detecting X3 chart patterns including Harmonic pattern, Elliott Wave pattern, X3 patterns, and Japanese Candlestick patterns. Historical patterns match with signal patterns. Hence, you can readily develop the solid trading strategy in your chart. More importantly, this superb pattern scanner can detect the optimal pattern of its kind. In addition, you can switch on and off individu
The Trend Forecaster indicator utilizes a unique proprietary algorithm to determine entry points for a breakout trading strategy. The indicator identifies price clusters, analyzes price movement near levels, and provides a signal when the price breaks through a level. The Trend Forecaster indicator is suitable for all financial assets, including currencies (Forex), metals, stocks, indices, and cryptocurrencies. You can also adjust the indicator to work on any time frames, although it is recommen
Trend Ai indicatorは、トレンドの識別と実用的なエントリポイントと反転アラートを組み合わせることで、トレーダーの市場分析を強化する優れたツールです。 この指標は、ユーザーが自信と正確さで外国為替市場の複雑さをナビゲートすることを可能にします トレンドAiインジケーターは、主要なシグナル以外にも、プルバックやリトレースメント中に発生するセカンダリエントリポイントを識別し、トレーダーが確立されたトレンド内の価格修正を活用できるようにします。 重要な利点: *MT4およびMT5の仕事 *明確な買いまたは売りシグナル *再描画しません ·すべての資産で動作します 私はeaやセットをtelegram it詐欺で販売しないように注意してください。 すべての設定はここでブログで無料です。  重要! 指示とボーナスを得るために購入後すぐに私に連絡してください! 私の他のプロダクトと同様、実質操作の監視はここに見つけることができます: https://www.mql5.com/en/users/mechanic/seller&nbsp ; 設定および入力: すべての
作者のその他のプロダクト
This is one of the most powerful indicators I've ever made. I was tired of looking at other windows/websites for economical news, and regularly something would happen without me realising. So I made this indicator which displays all news at the exact time of arrival, directly on the charts! Now you too can just focus on the charts and know that you won't miss any news events. There are options: 1. You can choose to display on the price line, or at the bottom of the chart. 2. You can choose t
This is one of my most important indicators. Did you ever miss the session open/close? I did, which is why I made this indicator. It took a long time to get this right, since depending on your platform and timezone, it can be incorrect. It should be accurate for everyone now. It takes into account Daylight savings for NY and EU timezones, and should just work like magic on your charts.
## Check screenshots to see proof that this indictor is a must! ## Do you hate having to have a Monthly, Weekly, Daily chart when looking at your lower timeframes? I hated it too, so I made this. It will show you the High and Low of other timeframes on your chart, so you will always be aware where some support/resistance may be! Even on the 1 minute chart! I recommend you use it 3 times, one with Day, Week and Month selected with different line widths.  I use this on every chart I look at. Yo
フィルタ:
レビューなし
レビューに返信