 MetaTrader 5
 エキスパート
 インディケータ
 ライブラリ
 ユーティリティ
 ウィジェット
 ルール
YouTubeにあるマーケットチュートリアルビデオをご覧ください
ロボットや指標を購入する
仮想ホスティングで
EAを実行
EAを実行
ロボットや指標を購入前にテストする
マーケットで収入を得る
販売のためにプロダクトをプレゼンテーションする方法
MetaTrader 5のためのエキスパートアドバイザーとインディケータ - 559
 自動売買ロボットとインジケータを使用して、外国為替取引の収益性を高めます。 自動売買ロボットを使用すると、取引の開始と終了を自動化でき、インジケータは市場の行動をより正確に予測するのに役立ちます。
このページには、MetaTrader5アプリケーションのカタログが掲載されています。
Cointegration Pair Trading Indicator
Indicator for statistical and quantitative pair trading strategies. You can perform Long&Short or Long&Long/Short&Short between two different assets.
The indicator performs a series of statistical tests between the assets and shows whether the pair is cointegrated or not.
Suggested Usage Strategies
(a) Verify if that the pair is cointegrated by the ADF test (Augmented Dickey-Fuller Test). 0% means the pair is not cointegrated; 90% 95% 97.5% and 99% means it

I present to your attention experimentally, a new EA that forms the trading range of the time interval. The EA has built-in proprietary algorithms for transaction support.
The emerging range is set manually by the EA settings, such ranges can be set up to two pieces. After a specified time and capture the trading range, the EA starts its work. When the price goes beyond the limits of this range, the EA opens an order with market execution, accompanying the transaction, placing Take profit and S

の 出口エリア究極 は、 日次ATR(平均真値幅) そして ADR(平均日額変動幅) チャート上にレベルを直接表示することで、トレーダーは資産が通常1日にどれくらい変動するかを理解できます。 変動性に基づくターゲットゾーンにより 、この指標は重要な質問に答えます。今日の価格は現実的にどこまで上昇する可能性があるでしょうか?過去の価格変動の平均に基づいて、システムはその日の価格変動を表す上限と下限を描画します。 潜在的な高低ゾーン 。これにより設定が容易になります。 利益目標、トレーリングストップ、および日々の決済レベル 推測なしで 。 指標は、 ADRは 、ユーザーが定義した過去の期間における日々の最高値と最安値の平均差を測定するもので、 ATRは 、日ごとの価格差を考慮に入れたものです。 両方の値は、チャート上に水平価格線として表示され、リアルタイムで更新されます。トレーダーは、一方または両方の範囲を表示するか、調整するかを選択できます。 平均化期間 を適用し、 乗数

The latest most requested Binary Options arrow indicator in the Garuda Signals product line is now on MT5! Binary options signal based on multiple time frame cross over analysis. Gets confirmation from the most consistent signals known to man; Ichimoku, SMA, Bollinger Bands; and also uses the 1 Hour time frame as trend confirmation , so you don't have to open up multiple chart and waste time. - Can be used for all time frames up to 1 hour, but is most POWERFUL for 1 and 5 min options. - Place yo
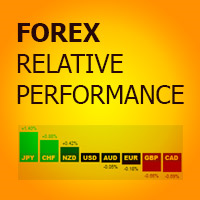
Forex Relative Performance indicator This indicator calculates the relative strength of major currencies against the US dollar. The basic idea behind this indicator is "to buy strong currency and to sell weak currency". This indicator allows you to quickly identify the best forex pair to trade according to your trading style (Intraday, Scalping, Swing, or Long Term)

The Profit30 for MT5 platform( Also Available for MT4 in Mql5 Market Place) Expert Adviser, uses 7 different 'price action style' system on the EURUSD pair, on the M5, M15, M30, H1 timeframes.Best optimized perform in H1 chart
The EURUSD pair offers in general the best performance in the major part of the Profit30 EAs. In this EA, a selection of Profit30 systems has been rewritten and configured explicitly for get the best performance in the EURUSD pair. The EURUSD pair offers in general the

価格範囲計算機 私の価格を信じて、信じて、信仰! Lekimdikator LiveでYouTubeのビデオを毎日フォローしてください! Lekimdikatorは、市場に出入りするための最高の価格を計算します お気に入りのインジケーターと組み合わせて使用! 証券取引所、外国為替、株式、ストックオプション、外国為替、投資ファンド、不動産ファンド、またはLekimdikatorでMetaTrader 5にアクセスできる市場で取引する方法を学ぶ それは初心者または経験豊富なトレーダーのためのツールであり、誰もが自分のアカウントを保護し、取引により多くの規律を得るためにそれを使用する必要があります Kakaku han'i keisanki watashi no kakaku o shinjite, shinjite, shinkō! Lekimdikator raibu de yūchūbu no bideo o mainichi forō shite kudasai! Lekimdikator wa, ichiba ni deiri suru tame no saikō no ka
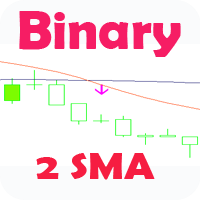
Стрелочный индикатор, выдающий сигнал при пересечении 2 SMA. Сигналы выдаются в виде стрелок и подходят для торговли бинарными опционами.
Входные параметры First period- период 1 MA Second period - период 2 MA Invert signals - Возможность давать инвертированные сигналы (для работы по тренду) Candles to count - количество свечей для подсчета статистики Expiration - время экспирации сигнала Length - расстояние для сигналов Особенности :
Возможность использовать инверсию сигналов Возможност

This long-term trading system works on 20 pairs and 1 timeframes. The Expert Advisor uses various trading systems, such as trend trading, countertrend trading and others. This increases the chances of sustained growth and reduces exposure to a single pair or individual operations. The risk is tightly controlled.
The EA has the built-in smart adaptive profit fixing filter. The robot has been optimized for each currency and timeframe simultaneously. It does not need arrival of every tick and hig
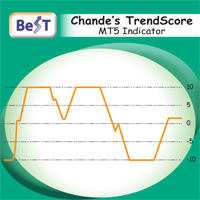
BeST_Chande TrendScore Indicator points the start of a trend with high degree of accuracy and it is amazing for scalping on the 1min timeframe. It is also a simple way to rate trend strength. It indicates both the direction and strength of a trend and can be easily combined with various trend-following, swing and scalping strategies.As of a trend’s direction and strength a value of +10 signals a strong uptrend while a value of -10 signals a strong downtrend. Generally a positive score shows an

Ultra Trend Hunter
Indicador encargado de seguir la tendencia de cualquier par de divisas, índice, materia prima, futuros, etc. Fácil de usar y muy intuitivo, te permite jugar con la mejor configuración para cada símbolo permitiendo con ello lograr excelentes entradas y salidas de cada operación de compra o venta. Su gráfica te permite identificar cuando entrar en una operación de compra/venta y te indica cuando salir de esa operación. Una vez que el indicador cambia de color, se debe esperar a
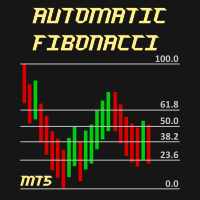
Automatic Fibonacci is an indicator for automatic Fibonacci Levels drawing. It is fully customizable by user. User can also select different Fibobonacci Levels by user settings or can use multiple Automatic Fibonacci indicator in one chart.
All details can be found >>HERE<<
Instructions Move Indicator to the chart (simply drag and drop) When pop up window appears select desired settings. Confirm settings and enjoy the Automatic Fibonacci indicator.
Features Any chart Any time-frame Custom
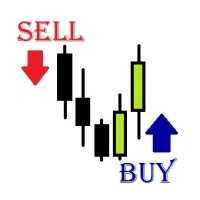
Oscillator trading signals - это динамический индикатор, определяющий состояние к продолжению тенденции роста или падению цены торгового инструмента и отсечению зон с нежелательной торговлей. Индикатор состоит из 2 линий осцилляторов. Медленная и быстрая сигнальная линия. Шкала отображения перевернутая. Зоны вблизи 0 свидетельствуют о тенденции роста цены валютной пары. Зоны -100 свидетельствуют о падении цены валютной пары. На основном графике в виде стрелок отображается потенциально выгодные
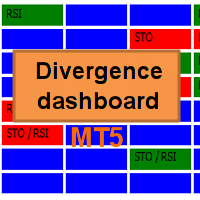
I recommend you to read the product's blog (manual) from start to end so that it is clear from the beginning what the indicactor offers. This multi time frame and multi symbol divergence dashboard indicator sends an alert when one or two different divergences have been identified. It can be used with all time frames from M1 to MN. Maximum 9 time frames can be shown in the dashboard at the same time. It is possible to enable moving average, RSI or Bollinger bands trend filter to filter out on
The algorithm of the adviser calculates zones of consolidation of the price and the most tentative variants of price movements.
Due to the unique method of determining candlestick patterns in the near past, a trade expert adapts to changing market conditions with minimal delay. This allows you to trust the adviser to work offline for quite a long time without the need for frequent monitoring.
The Expert Advisor was developed in the conditions of "floating" delay in the execution of trade order
EA STFX BINARY TECHNOLOGIES EA STFX Binary Technologies is specifically designed for Binary MT5 products Volatility Index 75 and 100 The Expert Advisor can be used for Full Automatic and Semi Automated trading. EA STFX has various strategies such as: Day Trade, Averagging , Martingale, Anti Martingale and or combine the two Trading positions can be closed easily using panels such as close profit only, close buy, close sell, close all transactions The choice of indicators for position entries us

Nightsnipermt5は、ナイトスキャルピングのための完全自動マルチ通貨取引システムです。 特徴 EAは28の主要なメジャーと十字架、金、銀で取引します。 顧問は危険な技術を使用しません Expert Advisorは、理解のために利用可能な入力パラメータの最小数を使用します アドバイザーは、ブローカーからのすべての注文に対して、固定および非表示のストップロスとテイク利益を設定します EAは、その注文を識別するために魔法の数の魔法を使用しています 推奨事項 狭いスプレッドと注文の迅速な実行を持つ任意のブローカーは、取引に適しています 最低推奨預金は1 100です チャートにExpert Advisorをインストールするだけで十分です パラメータ Magic-マジックナンバー ロット-注文数量 TradeMode-現在のチャート上のみ、またはすべてのシンボルの単一のチャートからの取引モード Symbols-このリストからのすべてのシンボルのシングルチャートモードでの取引のためのシンボルのリスト
Expert Advisorはスプレッドと実行速度に敏感であるため、エキスパートが

This indicator works in Brazil market, it should be used on options symbols. the indicator create 8 buffers, Delta, Gamma, Vega, Rho, Theta, Time(working days), Implied Volatility, R (interest rate), and can be used to view greeks over time. It shouldn't be used to trade, since it's cpu intensive, it's just a historic viewer, you can see what happened with greeks and teach friends :)

この指標は、2つの修正されたLanczosフィルタの組み合わせです。 最初のフィルターは、価格を推定するのに役立ちます。過去の値に基づいて、彼は現在のバー内で起こりうる価格変動を予測します。つまり、過去の傾向が変わらない場合の価格はどうなるかを示しています。 ウィンドウ内の価格を平滑化および平均化するための2番目のフィルタ。フィルタのレベルによって決まります。ウェイトの選択のおかげで、このフィルタは価格変動の中にある周期成分に最も積極的に反応します。 指標は EF および IF パラメータを使用して調整できます。 EF と IF の値を選択することで、トレンド価格変動の始まりに関するシグナルを得ることができます。 EF - 指数フィルタのウィンドウサイズ。有効な値は EF = 0 ... 255 です。計算中に処理された小節の数は 2 * EF + 1 です。このパラメータが大きいほど、価格系列の過去の値の影響が強くなります。結果は実線でプロットされています。 IF - 平均化ウィンドウのサイズを調整します。 IF = 0 ... 255 の値計算されるバーの数は 2 *

EA Undead is fully automated bot to generate a stable profit from the volatile FOREX market. This EA will never depend on any indicator.
How this EA works? At the very first it will open a Buy order and Sell Order at same time. And by default take profit will be 15 Pips for all orders. Once take profit reaches it will Re-Open that order. If the market goes against any order than it will add more positions, by default 50 Pips away from last open trade. To minimize the draw-down and loss and to b
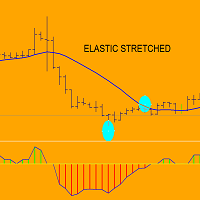
Think to an elastic: when you stretched it and then you release…it returns to its state of rest.
ELASTIC STRETCHED indicator display in real time distance of any bar:when price is above sma,indicator diplay distance in pips of HIGH from sma....when price is below sma,indicator display distance in pips of LOW from sma.
When price goes far from its sma during (for example) downtrend ,can happen two things: A) price returns to sma (reaction) and goes up OR B) price goes in trading range....but in a

この指標は、中央値プロパティと移動平均プロパティの組み合わせに基づくシーケンシャルハイブリッドフィルターです。
中央値を使用すると、異常値と価格系列の値のランダムなインパルスを除外できます。同時に、メディアンフィルタは価格変動のトレンドに影響を与えず、それを変更しません。 メディアンフィルタは非線形なので、単純移動平均を使用した平均化を使用してその値を平滑化します。このアプローチにより、トレンドだけでなく、価格変動の周期的な要素もより正確に特定できます。さらに、それは価格の変化に対するインディケータの感度を高め、そしてプライスシリーズとインディケータの読みの間の遅れを減らします。これにより、指標は新しいトレンドの始まりと FL パラメーターを使用して、フィルタ古いトレンドの終わりについてかなり正確に警告することができます。 ーの深さと感度を調整できます。許容値は0から63です。同時に、 2 * FL + 1 バーを使用して指標値を計算します。したがって、FLの値が大きいほど、価格チャートの傾向が強く表示されます。
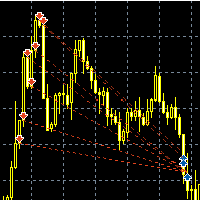
Модификация известного советника " Survivor " с гибкими настройками и возможностью оптимизации. Время работы : круглосуточно(настраивается) Рекомендованная валютная пара : USDJPY, AUDUSD, GBPJPY, EURCHF Рекомендованный таймфрейм : М5, М15 Описание : Трендовый советник с возможностью мартингейла и построением сетки ордеров. В советнике используются три группы аналогичных сигналов для открытия, закрытия и дополнительных сделок. При наличии тренда(определяется МА) ловится отскок в сторону движени

FOREX Alligator Robot EA ALLIGATOR was developed to achieve specific and highly accurate goals, which is key to guaranteeing significant returns in the world Forex market, works only in the EURUSD currency pair, and only in the time frame 15m It runs in the year 2016 onwards only. Be a predator in the most hostile market in the world. IMPORTANT - - Outside of this scenario it breaks your account.
HOW IT WORKS Our team has taken care to optimize your Forex market experience to the maximum, cre

This cluster indicator is MT5 version of SuperIndices for MT4. It allows for processing mixed clusters, where symbols from various markets can be included. For example, it can handle Forex, indices, CFDs, spot at the same time. Number of visible lines increased to 16. An interactive ruler can be enabled to measure signals' strength on the history. The indicator creates a set of embedded cluster indicators (CCFpExtraIndices) with carefully selected periods and combines their results using smart w

IRB Scalper Original The Original version of IRB Scalper Pro (V3.0) The strategy: EA strategy is inspired from a profitable strategy of Mr Rob Hoffman (One of the best traders in the world with multiple prizes on manual trading) . 1.Entry: The EA search for IRB bars (Inventory retracement bar), and place sell pending order or buy pending order according to the trend confirmed by the calculation of a 20 EMA slope degree. We believe that most of IRB Bar are caused by huge institutions (Hedge funds

For those who trade on the news...
At the appointed time, the EA places stop orders BuyStop and SellStop. The distance of placing orders from the current market prices is customizable. If after a specified time (timer) no orders are triggered, the EA will modify them. Move them back to the right distance from the market. When one order is triggered, the other is deleted. If no order is triggered within the specified period of time, both orders are deleted. For an open position it is possible to

TradeLeader PD - Pontos Decisivos
O indicador TradeLeader PD completa seu trade system com as informações realmente relevantes.
No painel você verá diversas informações consolidadas e sua relação com o preço. Compare os fluxos de compras e vendas(agressão), delta e muito mais.
Veja abaixo o que somente o TradeLeader PD pode oferecer em um só indicador, elevando o Metatrader a outras plataformas profissionais especializadas.
Painel Variação em porcentagem e ícone. Livro de ofertas: Resistênci
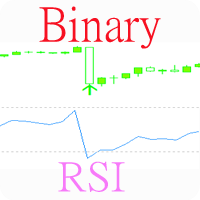
Индикатор, показывающий моменты пересечения важных уровней индикатора RSI. Может быть использован для поиска моментов пересечения уровней для успешной торговли на отскок или по тренду. Подходит для бинарной торговли, т.к. имеется возможность посчитать точность сигналов, в зависимости от времени экспирации.
Входные параметры Inform about finding the signal - параметр, отвечающий за получение уведомлений (Alert) о найденном сигнале. По умолчанию - да Show Panel - Показать/ скрыть панель Period o
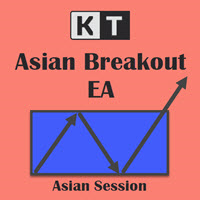
KT Asian Breakout carefully analyzes the range-bound market during the Asian session and then fires a long or short trade after doing some preassessment based on its inbuilt technical analysis module.
The executed orders are closed within a day before the completion of the next day session. The inbuilt technical analysis module checks for the session range and compares it with the last 20 days price movement. If it finds any erratic price movement within the session, the orders are not executed
This indicator implements the well-known trend trading strategy for Stochastic, with two levels for purchases (40 and 80) and two levels for sales (60 and 20). When an upward movement begins, the oversold level rises, from 20 to 40. When there is a downward movement, the overbought level goes down, from 80 to 60. Thus, the strategy has 4 levels. Obviously, tracking signals using the usual 4-level Stochastic is not very convenient, therefore, this indicator illuminates the inputs and outputs with

This is not an aggressive, high yielding EA but targets between 100% - 200% annually so as to keep drawdown as low as possible. However, to increase target, you may increase MM until you get desired result. EA default setting is recommended for H1 timeframe of GBPUSD but can be optimized for other pairs and timeframes as well. PARAMETERS: 1. UseFixedLot: By default, this is set to false, meaning you are using growing lots based on available capital and MM setting. If you prefer to use fixed lo

The utility displays the order book, as well as increases its depth, remembering the location of applications that have gone beyond the current "window" view. With the utility user can perform quick trading actions in one click - placing/cancelling/editing of explicit and hidden orders, and also opening/editing positions.
Utility features The orders book display works only on those trading symbols for which it is broadcast by the broker. To reset the information about the rows that were recorde
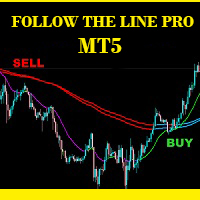
Follow The Line PRO FOLLOW THE LINE (PRO VERSION) This powerful indicator is the full and complete version of my free indicator called "Follow The Line". IT IS BASED ON the popular maxim that: "THE TREND IS YOUR FRIEND" It gives alarms and alerts of all kinds. IT DOES NOT REPAINT and can be used for all currency pairs and timeframes.
AVOID FALSE SIGNALS:
BUY ONLY when price closes above the green line and the green line is above the blue channel.
SELL ONLY when price closes below the pink li
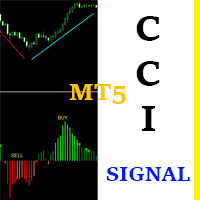
CCI Signal This indicator is based on a custom CCI that is colored to reflect the trend. It was created with the idea in mind: "THE TREND IS YOUR FRIEND". It is simple and easy to use. Even a newbie can understand and use it to achieve great trade results. Simply follow the colors. RED means SELL. GREEN means BUY. It DOES NOT repaint and can be used for Scalping, Day Trading and Swing Trading. It can be used for any time-frame and any currency pair. CCI Signal is highly reliable and provides p
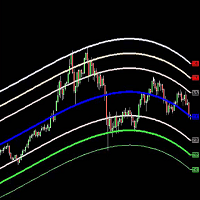
The Belkhayate center of gravity indicator is best used to confirm major turning points, and distinguish price extremes. Generally if price reaches the upper or lower levels one should expect a turn around coming soon, or at least a pull back towards the centre line if there is a strong trend. The upper and lower levels are red and green lines.
Our indicator use the same parameters as the well known trader M.Mostafa Belkhayate the inventor of the indicator, allow the use of buffers for your EA a
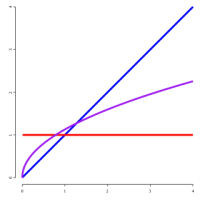
From https://en.wikipedia.org/wiki/Fractional_calculus:
Fractional calculus is a branch of mathematical analysis that studies the several different possibilities of defining real number powers or complex number powers of the differentiation operator D
This indicator execute fracional differentiation on data, you can select the differentiation D value and execute some tweaks like execute Log(value) before difefrentiation or execute a window normalization on last [diffNormalizeWindow]
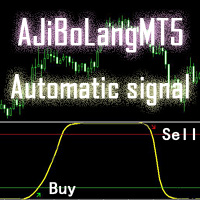
このAJiBoLang指標は、信号のすべてのサイクルに適しており、短期の信号に非常に適しています。信号の精度は良好です。
チャート上の矢印を見て、シングル注文をすると、緑色の矢印が買いシングル、赤い矢印が売りシングルです。
買い注文をした後、黄色い線が上のレベルまで上がって一定の距離を移動したら、買い注文を売ることができます。
売りを1つにした後、黄色い線が下のレベルに移動して一定の距離を移動すると、売り注文を売りにできます。
黄色い線が真ん中にあり、まだ注文をしていない場合は、黄色い線が折り返されていれば、買い注文をすることができ、この注文の精度は高くなります。
黄色い線が真ん中にあり、まだ注文をしていない場合は、黄色い線が折り返されていると、売りシングルを実行でき、この注文の精度は高くなります。
パラメータの説明
[alert_NO_OFF]:これはアラームスイッチで、trueに設定すると、矢印が表示されていれば自動的にプロンプトに警告し、falseに設定していれば警告しません。
[sendmail_NO_OFF]:これはメールを送信するためのスイッチで、tru

Multicurrency and multitimeframe modification of the Commodity Channel Index (CCI) indicator. You can specify any desired currencies and timeframes in the parameters. Also, the panel can send notifications when crossing overbought and oversold levels. By clicking on a cell with a period, this symbol and period will be opened. This is MTF Scanner. The key to hide the dashboard from the chart is "D" by default.
Parameters CCI Period — averaging period.
CCI Applied price — price type.
Clear th

This is a non-trading expert which transforms unstructured web-pages into structured data tables. It downloads and parses an HTML file, then creates DOM ( Document Object Model ) for it, and finally applies specified CSS ( Cascading Style Sheets ) selectors for required fields and extracts data for them. You may consider it as a powerful and highly customizable HTML to CSV ( Comma-Separated Values ) converter. The EA can process web-pages from remote sites (using MetaTrader's WebRequest ) or loc

Gamma Bands This indcator shows the trend with the color histogram. It is simple and easy to use. Usage: If the histogram changes from the aqua to the fuchsia, which means the trend is up. If the histogram changes from the fuchsia to the aqua,which means the trend is down. Inputs: MaPeriods: the periods of moving average. f1: the multiplier of inner bands f2: the multiplier of outer bands Popup Window Alert Email Alert Mobile Push Alert Alerts When the trend changes for the long trend to the
Time Adjusted ATR The Time Adjusted ATR indicator is used to determine the anomalous volatility for exactly specified time of day. The indicator is useful for early identification of reversals, breakthroughs and considering volatility corrections. Options • ATR period: the number of bars of the standard ATR indicator for which the averaging is taken (recommended value = 1). • Normalized Base: how many days (bars) are used to calculate normalization (recommended value = 10 ~ 50). How is "Time

According to trading experience: Some symbols are easy to reverse on certain days, such as Monday, or afternoon, and so on. So comparing the current price with the corresponding historical moment price is valuable. If the price coordinate system uses a logarithmic price, you will get a lot of valuable information. 1. What is this?
This program can convert the symbol price and add it to your Chart. You can compare it with your major chart. The DEMO version Link: https://www.mql5.com/en/market/pr
このEAは、平均化を使用して負けトレードを勝者に変えます。最初の取引がマイナスの領域に移行すると、回復メカニズムが作動し、一定の価格間隔で同じ方向に連続した市場注文を出します。このメカニズムはNFA / FIFOルールと互換性があり、米国のブローカーに受け入れられています。 [ ユーザーガイド | インストールガイド | 更新ガイド | トラブルシューティング | よくある質問 | すべての製品 ]
特徴
チャートボタンを使用して簡単に取引 完全にカスタマイズ可能な位置管理 制御および事前計算されたリスクエクスポージャー 多くの自動入力戦略を実装します カスタム指標を使用して取引できます
1000ドルからマイクロアカウントを取引 外国為替セッションによる取引のフィルタリング
平均化プロセスは完全にカスタマイズ可能で、取引のブロックごとに間隔とロットサイズを増やすことができます。
始める方法 EAを任意のチャートとタイムフレームにロードします リスクが許容されるまで設定を編集します チャートボタンを使用して取引するか、エントリ戦略を有効にします EAに取引を処理させて利益を予約
このEAは、独自の不均衡なヘッジ戦略を使用して、負け取引を勝者に変えます。最初の取引が事前定義された数のピップで負の領域に移動すると、回復メカニズムが作動します。限られた量の代替取引を現在の価格の上下に配置し、それらがすべて小さな純利益で閉じることができるようにします。 [ ユーザーガイド | インストールガイド | 更新ガイド | トラブルシューティング | よくある質問 | すべての製品 ]
特徴
使いやすく、監督
チャートボタンを使用して簡単に取引 完全にカスタマイズ可能な位置管理 制御および事前計算されたリスクエクスポージャー 多くの自動入力戦略を実装します 1,000ドルからのマイクロアカウントの取引 外国為替セッションによる取引のフィルタリング
始める方法 EAを任意のチャートとタイムフレームにロードします リスクが許容されるまで設定を編集します チャートボタンを使用した取引またはエントリ戦略の有効化
EAを機能させて利益を予約しましょう 繰り返す! 市場が長期にわたって横ばいの場合、少数のケースでは回復は失敗します。失敗すると、計算上の損失が発生します。
使い方

Automated Expert Advisor developed for forex trading. - Expert Advisor is suitable for all types of accounts and any type of spread.
- The number of decimal places in quotes is determined automatically.
- Timeframe of the chart does not matter. You can use any. Work timeframe is defined in the settings.
- The EA always uses Take Profit and thus it is less sensitive to the speed of the broker.
- The EA has two built-in types of trailing stop. Any of them can be used.
- The EA features a spread co

One click to close all (OCCA) provides you posibility to close all open position with one click.
Here is no any settings, just run the script and all your open positions will be closed and it will happen very fast !
Works with all types of accounts, with all currency pairs and any broker. The number of open positions is not limited.
The script will be useful for trading strategies, in which you need to manage a large number of positions.

It's a self-learning indicator. You need to set a starting time and download the relevant historical data for it to learn. Learn as few rules as possible and give the maximum freedom to the indicators. Therefore, the principle of choosing the best outcome during the learning period does not guarantee that every transaction is profitable. In general, the longer the study, the more reliable the results. In the strategy tester, you need to set the time parameter before the test starts so that the i

Do you think it's a bit cumbersome when you need to switch symbols or timeframes with mouse click? 1. What is this? This is a program that can switch symbols and timeframes with direction keys. Fast switching, very convenient, no mouse click required. For traders, one symbol with multi-timeframe charts are usually added, you can change symbol on those charts easily . For multi-currency traders, different symbol charts are usually added, you can also change those timeframes easily. I wrote thi

The principle of this indicator is very simple: detecting the trend with Moving Average, then monitoring the return point of graph by using the crossing of Stochastic Oscillator and finally predicting BUY and SELL signal with arrows, alerts and notifications. The parameters are fixed and automatically calculated on each time frame. Example: If you install indicator on EURUSD, timeframe M5: the indicator will detect the main trend with the Moving Average on this timeframe (for example the Moving

The Wolfalizer Indicator combines the functionality of the Engulfing Stochastic along with the ConsecutiveRSI and adds alerts along with more detailed output to the journal. This Indicator will alert you when RSI or Stochastics cross into oversold or overbought. You can set the oversold and overbought levels for RSI and Stochastics separately. You can pick if you want an engulfing candle to appear on the cross or set a number of consecutive candles you would like to see. Interesting Inputs inc

Very useful information (VUI) - provides useful information on the following points:
Pip price - the price of point (pip) in the currency of the account with the volume specified by you Tick size - tick size Margin Buy - margin required to open a Buy order with the volume specified by you Margin Sell - margin required to open a Sell order with the volume specified by you Open Buy - the number of open positions, the number of open lots Buy Open Sell - the number of open

It is an indicator that works with oscillations based on golden proportions. Through this indicator it is possible to operate using the proportions of the number of gold to elaborate strategies with the golden ratio. In this way, it is possible to make market analyzes respecting the proportions of Fibonacci. How to use: The closer the lines are to each other, the greater the possibility of retraction or inversion of the movement, the same is true for the distance of the lines. Nearby lines, sug
Бинарный индикатор находит свечной паттерн "Поглощение" и рисует соответствующий сигнал для входа рынок. Имеет встроенные фильтры и панель для просчета количества успешных сделок.
Особенности Работает для всех валютных пар и любых таймфреймов. Индикатор рассматривает комбинацию из 2-х или 3-х свечей в зависимости от настроек. Имеется возможность фильтровать сигналы путем настройки количества свечей одного цвета (тренда) до образования паттерна. Присутствует панель для отображения точности си
I recommend you to read the product's blog (manual) from start to end so that it is clear from the beginning what the indicactor offers. This multi time frame and multi symbol trend indicator sends an alert when a strong trend or trend reversal has been identified. It can do so by selecting to build up the dashboard using Moving average (single or double (both MA:s aligned and price above/below both)), RSI, Bollinger bands, ADX, Composite index (Constance M. Brown), Awesome (Bill Williams),

EU_Savings_Box (MT5 Expert Advisor)
This is 100% Algo Forex Trading Robot and is programmed for Long Term Investment with Low Risk. It uses no martingale, no grid, no scalping. The strategy combines 3 reliable and properly filtered indicators and price action to determine safe market entry and exit levels. This strategy has over 70% winning rate within 18 year plus. It is recommended for those looking for EA that can be trusted for many years. Moreover, you can adapt this EA to your preferred t

Close Assistant (CA) is a full featured utility for monitoring and closing a set of positions placed by trader or EA. It closes filtered orders in specified time or level or candle patterns or when a certain profit or loss of the total positions is reached. CA uses Zero Profit Lock function to save deposit when total profit falls to zero. Profit and loss levels can be set in fixed amount of account currency or percentage of balance or equity or margin. CA only monitors and works on filtered pos
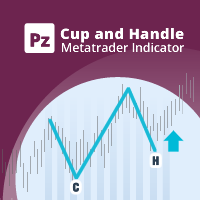
カップとハンドルのパターンは、カップとハンドルに似た技術的な価格構成です。カップは「U」字型で、ハンドルにはわずかに下向きのドリフトがあります。パターンの右側-ハンドル-は左側-cup-より小さく、上から50%以内に戻ります。継続パターンと反転パターンの両方があります。 [ インストールガイド | 更新ガイド | トラブルシューティング | よくある質問 | すべての製品 ] クリアな取引シグナル カスタマイズ可能な色とサイズ パフォーマンス統計を実装します カスタマイズ可能なサイズとパターン特性 適切なストップロスおよび利益レベルを表示します
再描画および非再描画ではありません 電子メール/音声/視覚アラートを実装します
入力パラメータ
振幅:振幅は、代替価格ポイント間のバーの最小量を表します。大きなパターンを見つけるには、振幅パラメーターを大きくします。小さなパターンを見つけるには、振幅パラメーターを小さくします。 カップの平坦度比:このパラメーターは、カップの上部がカップのサイズに対してどの程度「平坦」でなければならないかを示します。値を大きくすると、パターンはより厳密になりま

Blue Marlin Bollinger Bands Breakout This EA has built-in Bollinger Bands indicators to check the trends by breakout before performing any trading action. It's engine is provided with: trailing Stop Loss; bad time to trade filter for each day of the week; define in minutes the profitable orders duration; enable and disable martingale mode; define the maximum spread value to trade; define the minimum equity percentage to allow trading; the input values are already optimized for EURUSD at timefr

The revolutionary automatic adviser of the new generation with three parameters:
Target profit per month (from 10% to 100%) Degree of risk (SuperLow, Low, Medium, High) Stop Loss Limit, USD Set up to work on EURUSD timeframe M15. Works on HEDGING accounts with a leverage of 1:500 and a Deposit from 500USD. Enough for work:
Decide on the size of the deposit that you can trust him
Set the value of the desired profit per month (from 10 to 100 percent) Select the degree of risk (Low, Medium,

An indicator for finding patterns of candles. Through this indicator it is possible to recognize several patterns of candlesticks: hammer, inverted hammer, doji, maximum swallow, minimum swallow and inside bar. The patterns can be found by modifying the values of the indicator parameters. In this way it becomes possible to recognize an infinity of patterns.
How to use: Add the indicator to the chart.
Parameters: [doji -> max body size] represents the maximum body size of the doji (difference b

ACB ブレイクアウト取引を自動化 ACB Breakout Arrows EA は、適用したチャート上のブレイクアウトシグナルを評価し、内蔵された ACB Breakout Arrows と ACB Trade Filter のロジックで取引を管理します。監視したい銘柄と時間足のチャートに EA を適用し、自動売買を許可してから、テスト計画に合うポジション、セッション、フィルター、決済ルールを選択します。 必要なインジケーターと構成要素は EA に組み込まれているため、別途ダウンロードする必要はありません。インジケーターのパネルはチャートに表示されません。EA は自身の取引動作を表示し、Logging を有効にすると運用情報をプラットフォームの Journal に記録します。 取引開始前にエントリーを確認 Signal Sensitivity は、矢印ロジックがシグナルを受け入れるために必要なブレイクアウトの強さを調整します。Bars for SL は、ストップロス方法がインジケーターの水準を使う場合に参照するバー数を調整します。 ACB Trade Filter を有効にすると、E

I see that many tools in the market deal with Position and Order in the form of operation panels. Which is loaded into a Chart in the form of an EA. However, once the operator panel EA is loaded, no other EAs can be loaded. So, I wrote the one-click operation of Position and Order as a script, so you can load other EAs and easily complete one-click operation of Trade. 1. What is this: This is a one-click script to close position order. Now you can close position tickets at high speed, for examp

I see that many tools in the market deal with Position and Order in the form of operation panels. Which is loaded into a Chart in the form of an EA. However, once the operator panel EA is loaded, no other EAs can be loaded. So, I wrote the one-click operation of Position and Order as a script, so you can load other EAs and easily complete one-click operation of Trade. 1. What is this: This is a one-click script to delete the pending order . Now you can delete pending tickets at high speed, for

A robot that real-time supervise your open position and close it once the price level touches (or is close to touch) a previously selected trendline. You don't have to constantly watch your open position and wait for the proper time to close it. It automatically does this entire process and gives you time to spot new market opportunities. It can be attached to multiple charts and assist multiple open positions at the same time. Setup steps
D raw a trendline on chart (using your mouse) Allow
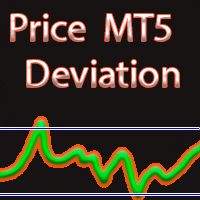
MAからの価格偏差
別ウィンドウの区分には、移動平均の指定値(移動平均)からの価格偏差(%)の値が表示されます。
ポジションの確定と新規ポジションのオープンの両方に使用できます。
入力パラメータ 移動平均を計算するための平均化期間。 平均化方法。 ENUM_MA_METHOD値のいずれかになります。 MODE_SMA - 単純平均 MODE_EMA - 指数平均 MODE_SMMA - 平滑化された平均化 MODE_LWMA - 線形加重平均 中古価格です。 ENUM_APPLIED_PRICE価格定数のいずれかになります。 PRICE_CLOSE - 終値 PRICE_OPEN - 始値 PRICE_HIGH - その期間の最大価格。 PRICE_LOW - 期間の最小価格 PRICE_MEDIAN - 中央値価格(高値+安値)/ 2 PRICE_TYPICAL - 典型的な価格、(高+安+終値)/ 3; PRICE_WEIGHTED - 加重平均価格、(最高+最低+終値+終値)/ 4。

This product can be used to synchronize multiple Charts, and each Chart can be set to a different sync mode. With this product you can better view and manipulate charts: different time frames for a single Symbol, the same time frame for multiple Symbols, system indicators for single/multiple Symbols... and more.
Feature: Chart settings can be synchronized, including : background, indentation, size, etc. Multiple Chart window start times or end times can be synchronized. Multiple Chart time fr

KT COG Robot is a fully automated Expert Advisor based on the KT COG Indicator . The COG indicator was originally presented by John F. Ehlers in the May 2002 edition of Technical Analysis of Stocks & Commodities magazine. The EA fires a long trade when COG line cross above the signal line and a short trade is fired when the COG line cross below the signal line.
Adaptive Filtration
Our adaptive filtration algorithm combines the original COG formula with the major trend direction and market ac

KTボラティリティオシレーターは、過去と現在の市場データを数学的な計算式で分析し、その結果をオシレーター形式で表示します。成長する波と減少する波は、それぞれ資産の高ボラティリティと低ボラティリティを示しています。 簡単に言えば、ボラティリティとは、一定期間内における資産価格の変動幅を測定する指標です。ボラティリティがなければ市場の動きは少なくなり、トレーダーは価格変動から利益を得ることができません。
外国為替市場におけるボラティリティの活用
外国為替市場でボラティリティを活用することで、より効果的に取引ができ、現実的な期待値を持つことが可能になります。
高ボラティリティ
トレンドベースのシステムは、高いボラティリティ環境下では大きな値動きとトレンドの持続によって非常に効果的に機能します。 高ボラティリティの時に発生するブレイクアウトは、より多くのピップスを獲得できる可能性があります。 低ボラティリティ
平均回帰型のシステムは、市場が平均に回帰する傾向があるため、低ボラティリティ環境下で特に効果を発揮します。 チャネルベースのシステムは、低ボラティリティ期間中のレンジ相場でより高

KT Advance Ichimoku plot the arrows and provide alerts for the four trading strategies based on Ichimoku Kinko Hyo indicator. The generated signals can be filtered by other Ichimoku elements.
Four Strategies based on the Ichimoku Kinko Hyo
1.Tenkan-Kijun Cross Buy Arrow: When Tenkan-Sen cross above the Kijun-Sen. Sell Arrow: When Tenkan-Sen cross below the Kijun-Sen. 2.Kumo Cloud Breakout Buy Arrow: When price close above the Kumo cloud. Sell Arrow: When price close below the Kumo cloud. 3.C
MetaTraderマーケットが取引戦略とテクニカル指標を販売するための最適な場所である理由をご存じですか?宣伝もソフトウェア保護も必要なく、支払いのトラブルもないことです。これらはすべて、MetaTraderマーケットで提供されます。

取引の機会を逃しています。
- 無料取引アプリ
- 8千を超えるシグナルをコピー
- 金融ニュースで金融マーケットを探索