 MetaTrader 5
 エキスパート
 インディケータ
 ライブラリ
 ユーティリティ
 ウィジェット
 ルール
YouTubeにあるマーケットチュートリアルビデオをご覧ください
ロボットや指標を購入する
仮想ホスティングで
EAを実行
EAを実行
ロボットや指標を購入前にテストする
マーケットで収入を得る
販売のためにプロダクトをプレゼンテーションする方法
MetaTrader 5のためのエキスパートアドバイザーとインディケータ - 556
 自動売買ロボットとインジケータを使用して、外国為替取引の収益性を高めます。 自動売買ロボットを使用すると、取引の開始と終了を自動化でき、インジケータは市場の行動をより正確に予測するのに役立ちます。
このページには、MetaTrader5アプリケーションのカタログが掲載されています。
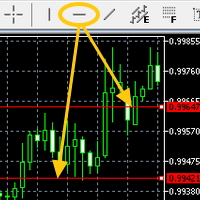
Attach the indicator on the chart and draw the red line from the button on MT5's built-in menu bar then the alert will be sent to you(push,email,popup and sound)
Hi You all know the red line (the MT5 built-in red line) drawn from the menu bar on MT5. It is often used to check the resistance etc.....It is very useful but it is little troublesome to get an alert(sound, push, email and popup) when the red line is touched by the price. Here is Price Touch Alert indication, just use the button to

The Expert Advisor opens orders at the points of possible price reversal using repeated entries (adding to a position). Parameters for repeated entries (volume, price and time) are set by the functions. Function equations are integrated into the EA. Only initial parameters and equation type should be selected for optimization.
Features By selecting different combinations of parameters and equations integrated into the EA, you can create its varieties that are quite different in their trading m

Yggdrasil is a fully automated hedging system . The EA opens orders in both direction on the chosen pairs by the user. Currency pairs aren't traded individually, all trades opened are part of the system. The algorithm will close the unprofitable orders with the available profit. It prevents drawdown to increase if a big trend occurs on a currency pair.
The EA is designed to be efficient with minimal settings . No need fine tuning parameters, it's a long term "set & forget" expert advisor.
As t
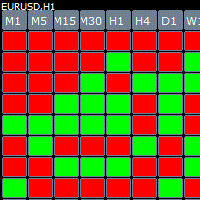
Cube indicator represents the original candle stick chart but in a top down cube form in order to see previous patterns in the markets more easy. The indicator has build in alert once there is a consecutive 3,4,5 bars in a row you get an message.
Parameters Bars_Limit = total visible cubes
TF_M1 = true; TF_M2 = false; TF_M3 = false; TF_M4 = false; TF_M5 = true; TF_M6 = false; TF_M10 = false; TF_M12 = false; TF_M15 = true; TF_M20 = false; TF_M30 = true; TF_H1 = true; TF_H2 = false; TF_H3 =
Advanced MACD is a safe and fully automated EA. This EA uses MACD indicator with double confirmation set and filtering by range of latest price movements. Every order has stop-loss and the EA has implemented advanced filtering functions together with spread and slippage protections. This EA does NOT use the dangerous strategies like Martingale, etc. Advanced MACD is NOT a tick scalper that produces high number of trades per day and it is NOT dependent on every point of price. This EA is
Candle Pattern Alert indicator alerts when the last price closed candle matches the set input parameters. You can choose to scan through all the symbols in Market Watch or enter your favorite symbols and also you can enter time frames you need to scan. ---------Main settings-------- Select all symbols from Market Watch? - if Yes the program scans through all the symbols displayed in Market Watch, if No - only selected in next input symbols are scanned
Enter symbols separated by commas - enter sy
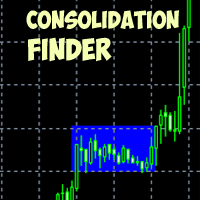
Consolidation Finder An indicator that allows you to find consolidation. To work on the breakdown of the channel. Easy to use, there are only three settings: Minimum number of bars to analyze Tunnel Consolidation Indicator color It works on all timeframes , by default, approximate settings for the H1 timeframe are set. Works on all currency pairs. The indicator is not redrawn or recalculated. All screenshots are real!

This EA has built-in trend acceleration indicator to check the trends before performing any trading action. It's engine is provided with: trailing Stop Loss; bad time to trade filter for each day of the week; enable and disable martingale mode; define the maximum spread value to trade; define the minimum equity percentage to allow trading; the input values are already optimized for EURUSD at timeframe M1. The Strategy This Expert Advisor uses built-in trend acceleration indicator where you can

This robot is designed for work on BORSA ISTANBUL Option Stock Market. You can earn good profit on F_XU030 and F_USDTRY pairs The Robot gets good performance on F_XU030 and F_USDTRY pairs and M15 period. Trading strategy is based price action trading model. Optimization results are profitable on test. So the risk of loss is very low. Robot earns good and stable money with swing trading model. This is the strategy of Market Maker. Robot opens an order, closes. Then opens a new order. Does not col

KT Round Numbers plots the round number levels which are also commonly known as psychological levels in the Forex world. In the context of Forex trading, round number levels are those levels in which there are two or more zeroes at the end. They are named as 00 levels on the chart.
Some traders also consider the halfway points as a valid round number level. They are named as 50 levels on the chart.
Use of round number levels in trading Round number levels work as strong support and resistance

Create your own trading expert without programming skills! It is easy and simple. This panel is a designer of Expert Advisors (like Wizard).
This Wizard contains: 57 signals (regularly add new) several Trailing Stop systems (including Trailing by Bollinger Bands)
How create EA easy: Choose 1 signal Choose no more than 3 filters Choose the Trailing system Save the ".set" file - by one button Ready. Run this expert with the desired set.
Interesting: "invisible" (virtual) levels StopLoss and T

Statistic Candles. Утилита для получения статистики с графика "Японские свечи".
Статистика собирается нижеописанными методами.
Выполняет следующие функции: Подсчёт свечей на 19-ти таймфреймах (внутридневные свечи): Количества бычьих и медвежьих свечей в указанном промежутке дат. Количества бычьих и медвежьих свечей в указанном промежутке дат в обозначенное время. Подсчёт количества нестандартных свечей (прим.: Custom _ time = 14:56, Period _ time = 1 H ). Данные средних значений open - close
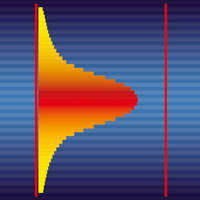
Вертикальная гистограмма объема - отображает распределение объема по уровням. Гистограмма рассчитывается от объема ( реального или тикового), при этом объем соответствующий бару переносится на уровень H-L бара.
Таким образом, при распределении объема за сутки по вертикали - формируются максимумы гистограммы показывающие области проторговки. Настройки индикатора: Timeframe Set - период в пределах которого производится расчет. (рекомендуется D1) Step's - количество отображаемых периодов. Amplitu

Bober Lannister MT5 - is fully automated trading robot. This robot exists more than 3 years and proved its work on a long term distance.
The thing is many of night scalpers on mql5 market place has been made by newbies without proper researches . Don't be fooled by beautiful tester pictures or short term results.
Why Bober Lannister MT5 better then other night scalpers on mql5 market?
-It trades in a wide range of night time 3-6 hours per day. (not just 1 hour catching swaps/high spread

KT MA Crossover は、選択した移動平均線のクロスに基づいて買いと売りの矢印をチャートに描画します。さらに、各シグナルに対して適切なアラートを生成し、MFE(最も有利な価格変動)も表示します。これにより、トレーダーは過去のシグナルのパフォーマンスをより深く理解できます。 移動平均のクロスオーバーは、世界中のトレーダーがよく使う基本的な戦略の1つです。一般的には、速い移動平均と遅い移動平均を組み合わせて、その交差の方向によって買いまたは売りのエントリーシグナルを判断します。 買いシグナル:速いMAが遅いMAを上から下にクロスしたとき。 売りシグナル:速いMAが遅いMAを下から上にクロスしたとき。
特徴 各移動平均の設定は完全にカスタマイズ可能です。 各シグナルに対して MFE の値を表示します。 軽量に設計され、動作が非常にスムーズです。 すべてのMetaTraderアラート機能に対応しています。
デメリット 移動平均は過去のデータに基づくため、遅行性のある指標です。特にレンジ相場では、移動平均のクロスがランダムに見える場合があり、多くのダマしシグナルを発生させる可能

平滑化された Heiken Ashi の状態を確認 KT Heiken Ashi Smoothed は、価格の動きを平滑化された青と赤のローソク足で表示します。弱気から強気へ変わると青の上向き矢印、強気から弱気へ変わると赤の下向き矢印を表示するため、チャート上の方向転換を簡単に確認できます。 平滑化期間と平滑化方法によって、ローソク足の平滑化の強さを調整できます。標準の Heiken Ashi より安定した見え方を提供しながら、チャートに合う反応を選べます。 青のローソク足: 強気の状態を示します。 赤のローソク足: 弱気の状態を示します。 青の上向き矢印: 弱気から強気への変化を示します。 赤の下向き矢印: 強気から弱気への変化を示します。 複数の時間足をひと目で比較 コンパクトな MTF Scanner は、M1 から Monthly までの各時間足について強気または弱気の状態を表示します。チャートを切り替えずに、現在のチャートと短期および長期の時間足を比較できます。 ローソク足の形状を読み取り表示を調整 下ヒゲのない青のローソク足 は強い上昇の動きに伴うことがあり、 上ヒゲのない

We present you a very reliable expert system. The expert system is based on the AC indicator. This indicator generates very reliable signals!
The AC indicator measures the speed of the market’s driving force by subtracting the slow moving average from the fast and then subtracting the fast moving average from this difference. This indicator, despite the present averaging model, can be classified as leading, since it measures precisely the driving force, which first slows down and then changes
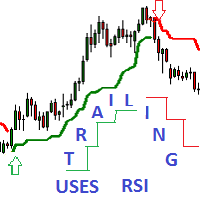
Adaptive Trailing uses RSI Indicator - an indicator of directional movement that allows you to determine the trend at the time of its inception and set the levels of a protective stop.
Trailing can be carried out both from below, when the stop level is below the current price and is pulled up behind the price if it increases, and above, when stop levels are above the current price.
There are two modes for calculating the stop level. Simple trailing is done with a constant distance of Npoints
Using this indicator, you can anticipate the future price behavior of a certain number of bars. The indicator draws a line showing simulated future price values. You can use this information both for entering / exiting the market. So for the installation / correction of stops accompanying the position.
The indicator has several parameters. HistoricBars - The number of historical bars to analyze. FutureBars - The number of bars to predict the price. Prediction - prediction depth coefficient.

Появилось желание торговать движение, пробой на самой высокой волатильности, или запустить советника-усреднителя торговать боковик в тихой низковолатильной гавани тогда этот продукт для Вас! Индикатор анализирует 28 валютных пар (основные и кроссы) и в зависимости от выбранных настроек покажет самые высоковолатильные (max) или наоборот (min). Как измерить волатильность? Существует 2 способа. Первый это измерить рендж заданного количества последних баров (bar). Второй замерить о

Navigators is a great tool for detecting peaks and valleys on a chart. This indicator uses a modified peak and trough detection algorithm. This algorithm includes the Fractals indicator and the ZigZag indicator.
This tool should be used to analyze peaks and valleys, as well as to detect patterns, or for other purposes. You can use this powerful tool for your own purposes at your own risk.

Apollo 3 route 66 It is an advanced trading system. This is a fully automatic Expert Advisor, which allows you to presize the trade according to the preferences of the trader. Apollo 3 route 66 have more customization options for your trade. Different options for different styles of trade. Apollo 3 route 66 is a break system of trade with different algorithm of trade mode. This EA using signals to place orders. Is a revolution in the customization of the trading. The algorithms develo
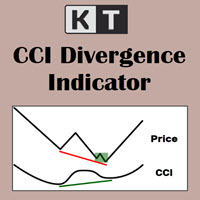
KT CCI Divergence shows the regular and hidden divergence created between the price and CCI oscillator. Divergence is one of the vital signals that depicts the upcoming price reversal in the market. Manually spotting the divergence between price and CCI can be a hectic and ambiguous task.
Limitations of KT CCI Divergence
Using the CCI divergence as a standalone entry signal can be risky. Every divergence can't be interpreted as a strong reversal signal. For better results, try to combine it w
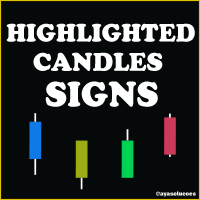
Indicator designed to give investors the advantage of identifying strong candlestick patterns in real time by staining candlesticks representing these patterns, using possible buy or sell performance. The color for each pattern identified by the parameter indicator according to your taste. The candlestick patterns identified by this indicator are: Inside Bar Closing Price Reverse Top (PFRA)
Closing Price Reverse Bottom (PFRB) Dave Landry Bullish Engulf Bearish Engulf Advantages: Real Time At eac

Best Scalper Oscillator は、価格チャートの数学的計算に基づいたMetaTrader 5のインジケーターです。これは、傾向反転点を見つけるための最も一般的で有用な指標の1つです。 Best Scalper Oscillator には複数の種類の通知(プッシュ通知、電子メール、アラート)が装備されており、時間内に取引を開始できます。
特徴的な機能 最小の偽信号を生成します。 トレンドの反転を識別するのに最適です。 スキャルピングに最適です。 短い時間枠(H4まで)での作業に適しています。 あらゆる金融商品で動作します。 インジケーターは再描画されません。
推奨シンボル EURGBP、USDCAD、EURCHF、USDCHF、AUDNZD、AUDCAD、GOLD。
使用に関する推奨事項 レベル20を超えると買いシグナルが形成されます。 レベル80を超えると売りシグナルが形成されます。
インジケータパラメータ 期間-アルゴリズムの計算に使用されるバーの数。 UpperLevel-インジケーターウィンドウに表示される上位レベル。このレベルを超えると、通知(モバイ
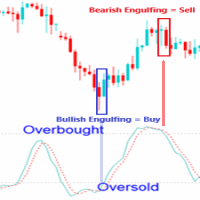
EXPERT ADVISOR DESCRIPTION
- Expert Advisor Engulfing in OBOS (Overbought Oversold) is an expert advisor consisting of a combined candle engulfing pattern and Stochastic Oscillator indicators. A Buy position occurs when engulfing are formed when the signal stochastic indicator is in the oversold area, A sell position occurs when engulfing are formed when the signal stochastic indicator is in the overbought area. - You can combine engulfing that form in certain timeframes with a signal stochast
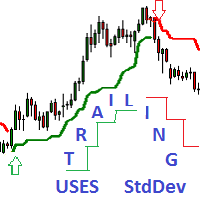
Trailing Uses Standard Deviation.
A daptive_Trailing_uses_StdDev_Indicator is an indicator of directional movement that allows you to identify a trend at the time of its inception and set the levels of a protective stop.
Unlike trailing with a constant distance, the indicator uses the distance to the price proportional to the current standard deviation of StdDev. The distance is equal to the product of the standard deviation and the constant coefficient set by the user.
Thus, the trailing

This is a multicurrency and multitimeframe indicator that calculates the angle between two points. Points for measuring the angle can be taken from the ZigZag (the last two points), or from the Moving Average (between two given bars), or it can be the closing prices of bars.
Angle measurement is possible in degrees or in radians. You can select the scale for the calculation. For a better understanding of the indicator, you can study the free Angle High Low indicator. In the parameters you can
This bot can classify ticks into classes from 0 to 64, after which after analyzing the tick micro-signals it determines which way to open a position. You can work with an expert only on real ticks how to optimize and test!
When working, an expert uses position accounting in any mode, both netting (there can be only one position for one symbol) and with independent position accounting or hedging (there can be many positions for one symbol).
Configurable bot parameters TypeFilling - Type of exe
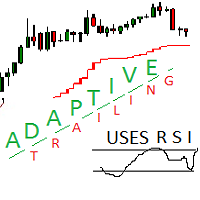
Adaptive trailing uses rsi
Adaptive trailing uses rsi - это скрипт, который реализует трейлинг, а именно: вычисляет уровень защитного стопа, отображает уровни на графике, исполняет заданные пользователем торговые операции при достижении ценой стоп уровня. Режимы работы. Трейлинг может осуществляться как снизу, когда уровень стопа ниже текущей цены и подтягивается за ценой, если она возрастает, так и сверху, когда уровни стопа выше текущей цены. Предусмотрено два режима расчета стоп уровня .

インジケータMTFクリスタリウム矢印は、半自動取引システムであります. これは、すべての通貨ペアで動作します。
インジケータは、三つのルールを使用しています:1)我々は唯一のトレンドで取引、2)"誰もが販売しているときに購入し、誰もが買うときに販売する"、3)価格
インジケータMTF矢印は、内蔵の指標を使用して、複数の時間枠全体のクリスタリウムフィルタルール。 トレンドは、選択した時間間隔で一致した場合、インジケータは、市場に参入するための矢印を与えます。 それからあなた自身の決定をする。 購入する-緑の矢印、売る-赤い矢印。 指標では、ロットを変更したり、EAの取引時間とシャットダウン時間を設定することができます。 また、作業期間と時間フィルタを変更することができます。 ビープ音が鳴ってる
推薦された働く期間D1。 フィルタH1とH4。
設定:
TF働く期間(推薦されたD1) Cci_cperiodcomment
CCIレベルアップ
CCIレベルDn CCI価格 SARステップ SAR最大値 TFのFilter1–(推薦されたH1) TFのFilter2
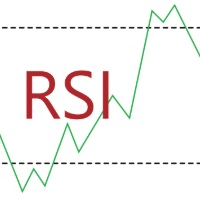
The Relative Strength Index (RSI), developed by J. Welles Wilder, is a momentum oscillator that measures the speed and change of price movements. The RSI oscillates between zero and 100. We have added to the reputable RSI indicator several types of alerts and a signal interval filter to be incorporated in your Expert Advisors. It works in ALL Timeframes ans instruments.
Product Features Email Alert Sound alert Push Notification (Alerts can be sent to your mobile phone) Signs on chart Alert b

This bot is based on the analysis of adaptive moving averages. The expert is characterized by stable signals, which can be used as accurate short-term signals. This is a semi-scalping system that analyzes the market using reliable indicators. Scalper is a system or not, depends on the parameters TakeProfit and StopLoss . Using this adviser, you need to understand that this bot requires optimization. The bot works both on netting accounts and on hedging accounts. But the settings must be optimiz

取引を決定する際には、履歴データだけでなく、現在の市場状況にも依存することが有用です。市場の動きの現在の傾向をより便利に監視するために、AIS Current Price Filterインジケーターを使用できます。 この指標は、ある方向または別の方向で最も重要な価格の変化のみを考慮します。これにより、近い将来の短期的な傾向を予測することが可能です。現在の市場状況がどのように発展したとしても、遅かれ早かれ現在の価格はこの指標を超えます。トレーダーの観点から最も興味深いのは、価格がインディケーターレベルから可能な限り移動した状況です。これらの瞬間は、新しい取引ポジションを開くために最も最適であることが判明する可能性があります。 インジケーターの動作は、選択した時間枠に依存せず、2つのパラメーターを使用して構成されます。 FS -感度のしきい値を設定できるパラメーター。値が大きいほど、価格の動きは強くなり、インディケータで考慮されます。その許容値は0から255の範囲にあります。ゼロの値が選択された場合、感度のしきい値は現在の広がりに等しくなります。 LB -インジケーターの計算に使用される
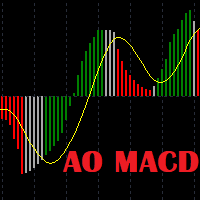
Awesome Oscillator Moving Average Convergence/Divergence Indicator. Not late as AO and not noisy as MACD. The basic version of the indicator is presented. The "PRO" version is under development with such features as sending signals to e-mail and plotting divergence and convergence lines on the chart.
Input parameters: Fast: short EMA Slow: long EMA Signal: signal line Colors: Red: MACD < Signal Green: MACD > Signal Gray: MACD above Signal, but lower than the previous MACD MACD below Signal, but

本旨。 まず第一に、これは異なる指標に適用される同じ戦略に基づいたEAファミリーの2番目です。 これは、スプレッドメインフィルタリングを使用した異なる指標に同じ戦略と同じ資金管理が適用されることを意味します。 最終目標は、可能な限り高い成功率を持ち、全体的な損失を最小限に抑えたEAを設計することです。 この特性は、長期的な満足のために、EAの使用に対する信頼を高めます。
戦略 1.スキャルピングモードの戦略 EAはインディケータに従って価格の指示に従い、TP1で利益を上げます。その後、プロセスが再起動します。 TP1がトリガーされず、インジケーターの方向が変わる場合、取引は保留され、反対の取引がTP2まで乗算器に応じて開かれますが、市場での取引数が乗算されます。 このステップは、利益が取引数X TP2に達するまで繰り返されます。
2.トレンドフォローモード戦略 EAはインディケーターに従って価格方向に従い、取引が利益を上げ、価格方向が逆転した場合のみ利益を得る。 その後、プロセスが再起動します。 価格方向の変更で取引に利益がない場合、取引は保留され、新しい価格方向が変更されるまで

Indicator SR levels true in small time frames is very useful for scalping while in bigger ones it is good for day or position trading.
SR levels true can draw 4 support/resistance levels based on defined maximum rebouds from price level. Indicator scans defined number of bars in time axis and defined number of pips in price axis (both sides - up and down) and calculates how much times price was rejected from scanned price levels. At the price levels where maximum rebounds are counted, support

持続可能な分布は、金融シリーズをスムーズにするために使用できます。かなり深い履歴を使用して分布パラメーターを計算できるため、場合によっては、このような平滑化は他の方法と比較してさらに効果的です。
図は、10年間のH1時間枠でのEUR-USD通貨ペアの始値の分布の例を示しています(図1)。魅力的ですね。
この指標の根底にある主な考え方は、価格の分散によって持続可能な分布のパラメーターを決定し、データを使用して金融シリーズを平滑化することです。このアプローチのおかげで、平滑化された値は、特定の市場状況で最も可能性の高い価格値になる傾向があります。
インジケータの動作は、パラメータLBを使用して設定されます。その値は、バーで表される平滑化されたシリーズの長さを決定します。また、許容値は1〜255の範囲です。
青い線は平滑化された高値を示し、赤線は安値を示し、緑の線は終値を示します。
このインジケーターの主な欠点は、インジケーターが履歴のすべての部分で等しく安定するように、スムージングウィンドウの幅を設定できないことです。したがって、トレーダーは特定の要件に合わせてパラメーターを選

Expert Advisor Raikow FX EA operates using the Vegas Tunel strategy, which consists of fibonacci levels above and below the 169 period moving average. It can operate on trend and counter trend.
It has margin control, open order limit, positive swap control and filter indicators like RSI and ADX. It also has dynamic and fixed take profit in the fibonacci levels and trailling stop levels. For more information visit our Telegram group https://t.me/RaikowFXEAEN

MTF顧問クリスタリウム平均はプログラマーアレクサンダー Gavrilinと一緒に作成されました。 このシステムは十分に自動化される。 マーチンゲールじゃない ここで働くの平均。
これは、すべての通貨ペアで動作します。
EAは、三つのルールを使用しています:1)私たちは、トレンドにのみ取引、2)"誰もが販売しているときに購入し、誰もが買うときに販売する"、3)価格は常に
MTFのQristaliumの平均は作り付けの表示器を使用して多数の時間枠のこれらの規則をろ過する。 市場と傾向は経済的および政治的ニュースの影響を受けているので、EAは設定SL(私は100をお勧めします)で無効にして有効にすることができる平均 EAでは、ロットを変更することができます,テイク利益の大きさを設定します(TPは損益分岐点から計算されたとき-あなたはまた、設定に変更するこ また、作業期間と時間フィルタを変更することができます。
推薦された働く期間D1。 フィルタH1とH4。 100を平均するステップ。 預金1000$、ロット0.01
設定:
作業時間 修正ロット(推奨0.01/1

Basket trading /Basket SL TP Automatic SL TP Calculation
This utility will calculate SL and TP based on 2 input parameters
PerUnitTP -This means what is per .01 TP like 1 $ per .01 Lot. SLToTP_Ratio-This what is ration SL to TP if this parameter is 3 that means if TP is 1 $ then SL will be 2$ (per .01 Lot)
so if total portfolio summing to .05 lot that that means TP will be automatically become 5 $ and SL become 10 $.
This is very good utility when you want set SL TP for many open trade

Basket trading /Basket SL TP/Portfolio SL TP/ Group Trade SL TP
This is very good utility when you want set SL TP for many open trades or portfolio
As soon your account equity reach SL or TP , This EA will close all trades . you are allowed to change SL and TP any time.
Also you need not to monitor group trades all the time you just set SL and TP in utility and relax once SL / TP situation will come all trades will be closed automatically.
SL and TP are in $Amount like 100$ SL and 500$ TP

Moon 3 is a Trend indicator. I s a powerful indicator of TREND for any par and any timeframe. It doesn't requires any additional indicators for the trading setup.The indicator gives clear signals about opening and closing trades.This Indicator is a unique, high quality and affordable trading tool.
Perfect For New Traders And Expert Traders Low risk entries. Never repaints signal. Never backpaints signal. Never recalculates signal. For MT5 Only Great For Scalping Great For Swing Trading Arrow

Trailing Stop Fast Trailing Stop Fast EA locks trade profit once trade moves in profit by certain points(eg 100 points) by moving the Stop Loss in direction of trade.
There are three inputs in EA to be provided by user to EA TrailingStart this input used as activator when trade moved 100 points towards profit, this EA will start shifting your stop loss towards profit.
TrailingStop input defines what should be the distance of stop loss from current market price once TrailingStart activated

This indicator will show a vertical representation of the volume distribution within a selected user range. For a free demo version go to https://www.mql5.com/en/market/product/42482 . Main features: This Indicator will create an image that will allow viewing the tick volume per price level in a graphical form. The indicator will work on any range size in any time-frame, limited only by your computer memory and performance. Recommended time-frames are: M1 to H1.
Inputs:
Price Calculated - s

KT Bollinger Bands Trader は、ボリンジャーバンドを使った平均回帰戦略に基づき、低ボラティリティ期間中に自動で取引を行う 100% 自動化されたエキスパートアドバイザー(EA)です。価格はボリンジャーバンドの上部または下部ラインに反応することが多いですが、必ずしも反転するとは限りません。ただし、低ボラティリティの時期には反転の可能性が高くなります。
エントリー条件 価格がボリンジャーバンドの下部ラインを正しく下回ると、買い注文が発動されます。 価格がボリンジャーバンドの上部ラインを正しく上回ると、売り注文が発動されます。 エグジット条件 低ボラティリティ期間の終了時にポジションをクローズします。 ストップロスまたはテイクプロフィット到達時にも決済されます。 このEAは、人気のあるボリンジャーバンド戦略に多くの改良を加えたもので、トレンドフィルター、ボラティリティフィルター、Vortex、MMI、曜日別フィルターなどの組み込みフィルターを使用して戦略を細かく調整できます。
入力パラメーター
----- ストラテジー設定 ----- ボリンジャーバンドの期間、シ

The Willing horse Expert Advisor EURUSD trades on the signals of the Moving Average, Stochastic Oscillator, Average True Range indicators; uses a variety of intelligent strategies, without martingale, hedging or grid; applies stop loss to protect your capital; there is a capital management system, it has restrictions on the volume of trading positions (in% of the deposit). This advisor does not require adjustment, just attach it to the M1-chart of EURUSD. You can test any period from 01/01/2018.
SEMA is the Sextuple Exponential Moving Average:
SEMA = PEMA + QEMA(y - PEMA)
The principle of its calculation is similar to Double Exponential Moving Average (DEMA). The name "Sextuple Exponential Moving Average" does not very correctly reflect its algorithm. This is a unique blend of the single, double, triple, quadruple and pentuple exponential smoothing average providing the smaller lag than each of them separately. SEMA can be used instead of traditional moving averages. It can be used

本旨。 まず第一に、これは異なる指標に適用される同じ戦略に基づいたEAファミリーの2番目です。 これは、スプレッドメインフィルタリングを使用した異なる指標に同じ戦略と同じ資金管理が適用されることを意味します。 最終目標は、可能な限り高い成功率を持ち、全体的な損失を最小限に抑えたEAを設計することです。 この特性は、長期的な満足のために、EAの使用に対する信頼を高めます。
戦略 1.スキャルピングモードの戦略 EAはインディケータに従って価格の指示に従い、TP1で利益を上げます。その後、プロセスが再起動します。 TP1がトリガーされず、インジケーターの方向が変わる場合、取引は保留され、反対の取引がTP2まで乗算器に応じて開かれますが、市場での取引数が乗算されます。 このステップは、利益が取引数X TP2に達するまで繰り返されます。
2.トレンドフォローモード戦略 EAはインディケーターに従って価格方向に従い、取引が利益を上げ、価格方向が逆転した場合のみ利益を得る。 その後、プロセスが再起動します。 価格方向の変更で取引に利益がない場合、取引は保留され、新しい価格方向が変更されるまで
The system is based on signals from three indicators: Ichimoku Kinko Hyo indicator Stochastic Williams Fractals Each indicator works on its own timeframe. Note : input defaults are not optimized. Test the expert on a demo and configure the input parameters in accordance with the acceptable risk and goals.
INPUT PARAMETERS Magic Number
Every Tick (false - Every Bar)
Inputs for main signal: The threshold value of the signal to open [0...100]
The threshold value of the signal to close [0...100]
P

Signal: https://www.fxblue.com/users/nzdjpy_h1_e01_ddgrd Set file JJ_NZDJPY_H1_E01V01 for 1k account (adjust risk setting and backtest for other accounts) Legacy Update (7.0) Simplified Use : Set to default settings. Change trading mode to "use JJ_NZDJPY_H1_E01V01 strategies". Retired Features : "Use barcode files" and "create barcode files" options are retired. Single barcode scanning is still available and can be manually added in "compatibility mode". Multi Strategist (MS) Overview ( Manua
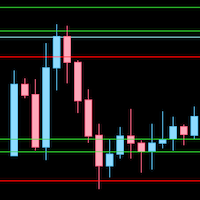
Draw levels of support and resistance based on highs/lows or closes from daily, weekly or monthly. This indicator uses the highs, lows or closes to draw horizontal lines on the graph. By observing those lines you can identify trend (gaining or losing levels of resistence/support) and find good levels where price can bounce. For those who trade price action, this is a very useful indicator.

この指標により、価格がいずれかのレベルに達する可能性を判断できます。そのアルゴリズムは非常に単純で、特定の通貨ペアの価格レベルに関する統計データの使用に基づいています。収集された履歴データのおかげで、現在のバーの間に価格が変化する範囲を決定することが可能です。 そのシンプルさにもかかわらず、この指標は取引において非常に貴重な支援を提供できます。そのため、トレーディングポジションのTakeProfitレベルとStopLossレベルを決定することができます。保留中の注文の価格の決定と、TrailingStopの価格レベルの決定の両方に役立ちます。 さらに、この指標は既存の戦略に統合できます。たとえば、ある種の日中戦略を使用します。次に、D1時間枠でこのインジケーターを設定することで、新しいトレーディングポジションを開くことは既に望ましくないことを克服した後、レベルを取得できます。 このインディケーターの主な欠点は、純粋に履歴データに依存しており、特定の現在の市場の変化にまったく反応しないことです。 このインディケーターの設定は、入力パラメーター-L1 ... L4-を選択することにより実

Apollo 2 The wall It is an advanced trading system. This is a fully automatic Expert Advisor, which allows you to presize the trade according to the preferences of the trader. Apollo 2 have more customization options for your trade. Different options for different styles of trade. Apollo 2 the wall is a break system of trade with different algorithm of trade mode. This EA using signals to place orders. Is a revolution in the customization of the trading. The algorithms developed for the id
Introduction to X3 Chart Pattern Scanner X3 Cherart Pattern Scanner is the non-repainting and non-lagging indicator detecting X3 chart patterns including Harmonic pattern, Elliott Wave pattern, X3 patterns, and Japanese Candlestick patterns. Historical patterns match with signal patterns. Hence, you can readily develop the solid trading strategy in your chart. More importantly, this superb pattern scanner can detect the optimal pattern of its kind. In addition, you can switch on and off individu

The 3 Automatic Vwap (Midas) Indicator can be used for Price and Volume studyers to map the movement of market drivers. It automatically plots 3 Vwaps, two of which are dynamic and will be updated throughout the day if new highs or new lows emerge. The third Vwap is daily and can help if the trend is up or down. Also, an auxiliary indicator that plots (also dynamic) points of interest with OHLC prices (Open, High and Low of the current day and Close of the previous day) was inserted. Success and

This EA uses a variety of strategies and functions such as neural network grid scalping, mobile stop loss, automatic lot number setting, etc. Use revolutionary price model algorithms, price behavioral trading, and signature collaborative work with artificial intelligence adaptive processing units. The system adopts some kind of reverse sampling development method, which makes the system show a very substantial benefit in the 13-year historical backtesting. Profit drivers to keep profits maximiz
TickChart Indicatorは、MetaTraderのメインウィンドウにティックチャートを表示します。
(無料のLite版である"TickChart Indicator Lite"では、 表示するティック数を20に制限し、以下の説明にあるアラート機能を省いています。) ティックチャートは、市場の動きを最も詳細かつリアルタイムに示すティックラインを描画します。値が変わるたびに発生するティックの間隔は1分足のローソク幅より短いので、通常のチャート上には描けません。通常、数個のティック線分が、1分足のローソクが完成する間に発生しており、重要な指標の発表直後には、その数が100を超える事もあります。 このインディケーターは、ティックラインをメインウィンドウの通常のチャートの上に描きます。通常のチャートは、"時間-価格"空間に描きますが、ティックチャートは、"ティック-価格"空間に描かれます。すなわち、ティックチャートのX軸は時間ではなく、市場が活発だとX軸の進行は速く、閑散だと遅くなります。 TickChart indicatorは、いろいろな場面で役立ちます。例えば、 スキャルピン

LT EXHAUSTION OSCILLATOR - 買い手・売り手エグゾースションオシレーター 概要 LT Exhaustion Oscillator は、独自の多層フィルタリング技術を用いて、買い手(Bulls)と売り手(Bears)の勢いの枯渇(エグゾースション)を測定する高度なインジケーターです。従来のオシレーター(RSI、ストキャスティクス、CCI)に含まれるノイズを最大 90% 削減し、本物の反転ポイントにおいて明確な買われ過ぎ・売られ過ぎシグナルを提供します。 高確率のエントリーポイントを探し、ダマシシグナルを排除したいトレーダーに最適です。 仕組み このインジケーターは、4 段階の平滑化フィルターを通じて市場の強さを分析します。 L0:Bulls Power と Bears Power の生データを取得 L1-L3:ノイズやランダムなスパイクを除去する 3 層のフィルター 結果として、ラインは 0% ~ 100% の範囲で推移します。 0-10%(売られ過ぎ):売り手の勢いが枯渇 → 買いシグナル 90-100%(買われ過ぎ):買い手の勢いが枯渇 →
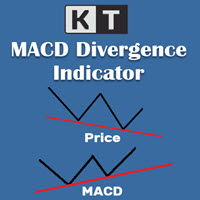
KT MACD ダイバージェンスは、価格とオシレーターの間に形成される通常のダイバージェンスと隠れたダイバージェンスを表示します。トレンドの反転を予測する戦略を用いている場合、MACD の通常のダイバージェンスを利用して転換点を特定できます。トレンドの継続に基づく戦略では、MACD の隠れたダイバージェンスが有効です。
KT MACD ダイバージェンスの制限事項
MACD ダイバージェンスを単体のエントリーシグナルとして使うのはリスクがあります。すべてのダイバージェンスが反転を示すとは限りません。より良い結果を得るためには、プライスアクションや他の分析手法と併用することをおすすめします。
主な機能
価格とオシレーターの間の通常および隠れたダイバージェンスを表示します。 非対称なダイバージェンスは精度向上とチャートの見やすさのために除外されます。 トレンド反転戦略およびトレンド継続戦略の両方に対応。 エキスパートアドバイザーへの組み込みに完全対応。 エントリーおよびエグジットの両方で使用可能です。 すべてのMetaTraderアラートに対応。
そもそもダイバージェンスとは? 一般的

DYJ ArtOfMakingMoney attempts to gauge bullish and bearish forces in the market by using two separate measures, one for each type of directional pressure. The EA's BearsIndex attempts to measure the market's appetite for lower prices
The EA's BullsIndex attempts to measure the market's appetite for higher prices Input: m_magic = 54289721 -- magic number InpTF = PERIOD_H1 -- TimeFrame InpLots = 0.01 - - Lots InpLotsExponent = 1 --

Pivot levels indicator shows 7(9 for Camarilla) pivot levels. It is adjusted for major use, including: all standard time frames
choice of periods to show four popular calculation formulas (typical, median, weighted and Camarilla)
pivot day shift choice of properties for lines and labels choice of showing alerts when crossing pivot lines Parameters: ----------Main parameters----------- Timeframe - time frame for pivot levels
Number of periods to show - displays pivot levels for number of periods

MOON 2 THE WALL is a Oscilator indicator. I s a powerful indicator of TREND for any par and any timeframe. It doesn't requires any additional indicators for the trading setup.The indicator gives clear signals about opening and closing trades.This Indicator is a unique, high quality and affordable trading tool.
Perfect For New Traders And Expert Traders Low risk entries. Never repaints signal. Never backpaints signal. Never recalculates signal. For MT5 Only Great For Scalping Great For Swin

Описание Данный индикатор строит (альтернативные, математически рассчитанные) уровни поддержки и сопротивления, а так же уровни, к которым с большой вероятностью придет цена в ближайшее время. Следует обратить внимание на то, что расчет уровней производится на исторических данных, и качество котировок играет важную роль при построении индикатором линий. Замечу, что отрисованные Magneto и Magneto Weekly линии не изменяют свои значения на всем расчетном периоде. Важное изменение! Добавлена функция

Compare Symbols Specifications is a utility indicator that is a summary interactive table of the analyzed parameters. Trading conditions in the market are constantly changing and tracking these changes is a time-consuming task. This tool allows you to compare the trading conditions of all symbols in a matter of seconds, and choose for trading those symbols that meet the requirements of the trading system. This tool will be useful to all traders and will help them to have up-to-date information

The analyzer makes it possible to quickly assess spread changes on historical data, the magnitude and frequency of bursts, the dynamics and nature of the extensions by the days of the week, etc.
The analyzer needs to be started in the tester (visualization mode) on the symbol and time interval required for analysis, recommended TimeFrame H1, select "Every tick based on real ticks" mode.

Robô Pepito. Pepito é um robô para day trade em mini índice Bovespa. Desenvolvido com uma estratégia que funciona exclusivamente com o ativo WIN, melhorando assim a sua performance e visando mais Ganhos e menos Perdas. - Negociação no ativo Mini Índice (WIN) na BM&F BOVESPA; - Operações 100% day trade; - O robô vai configurado para realizar apenas uma operação ao dia, mas isso pode ser alterado nos "Parâmetros de entrada".
ATENÇÃO: Tipo de conta: [x] Netting, [ ] Hedge. Ativar o horário de fun
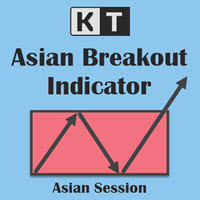
アジア時間帯のレンジを表示 KT Asian Breakout Indicator は、4 時間のアジア時間帯における高値と安値を表示し、レンジ確定後の価格を監視します。GMT Offset でセッションをブローカーのサーバー時刻に合わせ、Draw Session Box でレンジの表示を切り替えられます。 ブレイクアウトと取引水準をまとめて確認 価格がセッション高値より上で確定すると上昇矢印が表示されます。価格がセッション安値より下で確定すると下降矢印が表示されます。Draw Stoploss and Profit Targets を有効にすると、エントリーライン、レンジ反対側の Stop Loss、3 段階の計算済み目標水準がチャートに追加されます。 上方ブレイクアウト: セッション安値を保護水準として使用します。 下方ブレイクアウト: セッション高値を保護水準として使用します。 目標 1、2、3: レンジ幅と現在のボラティリティに基づく段階的な参考水準です。 ブレイクアウト状態: ブレイクアウト足がセッションレンジに対して著しく大きい場合を識別します。 過去のシグナル成績を確認
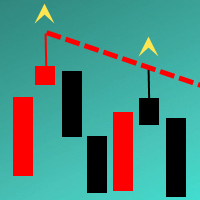
The Indicator automatically draws trend lines on the specified timeframe ( Trend lines period parameter). The lines are drawn based on the last two known fractals of the specified period. If you want the lines to be drawn only on the confirmed fractal, then set the Confirmed or unconfirmed fractal parameter to True . Indicator feature - lines are drawn with the accuracy of any timeframe. It allows analyzing the chart on smaller timeframes without loosing the precision of drawing the lines in re

This EA is to create one or more polling trading strategies in a transaction. In the polling mode, the strategies filter a trend-free range market environment and trades are placed in the opposite direction at the edges of the range. With an additional main trend filter in the trend-following mode, the DYJ's ArtOfForexWar can also trade pull-backs during trends in the trend of loss. The winning rate is more than 95% within three orders or three closes.
List of indicators: SunTzuArtOfWar(ADX) St
MetaTraderプラットフォームのためのアプリのストアであるMetaTraderアプリストアで自動売買ロボットを購入する方法をご覧ください。
MQL5.community支払いシステムでは、PayPalや銀行カードおよび人気の支払いシステムを通してトランザクションをすることができます。ご満足いただけるように購入前に自動売買ロボットをテストすることを強くお勧めします。

取引の機会を逃しています。
- 無料取引アプリ
- 8千を超えるシグナルをコピー
- 金融ニュースで金融マーケットを探索