Belkhayate Gravity Center
- インディケータ
- バージョン: 3.0
- アップデート済み: 1 5月 2019
- アクティベーション: 5

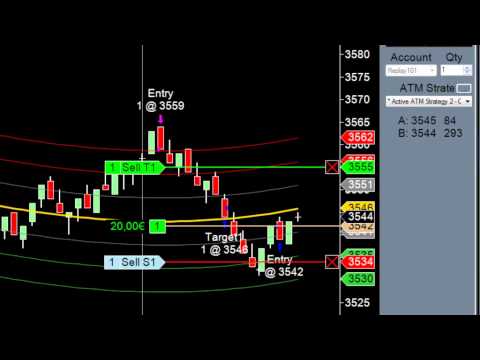
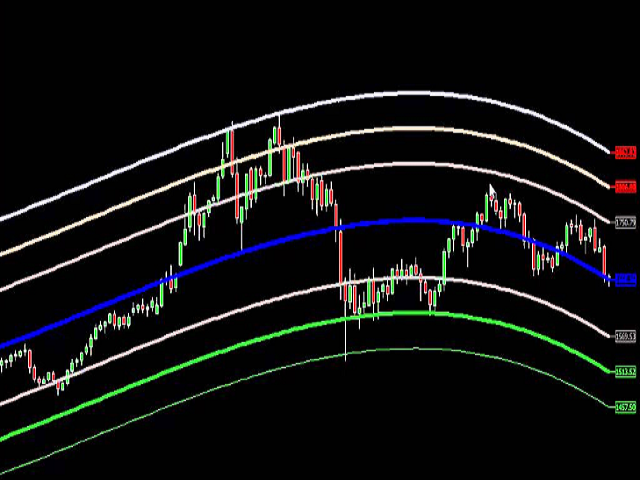
The Belkhayate center of gravity indicator is best used to confirm major turning
points, and distinguish price extremes. Generally if price reaches the
upper or lower levels one should expect a turn around coming soon, or at
least a pull back towards the centre line if there is a strong trend.
The upper and lower levels are red and green lines.
Our indicator use the same parameters as the well known trader M.Mostafa Belkhayate the inventor of the indicator, allow the use of buffers for your EA and allow notification for every closed bar beyond lower or upper limit to your phone.
Strategy:
The idea is to buy between or beyond the Green lines to reach the center blue line, and sell between or beyond the red lines to reach the center blue line.
Parameters:
Push notification for signals : true or false: Notification to your mobile in case of closed bar beyond limits.
Alert notification for signals : true or false: Alert in your terminal in case of closed bar beyond limits.
Buffers:
0: Center blue line values.
1: Upper Line 1 values ,Red.
2: Upper Line 2 values ,Red.
3: Upper Line 3 values,Red.
4: Lower Line 1 values,Green.
5: Lower Line 2 values,Green.
6: Lower Line 3 values,Green.


15min time frame work great on me with AUDUSD. using 2nd day with a profit of 250USD. is easy to use and accurate. control money management and greed.
Best if the candle hit the golden zone for GREEN or RED with alert .
on 15 Sep closing with 400 USD+ using the indicator.
FOR ME sometime the 15min timeframe may not work when the market goes up all the way and cross over the RED zone.
Do not panic, if you have proper money management you may switch to 30min and 1hr time frame to confirm the sell zone and add layer again.
edited on the 16 Sep 2023. and keep on update review to share more about this indicator.