Level Strength Ranker
- インディケータ
- バージョン: 1.0
- アクティベーション: 5

# Level Strength Ranker - Only the two levels that matter
*Category: Support and Resistance | Difficulty: intermediate | Window: chart window (overlaid on price) | Markets: Universal (Forex, indices, commodities, crypto, stocks) | Suggested timeframes: M30, H1, H4, D1*
## Short description
> Scores every level by number of touches, size of reactions and recency, drawing only the strongest one above and below price.
## Full description
### Overview
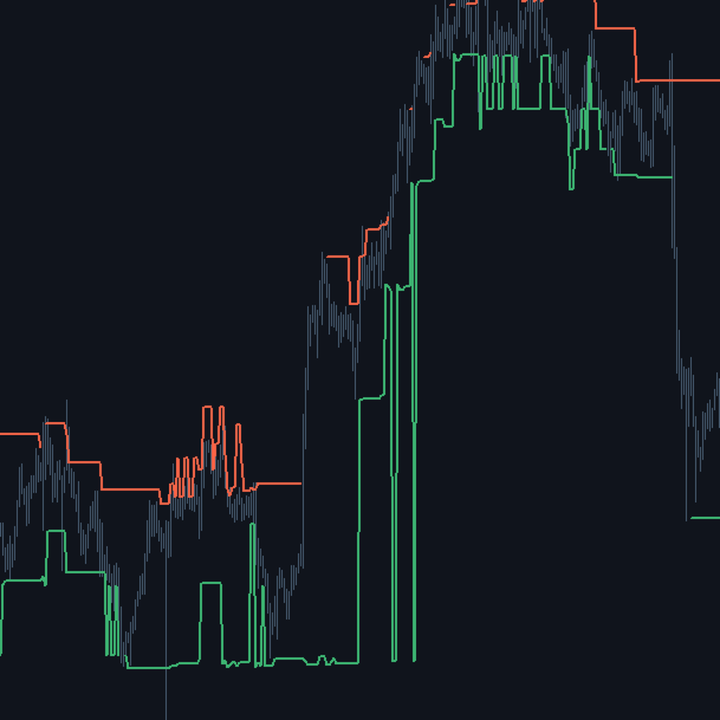
Not all levels are equal. A level touched once is a coincidence; one touched five times, with wide reactions and recently, is a zone the market genuinely recognises. The practical problem is that most support and resistance indicators treat every swing alike and fill the chart with dozens of indistinguishable lines, making it impossible to tell which ones matter. This indicator assigns every candidate level a composite score built on three factors: how many times price touched it, how wide the reaction to each touch was measured in ATR, and how recent those touches are, with an exponentially decaying weight. Only the two highest scoring levels above and below current price are then drawn.
### How the calculation works
1. The price range of the window is split into bands, so that nearby touches contribute to the same level.
2. Every confirmed swing is located with the fractal definition, requiring InpWing bars on the right and on the left.
3. The reaction size is the distance price travelled in the bars following the swing, measured in ATR and clamped at three.
4. The recency weight decays exponentially with the age of the touch, halving every InpRecencyHalf bars.
5. Each band score is the sum of contributions, each equal to the reaction multiplied by its own recency weight.
6. Only bands scoring above the minimum threshold are drawn, and for each side only the highest scoring one.
### How to use it
- Treat the two lines as the main chart references: they are the levels the market genuinely recognised.
- A level drawn for many bars is stable and reliable; one that changes often indicates the absence of clear structure.
- The distance between the two lines is a natural measure of the available operating room.
- Raise InpMinScore for an even cleaner chart, accepting that in some phases no level is drawn at all.
- Lower InpRecencyHalf to give more weight to recent touches, useful on markets that change structure quickly.
### Who it is for and on which timeframes
It suits traders working with support and resistance who want a readable chart instead of a web of lines. It works from M30 to D1. It requires no technical background: the three scoring factors correspond to what an experienced trader judges by eye when deciding which levels to draw. It is particularly useful for those monitoring many instruments, because it reduces every chart to two immediate references.
### Practical example of reading a signal
On EURUSD H4 the chart shows at least twelve swings over the last two hundred bars. A traditional indicator would draw them all. Here the score favours a level at 1.0920, touched four times in the last two months with reactions of over two ATR each, and discards six others touched once and now distant in time. Below price the winning level is 1.0780, with three recent touches. The trader has two clear references instead of twelve, and knows both have a history of real reactions behind them.
## Input parameters
| Parameter | Default | Description |
|---|---|---|
| `InpWindow` | 200 | Bars analysed in the search for levels. Internally capped at 1000 to contain the computational cost. |
| `InpBins` | 60 | Bands the price range is split into. More bands give greater precision but group nearby touches less. |
| `InpWing` | 2 | Confirmation bars per side of a swing. Low values find more levels, high ones only major turning points. |
| `InpAtrPeriod` | 30 | ATR period used to measure reaction sizes in a comparable way. |
| `InpRecencyHalf` | 80.0 | Bars after which the weight of a touch halves. Low values strongly favour recent touches. |
| `InpMinScore` | 1.50 | Minimum score for a level to be drawn. Raising it makes the chart cleaner but more often empty. |
## Advantages / strengths
- It reduces the chart to two meaningful references instead of filling it with indistinguishable lines.
- The score combines three independent factors, replicating the judgement an experienced trader makes by eye.
- The recency weight prevents very old levels from remaining drawn out of inertia.
- No repaint: it uses exclusively swings already confirmed on both sides.
## Limitations and warnings
- The band subdivision introduces an approximation: two nearby touches falling in different bands do not add up.
- The drawn level can change abruptly when two bands have nearly identical scores.
- Showing a single level per side means hiding the second and third, which sometimes matter.
- Scanning every swing of the window on each bar carries a non-negligible computational cost.
**No repaint:** values printed on a closed bar are never modified afterwards.
**Disclaimer.** This product is a technical analysis tool, not an automated trading system, and it offers no profit guarantee whatsoever. Financial markets carry the risk of total loss of the invested capital. Past performance is not indicative of future results. Every signal must be confirmed with your own analysis, a money management plan and prior testing on a demo account. The author is not responsible for trading decisions taken on the basis of this indicator.
## Suggested tags / keywords for MQL5
`support resistance`, `levels`, `scoring`, `swing`, `price action`, `confluence`, `no repaint`, `ranking`