FVG Fair Value Gap
- インディケータ
- バージョン: 5.3
- アクティベーション: 5

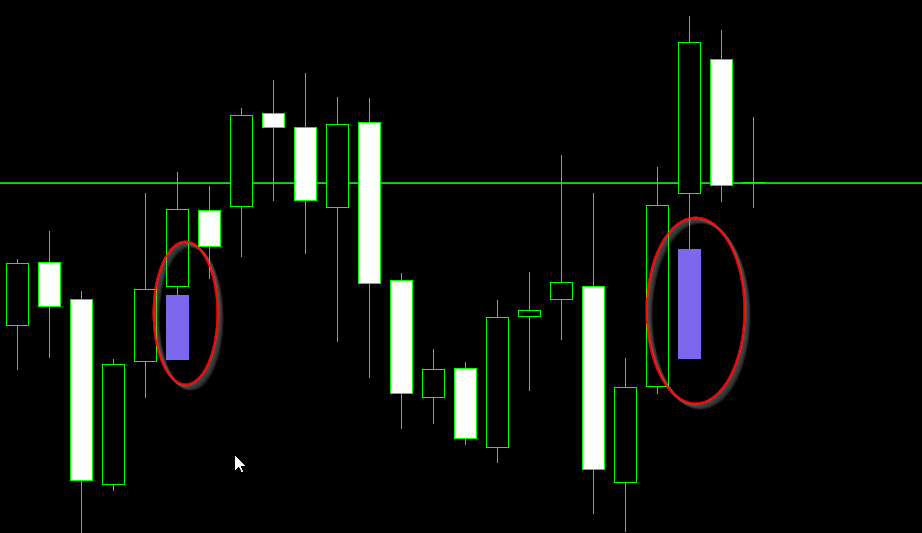
FVG - Fair Value Gap indicator is a three candle pattern indicator . It find inefficiencies or imbalances in market. It act as magnet before continue the trend.
indicator key function
1. No object is used to draw the plot. You can use this to build EA and backtest also.
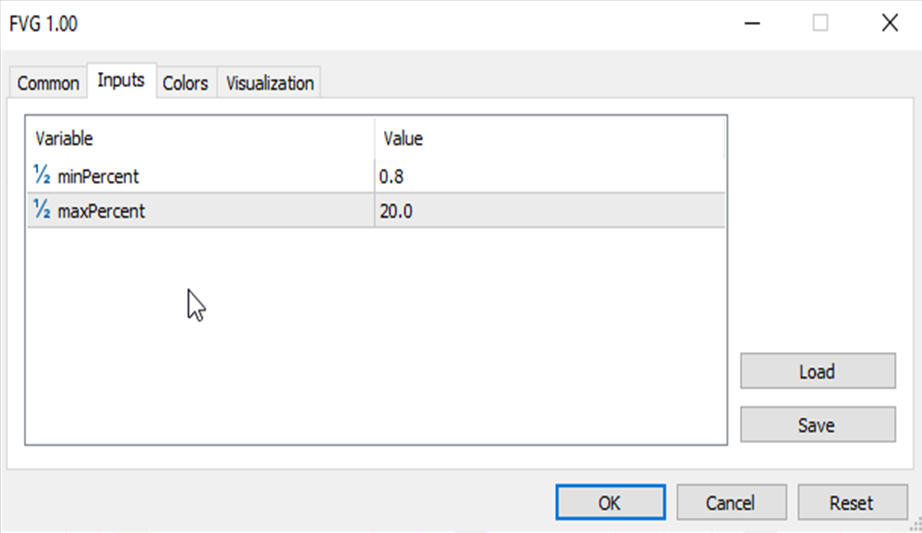
2. Min and max value to Filter-out the noises .
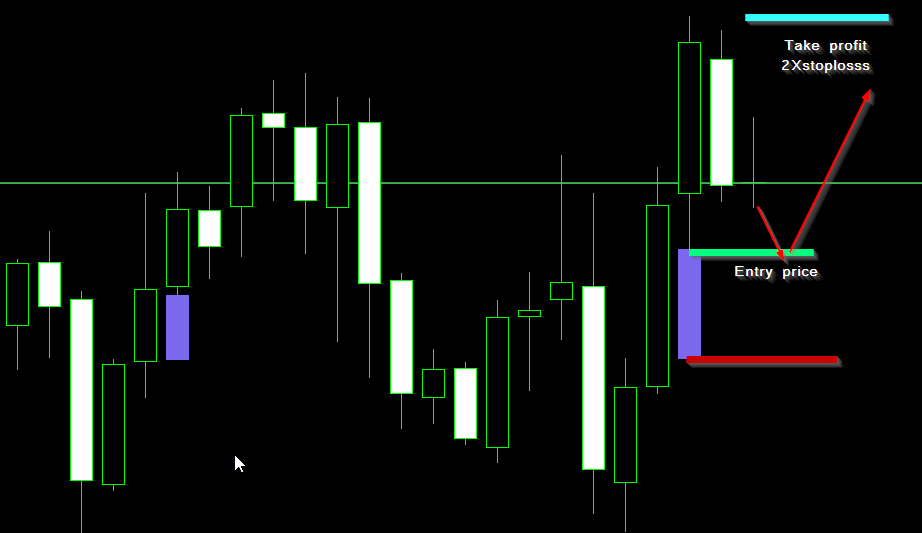
It use as retest zone and can be use as entry price also. It popular among price action traders.
your suggestion and comments are welcome and hopping that you will find this helpful.