 MetaTrader 5
 エキスパート
 インディケータ
 ライブラリ
 ユーティリティ
 ウィジェット
 ルール
YouTubeにあるマーケットチュートリアルビデオをご覧ください
ロボットや指標を購入する
仮想ホスティングで
EAを実行
EAを実行
ロボットや指標を購入前にテストする
マーケットで収入を得る
販売のためにプロダクトをプレゼンテーションする方法
MetaTrader 5のための無料のテクニカル指標 - 64
 テクニカル指標からのシグナルは、株式および外国為替市場での取引の開始と終了に重要な役割を果たします。指標の本質は、将来の価格変動を予測することを目的とした金融銘柄価格の数学的変換です。
テクニカル指標をテストして、市場の動きとそれからの利益をより正確に予測します。

BodyCandleBreakout – Smart Body Breakout Signal Indicator for MT5 BodyCandleBreakout is a clean, price-action-based indicator that instantly identifies when the current candle's close price breaks beyond the body (high or low) of the previous candle . No repainting. No lag. Just pure, objective breakout signals directly on your chart. Overview Breakouts are among the most reliable price-action signals in trading. But not all breakouts are created equal. BodyCandleBreakout focuses
FREE
Indicator IRush uses a modified version of a popular indicator RSI (Relative Strength Index) to look for entries on a daily chart or lower. The indicator has been set up and tested with the major symbols: AUDUSD, EURUSD, GBPUSD, USDCAD, USDCHF, and USDJPY. An automated trading with this indicator is implemented in the expert advisor Intraday Rush . This expert advisor can open, trail and close its trades. Check it out, it may be exactly what you are looking for!
A Correct Reading of IRush
The c
FREE
NewTest https://backoffice.aurum.foundation/u/DHXP1U
Good afternoon. Today we offer the maxlottomson indicator to determine the maximum volume that you can put up for purchase or sale, if you look at your deposit level. This indicator is convenient to use for News trading, when you need to determine the entry point on a high-speed movement and calculate the risk level as a percentage of the deposit, the maxlottomson indicator shows the maximum value of the LOT volume for your deposit that you
FREE

Account and Trading Dashboard Indicator
The **Account and Trading Dashboard** is a custom MetaTrader 5 (MT5) indicator designed to provide traders with a comprehensive, real-time overview of their account metrics, trading statistics, and technical indicators directly on the chart. It displays essential financial and performance data in a draggable, minimizable, and closable panel, enhancing usability without cluttering the workspace. The indicator supports optional features like ADX and RSI for
FREE
Time to Trade Trading timing indicator is based on market volatility through 2 ATR indicators to determine the timing of a transaction. The indicator determines the times when the market has strong volatility in trend. When histogram is greater than 0 (blue) is a strong market, when histogram is less than 0 (yellow) is a weak market. Should only trade within histograms greater than 0. Based on the histogram chart, the first histogram value is greater than 0 and the second histogram appears, this
FREE
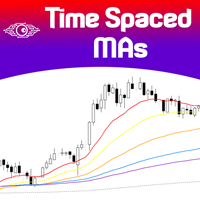
The concept is simple: Plotting Price behavior within several periods of time. Some Symbols behave very well during the trading day - with this I mean Intraday trading - and this behavior ends up plotting effectively well with the proposed Exponential Moving Averages in this indicator... Obviously that this behavior could not be seen in all Symbols, but you can give it a try... Just drop this indicator in a chart and you will see for yourself...
This indicator is intended for "Feeling the Trend"
FREE

Looks for strong price movements and draws levels upon their completion.
You determine the strength of the movement yourself by specifying in the settings the number of points and the number of candles of the same color in a row in one direction.
There are 2 types of building in the settings: extrenum - high / low close - close price You can also adjust the number of displayed levels and the number of candles for calculations.
By default, the settings indicate 5 levels for 360 candles.
That
FREE

The indicator shows the number and ratio of ticks with the price growth and fall for each candle of the chart. The upper part of the histogram in the form of thin lines shows the number of price growth ticks (bullish strength), while the lower part shows the amount of price fall ticks (bearish strength). The thicker histogram bars is the difference between the strength of bulls and bears. A positive difference is displayed in green, and the negative one is red. The strength of bulls increases wh
FREE
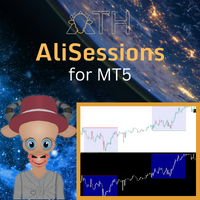
AliSession Highlight is an indicator that highlights a specific period of time according to your preferences. It can help you gain a clear vision of price movements into a specific session, the range of a session, and also to easily identify the high and low of the session. You can use it on any currency pairs, indices, and any timeframes. Settings: Start Hour: Set the hour to initiate the session highlight. Start Min: Set the minute for the start of the session highlight. End Hour: Specify the
FREE

Indicator Description: Market Session Overlay The Market Session Overlay indicator for MT5 visually highlights the key global trading sessions — Asian, European, and American — directly on your chart.
It allows traders to clearly identify the time ranges of each session and their respective highs, lows, and opening levels, improving session-based analysis and strategy execution. Features: Draws colored rectangles for each session (Asian, European, American) on the chart.
Configurable se
FREE

Introducing the “Symbol Cost Info MT5” indicator – your ultimate tool for staying ahead in the forex market! This innovative indicator is designed to empower traders with real-time cost information, directly on their charts. Here’s why every trader needs the “Symbol Cost Info MT5” in their arsenal: Real-Time Spread Monitoring : Keep a close eye on the spread for any currency pair, ensuring you enter the market at the most cost-effective times. Pip Value at Your Fingertips : Instantly know the v
FREE

Projection of Phi Is a technical indicator that calculates dynamic support and resistance levels. It uses angular geometric projections and mathematical ratios to identify market expansion ranges. Features: Dynamic Fibonacci Expansion: Extension level projection Geometric Calculation: Angular analysis and mathematical ratios Visualization: Graphical objects with informative labels Compatibility: M1 to H4 timeframes Applications: Identification of zones for trade management Analysis of volatil
FREE
Indicator alerts for Dual Relative strength index rsi. Large rsi preset at 14 is below 30 small rsi preset at 4 is below 10 for buy bullish signals .
Large rsi preset are 14 is above 70 small rsi preset at 4 is above 90 for sell bearish signals . Includes mobile and terminal alerts. draws lines when alerts.
This indicator can help identify extremes and then the tops or bottoms of those extremes .
FREE
Multset This is inte_plays indicator, which helps the trader to enter the trades appropriately it plots an arrow when there is appropriate environment which permits trading
Features 1. Sends push notification on mobile devices 2. Plots arrow on chart when the setting is found
TimeFrame Is suggested to be used on higher time frames only, especially starting 15min and above for proper moves
For more informations please Visit: https://t.me/Tz_Fx_Lab Subscribe to our Youtube channel: https:
FREE
Range Pullback Limits – Smart Buy/Sell Zone Indicator for MT5 Range Pullback Limits is a professional MT5 indicator that automatically marks potential Buy Limit and Sell Limit levels during ranging markets. It helps traders identify high-probability pullback zones and avoid trading when the market is trending strongly. *Note: Combine this indicator to filter entry points - https://www.mql5.com/en/market/product/149443 Key Features Works on Forex, Gold (XAUUSD), Crypto, Indices, Stocks Detects r
FREE

Volatility and Financial Volume Indicator This indicator was developed to assist in analyzing price volatility , identifying periods of band contraction and expansion , together with color changes associated with financial volume behavior. The system highlights regions where a significant increase in volume occurs, allowing traders to observe potential areas of interest for trend continuation or trend reversal studies. The analysis is primarily focused on the M15 and M5 timeframes , allowing use
FREE

MultiTimeframe Trend Pro shows you the market direction across 7 timeframes at a glance. Clear colors, no repainting, fully customizable. Perfect as a quick filter for any intraday or swing strategy.
Key Features Supports M1, M5, M15, H1, H4, D1 and W1
Colors MediumSeaGreen when the close is above the MA, and Red when below
No repainting → always based on the last closed candle for each timeframe
Fully customizable: MA period (200 by default) font, size and colors X/Y offsets, spacing
FREE

Chart Status Bar MT5 は、チャート上に市場・接続・シンボルの重要情報を表示する完全な読み取り専用インジケーターです。
コンパクトバーには以下を表示します: • ブローカーの取引時間と次回セッション切替; • ターミナル接続状態; • 最新Tickからの経過時間; • 現在のスプレッド(points / pips); • 現在のローソク足の残り時間; • 取引サーバー時間。
DETAILS パネルにはさらに以下を表示します: • シンボルの取引モード; • 最小・ステップ・最大取引量; • Stop / Freeze レベル; • Tick Size / Tick Value; • Contract Size; • 日中レンジと変化率; • 起動後の最小・平均・最大スプレッド; • 基準ロットに対する推定スプレッドコスト; • 基準ロットに対する推定必要証拠金; • Long / Short Swap と3倍Swap曜日; • サーバー時間・ローカル時間・UTC; • 基軸通貨・損益通貨・証拠金通貨; • 次回のブローカー取引セッション切替。
利用可能な表示幅
FREE
Simple alternate MACD version like the one used in tradingview. Two lines (MACD & signal line) and a histogram. This MACD version can be used in many different ways. Potential trades are the crossing of the MACD & signal line, the crossing of the MACD through the 0-line of the histogram, the MACD being under the 0-line of the histogram or the movement of the histogram itself. A combination of these potential signals on different timeframes can be very precise, but always needs additional confirm
FREE
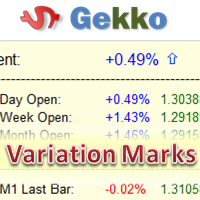
This is Gekko's indicator of quotations and variations. It summarizes quotations and variations of the current symbol in different timeframes as well as other correlated symbols. Keep track of all this information on your chart while you are negotiating for decision making support. Input Parameters General Settings: configure which quotations and variations you want to keep track for current day, week, month or year as well as M1, M5, M15, M30, H1 and H4 charts; Symbols Configuration: add up to
FREE

This is an original trend indicator. The indicator draws three lines in a separate window. Its values vary from -1 to +1. The closer the indicator is to +1, the stronger is the ascending trend. The closer it is to -1, the stronger is the descending trend. The indicator can be also used as an oscillator for determining the overbought/oversold state of the market. The indicator has one input parameter Period for specifying the number of bars to be used for calculations.
FREE

The indicator uses moving average reversal values on all selected timeframes to plot levels where the moving average has reversed, which can be considered support or resistance levels, as well as trend change signals on the timeframe of the newly drawn line. The moving average is passed through the RSI indicator.
The line colors are customizable and, by default, indicate the following: 1. Purple - the moving average has changed direction downwards. 2. Gold - the moving average has changed di
FREE

Normal Parabolic SAR with label of long or short state. Tells also "Parabolic long" and "short". Can be used in multitimeframe layouts together with Swiss HolyGrail indicator or in different timeframes. So, if all the indicators show "long" or "short" you can be sure that the risk of a wrong direction is small. The standard values for Parabolic SAR are 0.02 for step and 0.2 for maximum. You may experiment with changing the maximum to get smother curves. Note that changes in parabolic SAR are la
FREE

The Volunacci indicator is a custom technical analysis tool designed for MetaTrader 5. It combines volume analysis with Fibonacci retracement principles. In essence, it displays the current volume as a colored histogram within its own window. The unique feature is that it calculates a recent volume range (high and low over a user-defined period) and then projects key Fibonacci retracement levels (23.6%, 38.2%, 50%, 61.8%, 100%) onto this range. The color of the volume histogram changes dynam
FREE

Indicador Regressão Linear – Par de Ativos Indicador é um oscilador que faz o plot do Resíduo resultado da regressão linear entre os dois ativos inseridos como input do indicador, representado pela fórmula: Y = aX + b + R Onde Y é o valor do ativo dependente, X é o valor do ativo independente, a é a inclinação da reta entre os dois ativos, b é a intersecção da reta e R é o resíduo. O resíduo representa a quantidade da variabilidade que Y que o modelo ajustado não consegue explicar. E os resíduos
FREE

Trader’s Cockpit is a simple non directional dashboard for MetaTrader 5 designed to give traders a quick, clear view of their trading environment directly on the chart. Creator: https://www.quant-atlas.com/ The indicator does not generate buy or sell signals, does not predict market direction, and does not perform any trading action. Its purpose is to make the trader’s daily workflow easier by centralizing useful account, symbol, spread, session, and broker condition information in one compact
FREE

Sniper Spread Monitor v1.0 ¿Qué es el Spread y por qué es vital monitorearlo? En el trading, el Spread es la diferencia entre el precio de compra ( Ask ) y el precio de venta ( Bid ). Es, en esencia, el costo inmediato que pagas al bróker por abrir una operación. Para un trader de precisión, el spread no es solo un número; es un factor crítico por tres razones: Costo de Ejecución: Un spread alto significa que empiezas la operación con una pérdida mayor. En estrategias de scalping o entradas prec
FREE

Indicator Description This indicator monitors overbought and oversold levels , combining technical indicator signals with financial volume analysis in the regions marked on the chart. The system was primarily developed to support Swing Trading and Position Trading , using the H1 timeframe as its main reference. It is designed to help traders analyze areas where price may show changes in behavior, continuation, or loss of momentum. The marked regions should be used as areas for study and monitori
FREE

This indicator shows the strength of each currency compared to the US dollar by calculating the rate of change in price over a specified time period. When you open the indicator, you'll see a list of different currencies on the price chart. Each currency will have a numerical value indicating its strength level compared to the US dollar, where: If the value is higher than the US dollar, it will be displayed in green, meaning that currency is stronger than the dollar. If the value is lower than t
FREE

Price Edge – 市場が動く前に価格を確認 トレーディングでは、 たった1秒で利益のある取引とチャンスを逃す取引の差が生まれます 。
MetaTrader 5 (MT5) の Price Edge を使えば、もう二度とティックを見逃すことはありません。 Price Edge は単なるインジケーターではなく、あなたの取引優位性です。
リアルタイム価格更新 を提供し、常に正確で迅速、そして自信を持った意思決定を可能にします。 Price Edge を選ぶ理由 Live Price Indicator MT5 – ビッド価格を瞬時に表示
MetaTrader 5 用リアルタイム価格 、超高速更新
トレードスタイルに合わせて完全カスタマイズ可能
軽量パフォーマンス — プラットフォームを遅くしません
小数点以下まで正確、FX、ゴールド、暗号通貨、指数に最適
スキャルピング、デイトレード、短期足取引 に最適 人間は「明確さ」に反応する… Price Edge は価格を正確に表示します: 明確 正確 常に見える 遅延なし 気を散らさない 推測なし 価格を
FREE

Kito Market Structure Counter is a clean MT5 indicator that automatically identifies confirmed swing structure and tracks consecutive Higher Highs (HH), Higher Lows (HL), Lower Highs (LH), and Lower Lows (LL) . It displays the current market bias — Bullish, Bearish, Bullish Lean, Bearish Lean, or Mixed — in a compact on-chart panel, together with the latest swing relationships and structure sequence counts. The indicator uses confirmed closed-bar swings , helping prevent published swing points f
FREE

Automate Your Strategy! Use the Daily Drop Analyzer Expert Advisor to automatically execute the strategy, with configurable filters, parameters, and order management.
Check it out here: Daily Drop Analyzer EA
The Step Analysis Indicator performs an automated backtest of a simple daily strategy: buy when the price drops a certain percentage from the previous close and sell at the same day's close (or vice versa for short strategy). It tests multiple entry percentages ("steps") and displays the
FREE

The Volume Heatmap indicator visually shows the INTENSITY of the volume taking into account the concept of standard deviation. Purpose of the Indicator: High volumes are common where there is a strong consensus that prices will increase. An increase in volume often occurs at the beginning of a new upward trend in the price of an asset. Some technical analysts do not rely on trend confirmations without a significant increase in volume. Low volumes usually occur when an asset is heading for a down
FREE

# MASignalPanel — Multi-MA Signal Panel with Trend Filter ## Overview MASignalPanel is an all-in-one moving-average signal indicator designed for MetaTrader 5. It combines up to three moving averages (SMA, EMA, SMMA, LWMA) with four trade signal modes — Cross, Breakout, Pullback and Channel — and adds a higher-timeframe trend filter line (default EMA240) to keep you on the right side of the market. A fully interactive control panel lets you change MA type, MA count, periods, s MA indicator, movi
FREE

Wilder Trend Indicator (MT5) The Wilder Trend Indicator is a clean and lightweight trend-following tool based on Wilder’s Moving Average smoothing method .
It visually highlights market direction by separating uptrend and downtrend movements directly on the price chart. The indicator is designed to be simple, flexible, and non-intrusive , making it ideal for discretionary traders who want clear trend confirmation without cluttering the chart. Key Features Uses Wilder-style smoothing for st
FREE
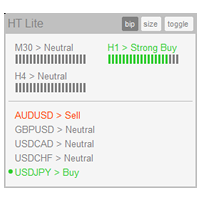
The indicator High Trend Lite monitors 5 symbols in up to 3 timeframes simultaneously and calculates the strength of their signals. The indicator notifies you when a signal is the same in different timeframes. The indicator can do this from just one chart. Therefore, High Trend Lite is a multicurrency and multitimeframe indicator. With the High Trend Pro , available at this link , you will have an unlimited number of symbols, 4 timeframes, a colourful chart of the primary MACD indicator, several
FREE

LogVar は、価格の 対数変化率 を計算し表示するための専門的なテクニカルインジケーターです。
通常のパーセンテージ変化では表しきれない、より正確で安定した価格変動の強さと方向を捉えることができます。特に、長期的なトレンド分析やボラティリティの高い市場で効果を発揮します。 このインジケーターは、現在の終値と n 期間前の終値( iPeriod で設定)を比較し、その比率の対数を取って変化率を算出します。結果は拡張された対数スケールでプロットされ、微細な値動きやトレンドの変化を視覚的に認識しやすくします。 ラインの色は変化方向に応じて自動で切り替わります: 緑色: 上昇傾向(現在価格が基準値より上) 赤色: 下降傾向(現在価格が基準値より下) 中央の 0 ライン は中立ラインとして機能し、プラスとマイナスの変化を明確に区別します。 主な特徴: 実際の対数変化率 を正確に測定 自動スケーリングと視覚的補正 動的なカラーライン表示 軽量・高速処理で全タイムフレーム対応 トレンドの方向性を一目で判断可能 推奨用途:
トレンド転換の検出、価格変動の強弱分析、システムトレードや
FREE

ViewTrend The ViewTrend indicator provides a visual interpretation of market conditions by coloring the candles and the moving average line based on defined technical criteria. ️ How does it work? The agorithm analyzes the relationship between the current closing price, the previous closing price, and the behavior of a simple moving average (SMA). Based on this analysis, the indicator colors the candles and the moving average line according to the technical scenario observed: Blue — Suggesti
FREE

Trading Session Activity Dashboard
TAGLINE
Trade the session, not just the candle.
PRODUCT OVERVIEW
SessionEdge Navigator MT5 is a session-analysis indicator for MetaTrader 5. It tracks the major trading sessions and provides a practical dashboard showing whether a session is active, how much range it has produced, how that range compares with its recent average, and whether current session behavior is bullish, bearish, or range-like.
Covered sessions: - Sydney - Tokyo / Asian - London - N
FREE

If you like this product, please give it a 5 star rating as a token of appreciation.
This indicator plots horizontal trend lines at the opening price of each quarter (Q1–Q4) on the chart. These lines visually represent quarterly open levels of the current year, which traders often use as support/resistance or reference points. Automatically plots Q1–Q4 opening levels as trend lines on the chart. Lines are dashed, colored, and labeled. Handles both current and historical quarters. Cleans up line
FREE

この製品は、ブローカーサーバーのタイムゾーンに基づいて15か国の取引セッションを表示するように設計されており、希望の設定に基づいたさまざまな表示モードにより、チャートの混雑を防ぎ、ユーザーの希望の時間でセッションを設定することが可能です。
外国為替市場に太陽が沈むことはありませんが、そのリズムは独特の取引セッションのビートに合わせて踊ります。これらのセッション、それらの重複、およびその独特の雰囲気を理解することは、市場に逆らうのではなく、市場とともに動きたい外国為替トレーダーにとって非常に重要です。
Tokyo China London Canada New York Moscow Saudi Arabia ... USDJPY *** *
***
AUDJPY ***
NZDUSD *
***
EURAUD
**
GBPUSD
***
***
EURCHF
***
USDCHF
*
***
GBPJPY *** ***
FREE

Prop Guardian — 日次損失&ドローダウンモニター(無料) OneFundedが公表しているデータによると、プロップファームのチャレンジ評価で失格となるケースの78.7%は、全体的なドローダウンではなく、1日の許容損失額(日次損失上限)の違反によるものです。多くのトレーダーは戦略が破綻して負けるのではなく、まさにその瞬間に最も重要な数値が画面に表示されていなかったために敗退しています。 Prop Guardianは、その数値を画面上に常に表示します。 主な機能 日次損失上限と最大ドローダウンの両方を金額とパーセンテージでリアルタイムに並列監視 設定した1トレードあたりのリスクに基づき、残りの許容損失額を「あと何回負けトレードが可能か」に自動換算 3つのドローダウンモードに対応:スタティック(固定)、トレイリング、トレイリング・ウィズ・ロック(固定移行型)— 各プロップファームの実質的なルール定義に正確に適合 限界に達してからではなく、近づいた段階で知らせるカスタマイズ可能な事前警告アラート(ポップアップ、効果音、プッシュ通知) 他ツールとの違い すべての日次損失計算は、サー
FREE
MultiFrame MA: A Multi-Timeframe Trend Indicator MultiFrame MA is a trend analysis indicator designed to provide a comprehensive market overview across various timeframes. Instead of relying on a single timeframe, this tool synthesizes information from multiple charts, giving users a holistic and reliable perspective. KEY FEATURES: Multi-Timeframe Analysis: The indicator analyzes data from various timeframes, from M1 up to Monthly, to help users identify trend confluence at different levels. MA
FREE
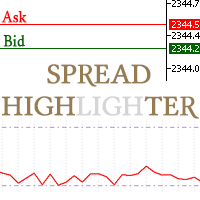
This spread indicator displays the actual spread of each candle. It highlights the maximum spread and the minimum spread of the chosen symbol. This indicator is very helpful to see in real time the spread evolution helping to avoid taking a trade when the spread is too high.
Inputs:
Print value in Points: if true displays the spread as a whole number
D isplay minimum and maximum spread of the past N days: select the number of days to consider the maximum and minimum spread
Automatically adj
FREE

The indicator makes calculations based on data obtained from one of seven (7) moving averages and colors the chart.
Simple moving averages are those that have only one important calculation parameter - the period.
The shift in the indicator is not used.
There is a shift trick setting, it is used to smooth the result of calculations. You can see the changes if you reduce this parameter to 1 (minimum value).
shift trick must always be less than the period value.
Available averages:
MA Simpl
FREE
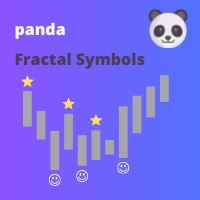
This indicator displays fractal symbols and bars Use this indicator to show different symbols for bearish and bullish fractals: Choose from 144 symbols (refer to table below) Colors, size and offset of fractals can be modified Fractal price bar or candle color can be changed Hide fractals and show fractal price bar only Frequency in fractal calculation can be changed
How to use 1. Select which symbols to use for bearish and bullish fractals; 2. Select which colors to use for bearish and bullis
FREE

Are you a scalper? This indicator reviews all 15 minute time frame and lets you set you range with an alert for when locked range is broken. This indicator, engineered for the Phoenix Trading 2026 suite, is a professional-grade Multi-Timeframe (MTF) Liquidity & Trend Dashboard. It is designed for high-precision scalping on Gold (XAUUSD) and Major Forex pairs, specifically targeting traders who operate on the 1-minute and 5-minute charts but need higher-level institutional context. Core Features
FREE
NewTest https://backoffice.aurum.foundation/u/DHXP1U
2indtompsonインジケータは、MT4端末用のアナログバージョンから作成されたペア取引または裁定取引のバランスをとるために、ボリュームを決定するための二つの あなたは二つの楽器が重量を量るだろうどのくらい比較する必要があり、あなたがそれを行う方法がわからないのであれば、チャート上のインジケータ さらに、インジケータは、互いに対する楽器の状態を示します-発散/収束。
M5/M15/H1時間枠で使用することをお勧めします
通信のための連絡先777basil@mail.ru あなたの技術的なタスクに従って、expert Advisor/indicator/scriptの書き込み、製造、リワーク、修正を行います。
ありがとう!. https://youtu.be/kgbIgnujuAM
FREE

TrendView — Clear Trend Visualization for Confident Trading
TrendView is a free trend indicator designed to give traders a clean and reliable view of market direction. It displays clear trendlines in three colors, making it easy to identify bullish, bearish, and neutral phases without cluttering the chart with unnecessary elements. Whether you are monitoring long-term market structure or short-term price action, TrendView helps you keep your focus on the bigger picture. For traders who also w
FREE

DYNAMIC BALANCE MATRIX (SK Edition) — The Ultimate Multi-Timeframe Analytical Engine DYNAMIC BALANCE MATRIX is a professional-grade decision-making tool. This indicator acts as your "Control Tower," scanning up to 21 timeframes simultaneously and condensing market dynamics into a single, actionable numerical value — the Total Score . Interface & Control Buttons Timeframe Buttons (M1-MN1): Click to "Pin" a timeframe. Only active (selected) timeframes contribute to the Total Score . MENU / H
FREE

The X-21 TrendSync Elite is an advanced indicator designed for traders seeking precise trading decisions based on multiple technical indicators. Operating in a separate window, it integrates Stochastic, RSI, and CCI indicators (in two variants: Trigger CCI for entries and Trend CCI for trends) to provide clear visual signals for buying, selling, or waiting. With support for nine timeframes (M1, M5, M15, M30, H1, H4, D
FREE

️ RISK MANAGER — Risk Management Indicator Indicator version: 1.70 · Style: QuikTrade · Position: bottom-left corner of the chart 1. What it is Risk Manager is an informational indicator for MetaTrader 5 that shows the daily risk budget in real time and helps calculate the recommended lot , taking into account: risk per single trade (% of balance); daily risk (% of balance); losses and profits already realized today; risk of open positions (based on their Stop Loss); distance
FREE

The Average Directional Index (ADX) is a technical analysis indicator developed by J. Welles Wilder in 1978. Its primary function is to measure the strength of a trend, regardless of its direction, and to determine whether the price has entered a sideways trend. It is also mentioned by John Murphy in *The Visual Investor* (2005) as an indicator that helps determine whether a market is ranging or is about to start a new trend. As for Exponential Moving Averages (EMAs), some authors believe that
FREE

パラボリックのデータをもとにトレンドの方向性を1分足から月足まで表示します。 1分足から 月足 まで表示されているので今どの方向に価格が動いているのかがすぐに分かります。
更新はティク毎ではなくディフォルトでは1秒毎、もちろん変更も可能なのでチャートの表示が遅くなるようなことはありません。
機能:
どの通貨でも表示可能になります。
アイコンの色を指定することが可能になります。
表示位置(X軸、Y軸)が変更可能 になります。
表示位置 (左上 、 右上 、 左下 、 右下) が 指定 が可能 になります。
フォント を指定することが可能になります。
フォントサイズ が 変更可能 になります。
アイコンのサイズ が 変更可能 になります。
週足、 月足 の非表示 が 可能 になります。
FREE
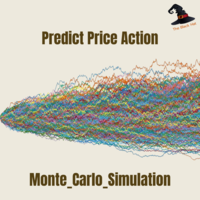
Monte Carlo simulation is an Indicator that uses a Monte Carlo model to calculate the probability of the price going up or down. If the price has a probability of going up or down more than 90%, the system will enter a trade by doing a back test of gold assets. It was found that it was able to generate a return of more than 20% in a period of 5 months while having a MAX DD of less than 7%.
What is a Monte Carlo simulation?
A Monte Carlo simulation is a model used to predict the probability of
FREE

Drawdown Guard is a free MetaTrader 5 dashboard that tracks your daily and weekly equity drawdown against your own limits — and warns you before you breach them. Works alongside any trading style, manual or automated, and any strategy: it doesn't care how you trade, only how much you've lost so far.
What it does: - Daily loss limit tracking — set a % of balance or a fixed $ amount; the dashboard shows your current day's P&L against it in real time. - Weekly loss limit tracking — same idea, tra
FREE

AI Multi Timeframe Oscillator Heatmap combines RSI and Stochastic readings across six timeframes at once - M15, M30, H1, H4, D1, and W1 - into a single, instantly-readable, color-coded panel. Instead of switching charts to check whether momentum agrees across timeframes, you see the full picture in one glance. KEY FEATURES
- Calculates live RSI and Stochastic values on six timeframes simultaneously (M15 through W1) for the current chart's symbol.
- Color-codes every row by combined momentum read
FREE
BBTrend is a powerful trend analysis tool designed to provide a clear overview of market volatility and trends at a glance.
This indicator calculates the difference between two Bollinger Bands of different periods,
visually indicating the strength of upward or downward trends to traders. Clear Trend Visualization: The upward trend is represented in green, and the downward trend in red,
allowing traders to intuitively grasp the direction and strength of the trend. Standardized Percentage Disp
FREE

EMA 200 Entry Strategy The 200 Exponential Moving Average (EMA) is a powerful indicator used to identify the overall market trend and high-probability trade entries. It acts as a dynamic support and resistance level, helping traders align with institutional market direction. When price is trading above the EMA 300 , the market is considered to be in a strong uptrend . In this condition, traders should focus only on buy opportunities . A valid entry occurs when price pulls back toward the EMA 200
FREE

ATR Short Box Anchor MT5 ATR Short Box Anchor MT5 is a visual risk-reward indicator for MetaTrader 5, specifically designed for planning short setups. The indicator creates an ATR-based short box directly on the chart, including entry, stop-loss zone, take-profit zone, and optional risk-reward information. The indicator works with a freely movable anchor point. This anchor defines the desired entry price and the candle whose ATR value is used for the calculation. This allows a short setup to be
FREE

Three Anchors On One Chart Most volume weighted average lines restart once a day. This one draws three at the same time: one anchored to the current trading session, one to the day, one to the week. Their spread tells you something a single line cannot. When the session line sits far under the weekly one, the week has been trading higher than today is; when all three sit together, the market has spent the week in one place. Why The Session Anchor Is Not Midnight The session line starts where the
FREE

Características Principales 1. Medía Móvil Multi-Timeframe (MTF) con Estabilidad Temporal EMA Macro ( InpMATimeframe ): Permite proyectar y visualizar en el gráfico actual una Media Móvil Exponencial (EMA) calculada desde una temporalidad superior (por defecto en gráfico diario PERIOD_D1 ). Independencia de Temporalidad: Mantiene los cálculos exactos y fijos del periodo que se requiera (la temporalidad macro seleccionada) sin que estos se modifiquen, distorsionen o recalibren indebidamente al
FREE

Institutional Price Discovery & Automated Structure Mapping
The Adaptive Auction Range Engine MT5 is a professional-grade structural mapping tool engineered for traders who specialize in Auction Market Theory , Liquidity Sweeps , and Market Structure Shift (MSS) . Unlike standard fixed-period box drawing indicators that clutter your screen with dead data, this engine tracks the physical footprint of institutional volume footprint in real time. It uses a Price-Adaptive Algorithm that d
FREE

The Moving Averages On-Off let you control the indicator using the keyboard or a button . You can choose if you want the indicator always shown or always hided while switching among different time frames or financial instruments . ---> This indicator is part of Combo Indicator OnOff
It's possible to setup three Moving Averages : Short , Medium , Long
Input You can customize the price type used for calculation : close, open, high, low, median price, typical price, weighted It's
FREE
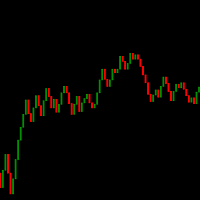
Candle de Volume Coiote O Candle de Volume Coiote é um indicador que mede a variação do volume no tempo, seu corpo é pela variação do volume anterior pelo volume atual, sua direção pelo fechamento do preço.
1. identificado um topo no indicador Candle de Volume Coiote (marcado o fechamento do preço).
2. identificado um fundo no indicador Candle de Volume Coiote (marcado o fechamento do preço).
3. fundo 3 igual fundo 2 no indicador Candle de Volume Coiote, preço no 3 é diferente de fundo 2.
P
FREE

"We have developed a highly accurate trading signal system applicable to all assets on the 15-minute (M15) timeframe. Calibrated against actual Gold price behavior, this system allows users to trade every candlestick effectively, regardless of market conditions—whether the market is trending, moving sideways, or reversing. The system features real-time arrows and color-coded indicators that signal immediate Buy or Sell entry points. This allows traders to use it as a reliable confirmation tool t
FREE
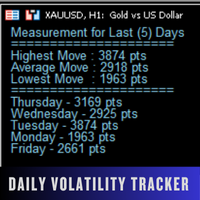
Daily Volatility Tracker is a practical and lightweight indicator designed to help traders monitor and analyze market volatility based on historical daily price movements. Whether you're a day trader, swing trader, or scalper, understanding how much a market moves per day is critical for: Choosing the right pairs to trade Setting accurate stop-loss and take-profit levels Adapting to changing market conditions MT4 Version - https://www.mql5.com/en/market/product/134958/ Join To Learn Market De
FREE

The indicator is built on a principle similar to neural networks, and it calculates a multidimensional polynomial. When you install it on a chart or make changes to the indicator's parameters, or when you switch the chart period, the indicator is initially initialized. During initialization, not only the entire period of the chart is recalculated, but also the indicator is self-trained. The indicator's parameters include Sensitivity, Forecast, and degree of harmonization. The indicator theoretic
FREE

Trend Filter Line is a trend-following tool designed to help traders identify the market's core direction with surgical precision. Based on the popular Two-Pole Filter logic, this indicator eliminates market "noise" and provides a clear, color-coded visualization of the prevailing trend.
Whether you are a scalper, day trader, or swing trader, the Trend Filter Line Pro acts as your primary decision-making filter—ensuring you never trade against the momentum.
How It Works The indicator uses a s
FREE
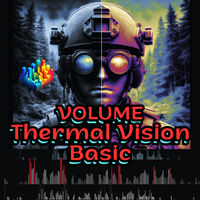
Volume Thermal Vision Basicは、著名なVolume Thermal Visionインジケーターの簡易版であり、ボリュームの強度を実用的かつ効率的に分析したいトレーダーのために設計されています。6種類の鮮やかな色で構成され、StealthMode、NightVision、FrostVisionなどの表示モードを備えています。これにより、ボリュームデータを戦略的かつ視覚的に明確に把握することが可能です。初心者にとっても使いやすく、また上級トレーダーの補助分析ツールとしても最適です。MQL5 Marketで完全版にアップグレードすれば、さらなる機能と分析オプションが利用可能になり、トレード戦略の強化と意思決定の最適化に貢献します。
FREE
MetaTraderマーケットは、開発者がトレーディングアプリを販売するシンプルで便利なサイトです。
プロダクトを投稿するのをお手伝いし、マーケットのためにプロダクト記載を準備する方法を説明します。マーケットのすべてのアプリは暗号化によって守られ、購入者のコンピュータでしか動作しません。違法なコピーは不可能です。

取引の機会を逃しています。
- 無料取引アプリ
- 8千を超えるシグナルをコピー
- 金融ニュースで金融マーケットを探索