Bamboo
- インディケータ
- バージョン: 1.0

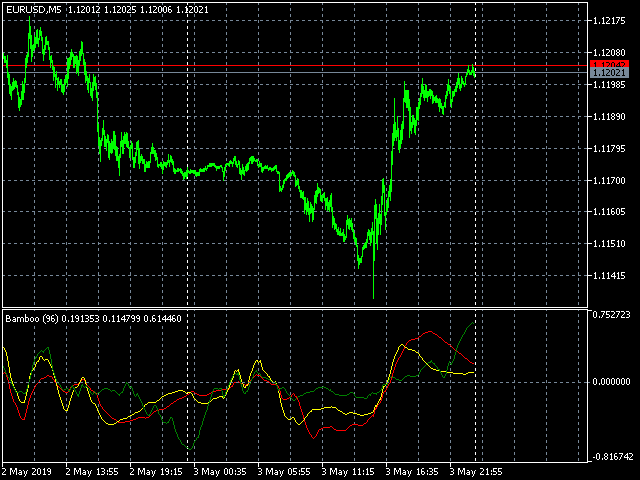
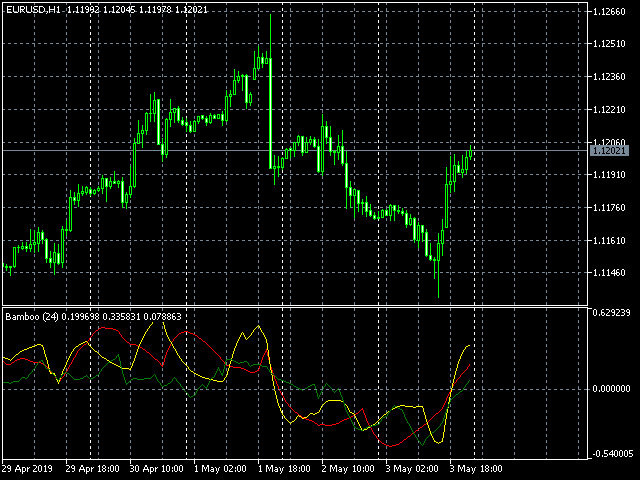
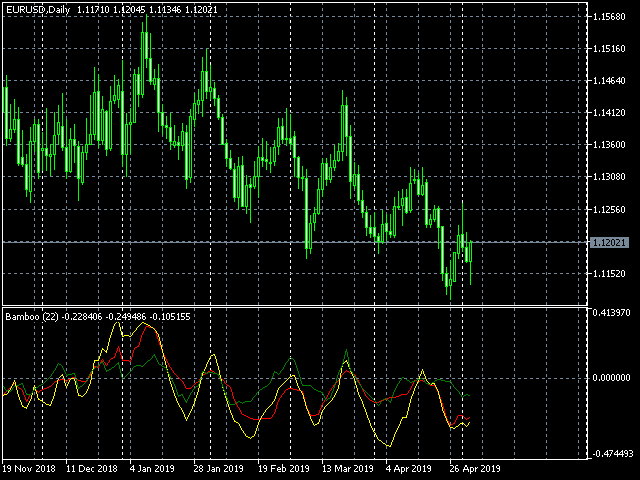
This is an original trend indicator. The indicator draws three lines in a separate window. Its values vary from -1 to +1. The
closer the indicator is to +1, the stronger is the ascending trend. The
closer it is to -1, the stronger is the descending trend. The indicator
can be also used as an oscillator for determining the
overbought/oversold state of the market. The indicator has one input
parameter Period for specifying the number of bars to be used for
calculations.