 MetaTrader 5
 Experts
 지표
 라이브러리
 유틸리티
 위젯
 규칙
MetaTrader 5용 무료 기술 지표 - 64
 기술 지표의 시그널은 주식 및 외환 시장에서 거래를 개시 및 종료하는 데 중요한 역할을 합니다. 지표의 본질은 미래의 가격 변화를 예측하기 위한 금융 시그널 값의 수학적 변형입니다.
기술 지표를 테스트하여 시장 행동과 그로 인한 이익을 더 잘 예측할 수 있습니다.

BodyCandleBreakout – Smart Body Breakout Signal Indicator for MT5 BodyCandleBreakout is a clean, price-action-based indicator that instantly identifies when the current candle's close price breaks beyond the body (high or low) of the previous candle . No repainting. No lag. Just pure, objective breakout signals directly on your chart. Overview Breakouts are among the most reliable price-action signals in trading. But not all breakouts are created equal. BodyCandleBreakout focuses
FREE
Indicator IRush uses a modified version of a popular indicator RSI (Relative Strength Index) to look for entries on a daily chart or lower. The indicator has been set up and tested with the major symbols: AUDUSD, EURUSD, GBPUSD, USDCAD, USDCHF, and USDJPY. An automated trading with this indicator is implemented in the expert advisor Intraday Rush . This expert advisor can open, trail and close its trades. Check it out, it may be exactly what you are looking for!
A Correct Reading of IRush
The c
FREE
NewTest https://backoffice.aurum.foundation/u/DHXP1U
Good afternoon. Today we offer the maxlottomson indicator to determine the maximum volume that you can put up for purchase or sale, if you look at your deposit level. This indicator is convenient to use for News trading, when you need to determine the entry point on a high-speed movement and calculate the risk level as a percentage of the deposit, the maxlottomson indicator shows the maximum value of the LOT volume for your deposit that you
FREE

Account and Trading Dashboard Indicator
The **Account and Trading Dashboard** is a custom MetaTrader 5 (MT5) indicator designed to provide traders with a comprehensive, real-time overview of their account metrics, trading statistics, and technical indicators directly on the chart. It displays essential financial and performance data in a draggable, minimizable, and closable panel, enhancing usability without cluttering the workspace. The indicator supports optional features like ADX and RSI for
FREE
Time to Trade Trading timing indicator is based on market volatility through 2 ATR indicators to determine the timing of a transaction. The indicator determines the times when the market has strong volatility in trend. When histogram is greater than 0 (blue) is a strong market, when histogram is less than 0 (yellow) is a weak market. Should only trade within histograms greater than 0. Based on the histogram chart, the first histogram value is greater than 0 and the second histogram appears, this
FREE
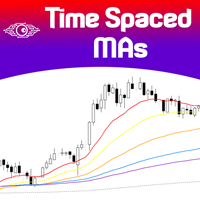
The concept is simple: Plotting Price behavior within several periods of time. Some Symbols behave very well during the trading day - with this I mean Intraday trading - and this behavior ends up plotting effectively well with the proposed Exponential Moving Averages in this indicator... Obviously that this behavior could not be seen in all Symbols, but you can give it a try... Just drop this indicator in a chart and you will see for yourself...
This indicator is intended for "Feeling the Trend"
FREE

Looks for strong price movements and draws levels upon their completion.
You determine the strength of the movement yourself by specifying in the settings the number of points and the number of candles of the same color in a row in one direction.
There are 2 types of building in the settings: extrenum - high / low close - close price You can also adjust the number of displayed levels and the number of candles for calculations.
By default, the settings indicate 5 levels for 360 candles.
That
FREE

The indicator shows the number and ratio of ticks with the price growth and fall for each candle of the chart. The upper part of the histogram in the form of thin lines shows the number of price growth ticks (bullish strength), while the lower part shows the amount of price fall ticks (bearish strength). The thicker histogram bars is the difference between the strength of bulls and bears. A positive difference is displayed in green, and the negative one is red. The strength of bulls increases wh
FREE
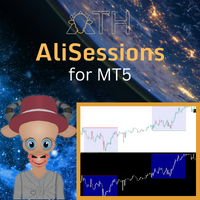
AliSession Highlight is an indicator that highlights a specific period of time according to your preferences. It can help you gain a clear vision of price movements into a specific session, the range of a session, and also to easily identify the high and low of the session. You can use it on any currency pairs, indices, and any timeframes. Settings: Start Hour: Set the hour to initiate the session highlight. Start Min: Set the minute for the start of the session highlight. End Hour: Specify the
FREE

Indicator Description: Market Session Overlay The Market Session Overlay indicator for MT5 visually highlights the key global trading sessions — Asian, European, and American — directly on your chart.
It allows traders to clearly identify the time ranges of each session and their respective highs, lows, and opening levels, improving session-based analysis and strategy execution. Features: Draws colored rectangles for each session (Asian, European, American) on the chart.
Configurable se
FREE

Introducing the “Symbol Cost Info MT5” indicator – your ultimate tool for staying ahead in the forex market! This innovative indicator is designed to empower traders with real-time cost information, directly on their charts. Here’s why every trader needs the “Symbol Cost Info MT5” in their arsenal: Real-Time Spread Monitoring : Keep a close eye on the spread for any currency pair, ensuring you enter the market at the most cost-effective times. Pip Value at Your Fingertips : Instantly know the v
FREE

Projection of Phi Is a technical indicator that calculates dynamic support and resistance levels. It uses angular geometric projections and mathematical ratios to identify market expansion ranges. Features: Dynamic Fibonacci Expansion: Extension level projection Geometric Calculation: Angular analysis and mathematical ratios Visualization: Graphical objects with informative labels Compatibility: M1 to H4 timeframes Applications: Identification of zones for trade management Analysis of volatil
FREE
Indicator alerts for Dual Relative strength index rsi. Large rsi preset at 14 is below 30 small rsi preset at 4 is below 10 for buy bullish signals .
Large rsi preset are 14 is above 70 small rsi preset at 4 is above 90 for sell bearish signals . Includes mobile and terminal alerts. draws lines when alerts.
This indicator can help identify extremes and then the tops or bottoms of those extremes .
FREE
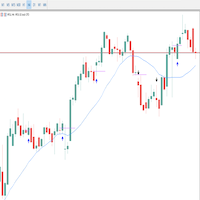
Multset This is inte_plays indicator, which helps the trader to enter the trades appropriately it plots an arrow when there is appropriate environment which permits trading
Features 1. Sends push notification on mobile devices 2. Plots arrow on chart when the setting is found
TimeFrame Is suggested to be used on higher time frames only, especially starting 15min and above for proper moves
For more informations please Visit: https://t.me/Tz_Fx_Lab Subscribe to our Youtube channel: https:
FREE
Range Pullback Limits – Smart Buy/Sell Zone Indicator for MT5 Range Pullback Limits is a professional MT5 indicator that automatically marks potential Buy Limit and Sell Limit levels during ranging markets. It helps traders identify high-probability pullback zones and avoid trading when the market is trending strongly. *Note: Combine this indicator to filter entry points - https://www.mql5.com/en/market/product/149443 Key Features Works on Forex, Gold (XAUUSD), Crypto, Indices, Stocks Detects r
FREE

Volatility and Financial Volume Indicator This indicator was developed to assist in analyzing price volatility , identifying periods of band contraction and expansion , together with color changes associated with financial volume behavior. The system highlights regions where a significant increase in volume occurs, allowing traders to observe potential areas of interest for trend continuation or trend reversal studies. The analysis is primarily focused on the M15 and M5 timeframes , allowing use
FREE

MultiTimeframe Trend Pro shows you the market direction across 7 timeframes at a glance. Clear colors, no repainting, fully customizable. Perfect as a quick filter for any intraday or swing strategy.
Key Features Supports M1, M5, M15, H1, H4, D1 and W1
Colors MediumSeaGreen when the close is above the MA, and Red when below
No repainting → always based on the last closed candle for each timeframe
Fully customizable: MA period (200 by default) font, size and colors X/Y offsets, spacing
FREE

Chart Status Bar MT5는 차트에서 시장, 연결 상태 및 심볼 정보를 직접 표시하는 완전한 읽기 전용 정보형 인디케이터입니다.
컴팩트 바에는 다음 정보가 표시됩니다: • 브로커 거래 시간과 다음 세션 전환; • 터미널 연결 상태; • 마지막 Tick 이후 경과 시간; • 현재 스프레드(points / pips); • 현재 캔들의 남은 시간; • 거래 서버 시간.
DETAILS 패널에는 추가로 다음 정보가 표시됩니다: • 심볼 거래 모드; • 최소, 단계 및 최대 거래량; • Stop 및 Freeze 레벨; • Tick Size 및 Tick Value; • Contract Size; • 일일 범위 및 변동률; • 실행 이후 최소, 평균 및 최대 스프레드; • 기준 거래량의 예상 스프레드 비용; • 기준 거래량의 예상 마진; • Long/Short Swap 및 트리플 스왑 요일; • 서버, 로컬 및 UTC 시간; • 기준통화, 손익통화 및 마진통화; • 브로커가 제공하
FREE
Simple alternate MACD version like the one used in tradingview. Two lines (MACD & signal line) and a histogram. This MACD version can be used in many different ways. Potential trades are the crossing of the MACD & signal line, the crossing of the MACD through the 0-line of the histogram, the MACD being under the 0-line of the histogram or the movement of the histogram itself. A combination of these potential signals on different timeframes can be very precise, but always needs additional confirm
FREE
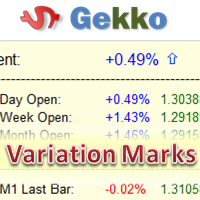
This is Gekko's indicator of quotations and variations. It summarizes quotations and variations of the current symbol in different timeframes as well as other correlated symbols. Keep track of all this information on your chart while you are negotiating for decision making support. Input Parameters General Settings: configure which quotations and variations you want to keep track for current day, week, month or year as well as M1, M5, M15, M30, H1 and H4 charts; Symbols Configuration: add up to
FREE

This is an original trend indicator. The indicator draws three lines in a separate window. Its values vary from -1 to +1. The closer the indicator is to +1, the stronger is the ascending trend. The closer it is to -1, the stronger is the descending trend. The indicator can be also used as an oscillator for determining the overbought/oversold state of the market. The indicator has one input parameter Period for specifying the number of bars to be used for calculations.
FREE

The indicator uses moving average reversal values on all selected timeframes to plot levels where the moving average has reversed, which can be considered support or resistance levels, as well as trend change signals on the timeframe of the newly drawn line. The moving average is passed through the RSI indicator.
The line colors are customizable and, by default, indicate the following: 1. Purple - the moving average has changed direction downwards. 2. Gold - the moving average has changed di
FREE

Normal Parabolic SAR with label of long or short state. Tells also "Parabolic long" and "short". Can be used in multitimeframe layouts together with Swiss HolyGrail indicator or in different timeframes. So, if all the indicators show "long" or "short" you can be sure that the risk of a wrong direction is small. The standard values for Parabolic SAR are 0.02 for step and 0.2 for maximum. You may experiment with changing the maximum to get smother curves. Note that changes in parabolic SAR are la
FREE

The Volunacci indicator is a custom technical analysis tool designed for MetaTrader 5. It combines volume analysis with Fibonacci retracement principles. In essence, it displays the current volume as a colored histogram within its own window. The unique feature is that it calculates a recent volume range (high and low over a user-defined period) and then projects key Fibonacci retracement levels (23.6%, 38.2%, 50%, 61.8%, 100%) onto this range. The color of the volume histogram changes dynam
FREE

Indicador Regressão Linear – Par de Ativos Indicador é um oscilador que faz o plot do Resíduo resultado da regressão linear entre os dois ativos inseridos como input do indicador, representado pela fórmula: Y = aX + b + R Onde Y é o valor do ativo dependente, X é o valor do ativo independente, a é a inclinação da reta entre os dois ativos, b é a intersecção da reta e R é o resíduo. O resíduo representa a quantidade da variabilidade que Y que o modelo ajustado não consegue explicar. E os resíduos
FREE

Trader’s Cockpit is a simple non directional dashboard for MetaTrader 5 designed to give traders a quick, clear view of their trading environment directly on the chart. Creator: https://www.quant-atlas.com/ The indicator does not generate buy or sell signals, does not predict market direction, and does not perform any trading action. Its purpose is to make the trader’s daily workflow easier by centralizing useful account, symbol, spread, session, and broker condition information in one compact
FREE

Sniper Spread Monitor v1.0 ¿Qué es el Spread y por qué es vital monitorearlo? En el trading, el Spread es la diferencia entre el precio de compra ( Ask ) y el precio de venta ( Bid ). Es, en esencia, el costo inmediato que pagas al bróker por abrir una operación. Para un trader de precisión, el spread no es solo un número; es un factor crítico por tres razones: Costo de Ejecución: Un spread alto significa que empiezas la operación con una pérdida mayor. En estrategias de scalping o entradas prec
FREE

Indicator Description This indicator monitors overbought and oversold levels , combining technical indicator signals with financial volume analysis in the regions marked on the chart. The system was primarily developed to support Swing Trading and Position Trading , using the H1 timeframe as its main reference. It is designed to help traders analyze areas where price may show changes in behavior, continuation, or loss of momentum. The marked regions should be used as areas for study and monitori
FREE

This indicator shows the strength of each currency compared to the US dollar by calculating the rate of change in price over a specified time period. When you open the indicator, you'll see a list of different currencies on the price chart. Each currency will have a numerical value indicating its strength level compared to the US dollar, where: If the value is higher than the US dollar, it will be displayed in green, meaning that currency is stronger than the dollar. If the value is lower than t
FREE
Price Edge – 시장이 움직이기 전에 가격을 확인하세요 트레이딩에서 단 1초가 수익 거래와 기회를 놓친 거래의 차이를 만들 수 있습니다 .
**MetaTrader 5 (MT5)**의 Price Edge 를 사용하면 더 이상 틱을 놓치지 않습니다. Price Edge 는 단순한 지표가 아니라, 당신의 트레이딩 우위입니다.
실시간 가격 업데이트 를 제공하여 항상 정확하고 빠르며 자신감 있는 의사결정을 가능하게 합니다. Price Edge를 선택해야 하는 이유 Live Price Indicator MT5 – 매수 가격을 즉시 확인
MetaTrader 5 실시간 가격 – 초고속 업데이트
트레이딩 스타일에 맞게 완전히 커스터마이즈 가능
가벼운 성능 – 플랫폼 속도 저하 없음
소수점 단위까지 정확, 외환(Forex), 금, 암호화폐, 지수에 최적
스캘핑, 데이 트레이딩, 단기 차트 에 이상적 인간은 명확성에 반응합니다… Price Edge 는 가격을 실제
FREE

Kito Market Structure Counter is a clean MT5 indicator that automatically identifies confirmed swing structure and tracks consecutive Higher Highs (HH), Higher Lows (HL), Lower Highs (LH), and Lower Lows (LL) . It displays the current market bias — Bullish, Bearish, Bullish Lean, Bearish Lean, or Mixed — in a compact on-chart panel, together with the latest swing relationships and structure sequence counts. The indicator uses confirmed closed-bar swings , helping prevent published swing points f
FREE

Automate Your Strategy! Use the Daily Drop Analyzer Expert Advisor to automatically execute the strategy, with configurable filters, parameters, and order management.
Check it out here: Daily Drop Analyzer EA
The Step Analysis Indicator performs an automated backtest of a simple daily strategy: buy when the price drops a certain percentage from the previous close and sell at the same day's close (or vice versa for short strategy). It tests multiple entry percentages ("steps") and displays the
FREE
The Volume Heatmap indicator visually shows the INTENSITY of the volume taking into account the concept of standard deviation. Purpose of the Indicator: High volumes are common where there is a strong consensus that prices will increase. An increase in volume often occurs at the beginning of a new upward trend in the price of an asset. Some technical analysts do not rely on trend confirmations without a significant increase in volume. Low volumes usually occur when an asset is heading for a down
FREE

# MASignalPanel — Multi-MA Signal Panel with Trend Filter ## Overview MASignalPanel is an all-in-one moving-average signal indicator designed for MetaTrader 5. It combines up to three moving averages (SMA, EMA, SMMA, LWMA) with four trade signal modes — Cross, Breakout, Pullback and Channel — and adds a higher-timeframe trend filter line (default EMA240) to keep you on the right side of the market. A fully interactive control panel lets you change MA type, MA count, periods, s MA indicator, movi
FREE

Wilder Trend Indicator (MT5) The Wilder Trend Indicator is a clean and lightweight trend-following tool based on Wilder’s Moving Average smoothing method .
It visually highlights market direction by separating uptrend and downtrend movements directly on the price chart. The indicator is designed to be simple, flexible, and non-intrusive , making it ideal for discretionary traders who want clear trend confirmation without cluttering the chart. Key Features Uses Wilder-style smoothing for st
FREE
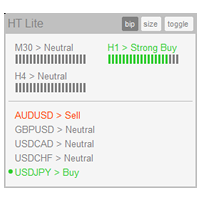
The indicator High Trend Lite monitors 5 symbols in up to 3 timeframes simultaneously and calculates the strength of their signals. The indicator notifies you when a signal is the same in different timeframes. The indicator can do this from just one chart. Therefore, High Trend Lite is a multicurrency and multitimeframe indicator. With the High Trend Pro , available at this link , you will have an unlimited number of symbols, 4 timeframes, a colourful chart of the primary MACD indicator, several
FREE

LogVar 지표는 가격의 로그 수익률(Logarithmic Return) 을 계산하고 시각적으로 표시하는 고급 분석 도구입니다.
이는 단순한 백분율 변화보다 훨씬 정밀하게 시장의 실제 움직임을 보여 주며, 특히 변동성이 큰 시장이나 장기 추세 분석에서 뛰어난 안정성과 신뢰성을 제공합니다. 이 지표는 현재 종가와 n 기간 전 종가( iPeriod )를 비교하여 그 비율의 로그 값을 계산하고, 결과를 확대된 로그 스케일로 차트에 표시합니다.
이를 통해 미세한 가격 변화도 쉽게 파악할 수 있으며, 상승과 하락의 흐름이 명확하게 드러납니다. 라인 색상은 자동으로 변합니다: 녹색: 상승 추세 (현재 가격이 기준보다 높음) 빨강: 하락 추세 (현재 가격이 기준보다 낮음) 가운데의 0선 은 중립선 역할을 하며, 양의 변동과 음의 변동을 직관적으로 구분합니다. 주요 특징: 실제 로그 변화율 계산 (단순 백분율 아님) 자동 시각 스케일 조정 및 선명한 표시 상승/하락에 따른 동적 색상 변화
FREE

ViewTrend The ViewTrend indicator provides a visual interpretation of market conditions by coloring the candles and the moving average line based on defined technical criteria. ️ How does it work? The agorithm analyzes the relationship between the current closing price, the previous closing price, and the behavior of a simple moving average (SMA). Based on this analysis, the indicator colors the candles and the moving average line according to the technical scenario observed: Blue — Suggesti
FREE

Trading Session Activity Dashboard
TAGLINE
Trade the session, not just the candle.
PRODUCT OVERVIEW
SessionEdge Navigator MT5 is a session-analysis indicator for MetaTrader 5. It tracks the major trading sessions and provides a practical dashboard showing whether a session is active, how much range it has produced, how that range compares with its recent average, and whether current session behavior is bullish, bearish, or range-like.
Covered sessions: - Sydney - Tokyo / Asian - London - N
FREE

If you like this product, please give it a 5 star rating as a token of appreciation.
This indicator plots horizontal trend lines at the opening price of each quarter (Q1–Q4) on the chart. These lines visually represent quarterly open levels of the current year, which traders often use as support/resistance or reference points. Automatically plots Q1–Q4 opening levels as trend lines on the chart. Lines are dashed, colored, and labeled. Handles both current and historical quarters. Cleans up line
FREE

본 상품은 브로커 서버의 시간대를 기준으로 15개국의 거래 세션을 표시하고 원하는 설정에 따라 다양한 표시 모드를 표시하여 차트 혼잡을 방지하고 사용자가 원하는 시간으로 세션을 설정할 수 있도록 설계되었습니다.
외환 시장에서는 해가 지지 않지만 그 리듬은 각기 다른 거래 세션의 비트에 맞춰 춤을 춥니다. 이러한 세션, 겹치는 부분 및 독특한 분위기를 이해하는 것은 시장에 반대하지 않고 함께 움직이기를 원하는 외환 거래자에게 매우 중요합니다.
Tokyo China London Canada New York Moscow Saudi Arabia ... USDJPY *** *
***
AUDJPY ***
NZDUSD *
***
EURAUD
**
GBPUSD
***
***
EURCHF
***
USDCHF
*
***
GBPJPY *** ***
FREE

Prop Guardian — 일일 손실 및 드로다운 모니터 (무료) OneFunded가 자체 발표한 데이터에 따르면, 프랍 펌(prop-firm) 평가에서 탈락하는 이유의 78.7%는 전체 드로다운이 아닌 '일일 손실 한도 초과' 때문입니다. 대부분의 트레이더는 전략이 실패해서 잃는 것이 아니라, 가장 중요한 단 하나의 숫자가 결정적인 순간에 화면에 보이지 않았기 때문에 실패합니다. Prop Guardian은 그 숫자를 당신의 화면 위에 바로 보여줍니다. 주요 기능 일일 손실 한도와 최대 드로다운을 금액 및 퍼센트(%)로 실시간 병렬 추적 트레이더가 설정한 건당 리스크(Risk-per-trade)를 바탕으로 남은 허용 손실금을 '남은 손실 거래 횟수'로 환산 3가지 드로다운 모드 지원: 고정(static), 트레일링(trailing), 트레일링 잠금(trailing-with-lock) — 각 프랍 펌의 실제 규칙 정의에 정확히 부합 한도에 도달한 후가 아니라 접근하기 전에 알려주는
FREE
MultiFrame MA: A Multi-Timeframe Trend Indicator MultiFrame MA is a trend analysis indicator designed to provide a comprehensive market overview across various timeframes. Instead of relying on a single timeframe, this tool synthesizes information from multiple charts, giving users a holistic and reliable perspective. KEY FEATURES: Multi-Timeframe Analysis: The indicator analyzes data from various timeframes, from M1 up to Monthly, to help users identify trend confluence at different levels. MA
FREE
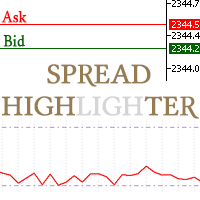
This spread indicator displays the actual spread of each candle. It highlights the maximum spread and the minimum spread of the chosen symbol. This indicator is very helpful to see in real time the spread evolution helping to avoid taking a trade when the spread is too high.
Inputs:
Print value in Points: if true displays the spread as a whole number
D isplay minimum and maximum spread of the past N days: select the number of days to consider the maximum and minimum spread
Automatically adj
FREE

The indicator makes calculations based on data obtained from one of seven (7) moving averages and colors the chart.
Simple moving averages are those that have only one important calculation parameter - the period.
The shift in the indicator is not used.
There is a shift trick setting, it is used to smooth the result of calculations. You can see the changes if you reduce this parameter to 1 (minimum value).
shift trick must always be less than the period value.
Available averages:
MA Simpl
FREE
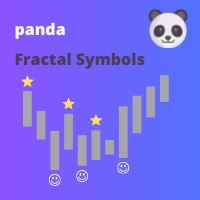
This indicator displays fractal symbols and bars Use this indicator to show different symbols for bearish and bullish fractals: Choose from 144 symbols (refer to table below) Colors, size and offset of fractals can be modified Fractal price bar or candle color can be changed Hide fractals and show fractal price bar only Frequency in fractal calculation can be changed
How to use 1. Select which symbols to use for bearish and bullish fractals; 2. Select which colors to use for bearish and bullis
FREE

Are you a scalper? This indicator reviews all 15 minute time frame and lets you set you range with an alert for when locked range is broken. This indicator, engineered for the Phoenix Trading 2026 suite, is a professional-grade Multi-Timeframe (MTF) Liquidity & Trend Dashboard. It is designed for high-precision scalping on Gold (XAUUSD) and Major Forex pairs, specifically targeting traders who operate on the 1-minute and 5-minute charts but need higher-level institutional context. Core Features
FREE
NewTest https://backoffice.aurum.foundation/u/DHXP1U
The 2indtompson indicator is an indicator for comparing two instruments for determining volumes, for balancing in pair trading or arbitrage trading, prepared from an analog version for the MT4 terminal. So if you need to compare how much two instruments will weigh and you don't know how to do it, then put an indicator on the chart and it will automatically calculate the volumes needed for balancing. Additionally, the indicator shows the stat
FREE

TrendView — Clear Trend Visualization for Confident Trading
TrendView is a free trend indicator designed to give traders a clean and reliable view of market direction. It displays clear trendlines in three colors, making it easy to identify bullish, bearish, and neutral phases without cluttering the chart with unnecessary elements. Whether you are monitoring long-term market structure or short-term price action, TrendView helps you keep your focus on the bigger picture. For traders who also w
FREE

DYNAMIC BALANCE MATRIX (SK Edition) — The Ultimate Multi-Timeframe Analytical Engine DYNAMIC BALANCE MATRIX is a professional-grade decision-making tool. This indicator acts as your "Control Tower," scanning up to 21 timeframes simultaneously and condensing market dynamics into a single, actionable numerical value — the Total Score . Interface & Control Buttons Timeframe Buttons (M1-MN1): Click to "Pin" a timeframe. Only active (selected) timeframes contribute to the Total Score . MENU / H
FREE

The X-21 TrendSync Elite is an advanced indicator designed for traders seeking precise trading decisions based on multiple technical indicators. Operating in a separate window, it integrates Stochastic, RSI, and CCI indicators (in two variants: Trigger CCI for entries and Trend CCI for trends) to provide clear visual signals for buying, selling, or waiting. With support for nine timeframes (M1, M5, M15, M30, H1, H4, D
FREE

️ RISK MANAGER — Risk Management Indicator Indicator version: 1.70 · Style: QuikTrade · Position: bottom-left corner of the chart 1. What it is Risk Manager is an informational indicator for MetaTrader 5 that shows the daily risk budget in real time and helps calculate the recommended lot , taking into account: risk per single trade (% of balance); daily risk (% of balance); losses and profits already realized today; risk of open positions (based on their Stop Loss); distance
FREE

The Average Directional Index (ADX) is a technical analysis indicator developed by J. Welles Wilder in 1978. Its primary function is to measure the strength of a trend, regardless of its direction, and to determine whether the price has entered a sideways trend. It is also mentioned by John Murphy in *The Visual Investor* (2005) as an indicator that helps determine whether a market is ranging or is about to start a new trend. As for Exponential Moving Averages (EMAs), some authors believe that
FREE

パラボリックのデータをもとにトレンドの方向性を1分足から月足まで表示します。 1分足から 月足 まで表示されているので今どの方向に価格が動いているのかがすぐに分かります。
更新はティク毎ではなくディフォルトでは1秒毎、もちろん変更も可能なのでチャートの表示が遅くなるようなことはありません。
機能:
どの通貨でも表示可能になります。
アイコンの色を指定することが可能になります。
表示位置(X軸、Y軸)が変更可能 になります。
表示位置 (左上 、 右上 、 左下 、 右下) が 指定 が可能 になります。
フォント を指定することが可能になります。
フォントサイズ が 変更可能 になります。
アイコンのサイズ が 変更可能 になります。
週足、 月足 の非表示 が 可能 になります。
FREE
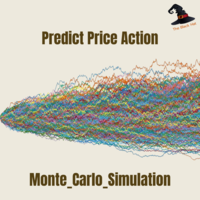
Monte Carlo simulation is an Indicator that uses a Monte Carlo model to calculate the probability of the price going up or down. If the price has a probability of going up or down more than 90%, the system will enter a trade by doing a back test of gold assets. It was found that it was able to generate a return of more than 20% in a period of 5 months while having a MAX DD of less than 7%.
What is a Monte Carlo simulation?
A Monte Carlo simulation is a model used to predict the probability of
FREE

Drawdown Guard is a free MetaTrader 5 dashboard that tracks your daily and weekly equity drawdown against your own limits — and warns you before you breach them. Works alongside any trading style, manual or automated, and any strategy: it doesn't care how you trade, only how much you've lost so far.
What it does: - Daily loss limit tracking — set a % of balance or a fixed $ amount; the dashboard shows your current day's P&L against it in real time. - Weekly loss limit tracking — same idea, tra
FREE

AI Multi Timeframe Oscillator Heatmap combines RSI and Stochastic readings across six timeframes at once - M15, M30, H1, H4, D1, and W1 - into a single, instantly-readable, color-coded panel. Instead of switching charts to check whether momentum agrees across timeframes, you see the full picture in one glance. KEY FEATURES
- Calculates live RSI and Stochastic values on six timeframes simultaneously (M15 through W1) for the current chart's symbol.
- Color-codes every row by combined momentum read
FREE
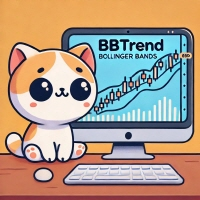
BBTrend is a powerful trend analysis tool designed to provide a clear overview of market volatility and trends at a glance.
This indicator calculates the difference between two Bollinger Bands of different periods,
visually indicating the strength of upward or downward trends to traders. Clear Trend Visualization: The upward trend is represented in green, and the downward trend in red,
allowing traders to intuitively grasp the direction and strength of the trend. Standardized Percentage Disp
FREE

EMA 200 Entry Strategy The 200 Exponential Moving Average (EMA) is a powerful indicator used to identify the overall market trend and high-probability trade entries. It acts as a dynamic support and resistance level, helping traders align with institutional market direction. When price is trading above the EMA 300 , the market is considered to be in a strong uptrend . In this condition, traders should focus only on buy opportunities . A valid entry occurs when price pulls back toward the EMA 200
FREE

ATR Short Box Anchor MT5 ATR Short Box Anchor MT5 is a visual risk-reward indicator for MetaTrader 5, specifically designed for planning short setups. The indicator creates an ATR-based short box directly on the chart, including entry, stop-loss zone, take-profit zone, and optional risk-reward information. The indicator works with a freely movable anchor point. This anchor defines the desired entry price and the candle whose ATR value is used for the calculation. This allows a short setup to be
FREE

Three Anchors On One Chart Most volume weighted average lines restart once a day. This one draws three at the same time: one anchored to the current trading session, one to the day, one to the week. Their spread tells you something a single line cannot. When the session line sits far under the weekly one, the week has been trading higher than today is; when all three sit together, the market has spent the week in one place. Why The Session Anchor Is Not Midnight The session line starts where the
FREE

Características Principales 1. Medía Móvil Multi-Timeframe (MTF) con Estabilidad Temporal EMA Macro ( InpMATimeframe ): Permite proyectar y visualizar en el gráfico actual una Media Móvil Exponencial (EMA) calculada desde una temporalidad superior (por defecto en gráfico diario PERIOD_D1 ). Independencia de Temporalidad: Mantiene los cálculos exactos y fijos del periodo que se requiera (la temporalidad macro seleccionada) sin que estos se modifiquen, distorsionen o recalibren indebidamente al
FREE

Institutional Price Discovery & Automated Structure Mapping
The Adaptive Auction Range Engine MT5 is a professional-grade structural mapping tool engineered for traders who specialize in Auction Market Theory , Liquidity Sweeps , and Market Structure Shift (MSS) . Unlike standard fixed-period box drawing indicators that clutter your screen with dead data, this engine tracks the physical footprint of institutional volume footprint in real time. It uses a Price-Adaptive Algorithm that d
FREE

The Moving Averages On-Off let you control the indicator using the keyboard or a button . You can choose if you want the indicator always shown or always hided while switching among different time frames or financial instruments . ---> This indicator is part of Combo Indicator OnOff
It's possible to setup three Moving Averages : Short , Medium , Long
Input You can customize the price type used for calculation : close, open, high, low, median price, typical price, weighted It's
FREE
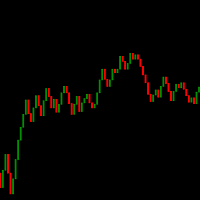
Candle de Volume Coiote O Candle de Volume Coiote é um indicador que mede a variação do volume no tempo, seu corpo é pela variação do volume anterior pelo volume atual, sua direção pelo fechamento do preço.
1. identificado um topo no indicador Candle de Volume Coiote (marcado o fechamento do preço).
2. identificado um fundo no indicador Candle de Volume Coiote (marcado o fechamento do preço).
3. fundo 3 igual fundo 2 no indicador Candle de Volume Coiote, preço no 3 é diferente de fundo 2.
P
FREE

"We have developed a highly accurate trading signal system applicable to all assets on the 15-minute (M15) timeframe. Calibrated against actual Gold price behavior, this system allows users to trade every candlestick effectively, regardless of market conditions—whether the market is trending, moving sideways, or reversing. The system features real-time arrows and color-coded indicators that signal immediate Buy or Sell entry points. This allows traders to use it as a reliable confirmation tool t
FREE
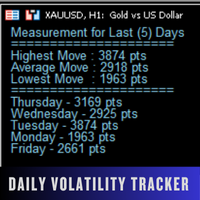
Daily Volatility Tracker is a practical and lightweight indicator designed to help traders monitor and analyze market volatility based on historical daily price movements. Whether you're a day trader, swing trader, or scalper, understanding how much a market moves per day is critical for: Choosing the right pairs to trade Setting accurate stop-loss and take-profit levels Adapting to changing market conditions MT4 Version - https://www.mql5.com/en/market/product/134958/ Join To Learn Market De
FREE

The indicator is built on a principle similar to neural networks, and it calculates a multidimensional polynomial. When you install it on a chart or make changes to the indicator's parameters, or when you switch the chart period, the indicator is initially initialized. During initialization, not only the entire period of the chart is recalculated, but also the indicator is self-trained. The indicator's parameters include Sensitivity, Forecast, and degree of harmonization. The indicator theoretic
FREE

Trend Filter Line is a trend-following tool designed to help traders identify the market's core direction with surgical precision. Based on the popular Two-Pole Filter logic, this indicator eliminates market "noise" and provides a clear, color-coded visualization of the prevailing trend.
Whether you are a scalper, day trader, or swing trader, the Trend Filter Line Pro acts as your primary decision-making filter—ensuring you never trade against the momentum.
How It Works The indicator uses a s
FREE
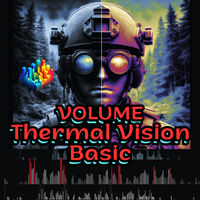
Volume Thermal Vision Basic은 널리 알려진 Volume Thermal Vision 지표의 간소화된 버전으로, 거래량 강도를 실용적이고 효율적으로 분석하려는 트레이더를 위해 설계되었습니다. 총 6가지 생생한 색상 수준을 제공하며, StealthMode, NightVision, FrostVision 모드를 통해 거래량 데이터를 명확하고 전략적으로 시각화할 수 있습니다. 이 인디케이터는 가볍고 직관적인 인터페이스로 초보자에게 이상적이며, 숙련된 트레이더의 분석 도구로도 매우 유용합니다. MQL5 Market에서 전체 버전으로 업그레이드하면, 고급 기능과 다양한 시각화 옵션을 통해 트레이딩 결정을 보다 효과적으로 내릴 수 있습니다. 거래 전략 최적화에 유용한 도구입니다.
FREE
MetaTrader 마켓은 거래로봇과 기술지표를 판매하기에 최적의 장소입니다.
오직 어플리케이션만 개발하면 됩니다. 수백만 명의 MetaTrader 사용자에게 제품을 제공하기 위해 마켓에 제품을 게시하는 방법에 대해 설명해 드리겠습니다.
