CoralDash

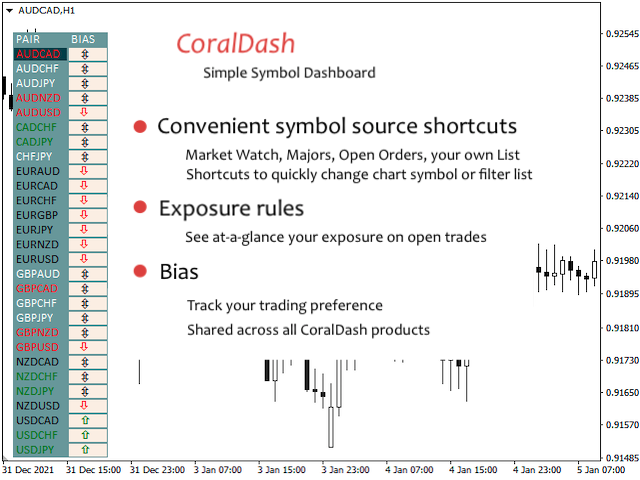
CoralDash is a simple symbol shortcut dashboard.  

  • The Symbol List has many presets to choose from: 
    • Market Watch
    • Open Orders
    • Current Chart
    • Majors
    • A custom list
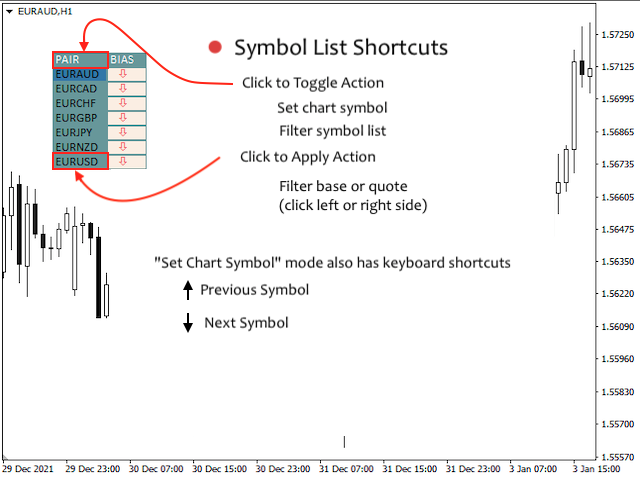
  • Clicking the symbol has two available actions
    • Set the current chart symbol
    • Filter the list of symbols shown in the dashboard based on one currency (e.g., see all EUR pairs)
    • Click the "PAIR" cell in the header to toggle between the two available actions
    • Click the symbol cell to apply the action
    • For the filter, click the left side to select the base currency; click the right side to see the quote currency
  • Keyboard arrows navigate up/down the symbol list
    • It has never been easier to quickly monitor multiple symbols!
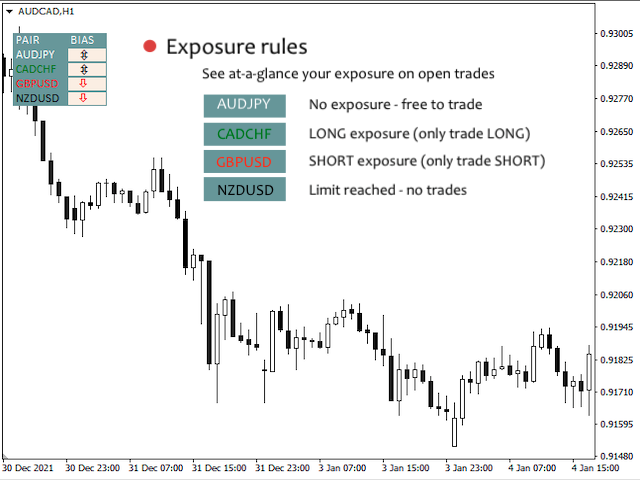
  • Symbols can show your current exposure, so you can quickly see what trades you can still safely take
    • Set your exposure limit (e.g., no more than 2 trades on different symbols with EUR)
    • Automatically updated, no action required (or turn it off if you don't want it)
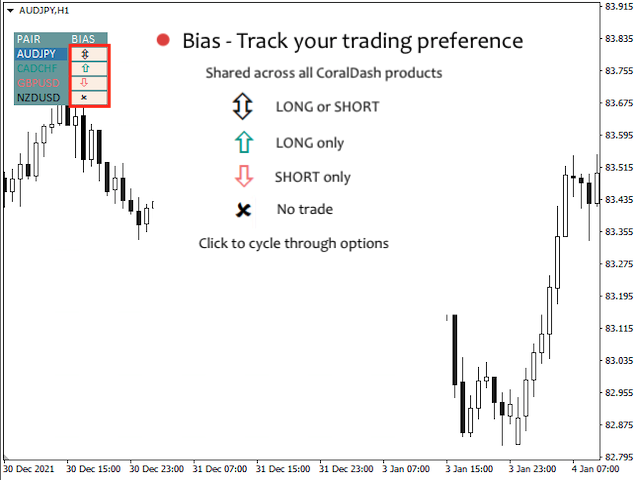
  • The "BIAS" column lets you track your current trading preference for a given symbol
    • Click to toggle through the options
    • Handy for performing a daily review of all symbols you're currently trading and recording your preference
    • As trade setups become available, quickly review your exposure and trading bias to see if you should enter a trade
CoralDash is completely free.  It started out as a testing indicator for the base functionality of all of my indicators that use a list of symbols in a table, but I found that I actually really like being able to use it for my daily review of my charts and trading bias, so I decided to make it available here.  The data in the "BIAS" column is shared across all CoralDash products, set it once and see it everywhere.  If you like this dashboard, please take a look at my other products!


おすすめのプロダクト
マトリックスアローインジケーターマルチタイムフレームパネルMT4 は無料のアドオンであり、マトリックスアローインジケーターMT4の優れた資産です。これは、5つのユーザーがカスタマイズした時間枠と合計16の変更可能なシンボル/機器の現在のマトリックスアローインジケーターMT4信号を示しています。ユーザーは、マトリックスアローインジケーターMT4で構成される10の標準インジケーターのいずれかを有効/無効にするオプションがあります。マトリックスアローインジケーターMT4のように、10の標準インジケーター属性もすべて調整可能です。マトリックスアローインジケーターマルチタイムフレームパネルMT4には、16個の変更可能なシンボルボタンのいずれかをクリックすることで、現在のチャートを変更するオプションもあります。これにより、異なるシンボル間ではるかに高速に作業でき、取引の機会を逃すことはありません。 この無料の マトリックスアローインジケーターマルチタイムフレームパネルMT4 アドオンを使用する場合は、ここでマトリックスアローインジケーターMT4を別途購入する必要があります: https://w
FREE
Show Pips
Roman Podpora
4.26 (58)
この情報インジケーターは、アカウントの現在の状況を常に把握したい人にとって役立ちます。このインジケーターには、ポイント、パーセンテージ、通貨での利益、現在のペアのスプレッド、現在の時間枠でバーが閉じるまでの時間などのデータが表示されます。 バージョンMT5 -   より便利なインジケーター チャート上に情報線を配置するには、いくつかのオプションがあります。 価格の右側 (価格の後ろにあります); コメントとして (グラフの左上隅に); 画面の選択した隅。 情報区切り記号を選択することもできます。 | / 。 \ # インジケーターにはホットキーが組み込まれています。 キー 1 - 情報表示の種類に戻ります (価格、コメント、コーナーの右側) キー 2 - 情報表示の種類を 1 つ進みます。 キー 3 - 情報ライン表示の位置を変更します。 ホットキーは設定で再割り当てできます。 このインジケーターは使いやすく、非常に有益です。設定で不要な情報項目を無効にすることも可能です。 設定 表示された情報を置き換えるホット キー (戻る)   - 情報表示の種類に戻ります。 表示情報を切り替
FREE
ReviewCandleChart is a unique product that can verify past price fluctuations using candlestick charts. This indicator accurately reproduces market price fluctuations in the past and can make trading decisions (entries, profits, loss cut) many times so that you can learn the trading faster. ReviewCandleCahrt is the best indicator to improve trading skills. ReviewCandleCahrt caters to both beginners and advanced traders. Advantages of the indicator This Indicator for verifying price fluctuation
FREE
マルチタイムフレーム対応、カスタマイズ可能なビジュアル信号、設定可能なアラートシステムを備えた相対力指数(RSI)インジケーター。 フリーランスプログラミングサービス、アップデート、その他のTrueTL製品は私の MQL5プロフィール からご利用いただけます。 フィードバックとレビューを心よりお待ちしております! RSIとは? 相対力指数(RSI)は、価格変化の速度と大きさを測定するモメンタムオシレーターです。このインジケーターは0から100の間で振動し、指定された期間にわたって最近の上昇幅と最近の下落幅の大きさを比較します。 RSIは主に買われすぎと売られすぎの状態を識別するために使用されます。高い値は買われすぎ状態を示し、低い値は売られすぎ状態を示します。トレーダーはまた、RSIと価格動作の間のダイバージェンスにも注目しており、これは潜在的なトレンド転換を示す可能性があります。 機能: 矢印と垂直線を使用したビジュアルシグナルマーカー 設定可能なトリガー付きの3つの独立したシグナルバッファ(方向変化、レベル交差、ピーク/谷、極端ゾーン) 時間帯フィルタリング付きの設定可能なア
FREE
FFx RVI
Eric Venturi-Bloxs
5 (1)
The purpose of this new version of the MT4 standard indicator provided in your platform is to display in a sub-window multiple timeframes of the same indicator. See the example shown in the picture below. But the display isn’t like a simple MTF indicator. This is the real display of the indicator on its timeframe. Here's the options available in the FFx indicator: Select the timeframes to be displayed (M1 to Monthly) Define the width (number of bars) for each timeframe box Alert pop up/sound/ema
FREE
Pin Bars
Yury Emeliyanov
5 (4)
主な目的:"ピンバー"は、自動的に金融市場チャート上のピンバーを検出するように設計されています。 ピンバーは、特徴的なボディと長いテールを持つキャンドルであり、トレンドの反転または修正を知らせることができます。 それがどのように機能するか:インジケーターはチャート上の各キャンドルを分析し、キャンドルの体、尾、鼻のサイズを決定します。 事前定義されたパラメータに対応するピンバーが検出されると、インジケータはピンバーの方向(強気または弱気)に応じて、上矢印または下矢印でチャート上に パラメータ: TailToBodyRatio-テールの長さとピンバーのボディサイズの最小比率を定義します。 NoseToTailRatio-ピンバーの「ノーズ」とテールの間の最大許容比を設定します。 ArrowSize-マークされたピンバーとチャート上のピンバーを指す矢印との間の距離を定義します。 適用:"ピン棒"の表示器が潜在的な傾向の逆転ポイントを識別し、市場か近い位置を書き入れる信号を発生させるのに使用することができます。 正しく使用され、他のテクニカル指標や分析方法と組み合わせると、指標は取引結果
FREE
Heiken Ashi Button Heiken-Ashi , often spelled Heikin-Ashi, is a Japanese word that means "Average Bar." The Heiken-Ashi approach can be used in conjunction with candlestick charts to spot market trends and forecast future prices. It's useful for making candlestick charts easier to read and analysing patterns. Traders can use Heiken-Ashi charts to determine when to stay in trades while the trend continues and close trades when the trend reverses. The majority of earnings are made when markets a
FREE
A simple indicator showing the size of the spread at the current time, the maximum for the day and the maximum for the entire duration of the indicator. Daily statistics of the maximum spread are also displayed, indicating the time when this spread was fixed. The location of the display of the received information can be changed depending on your preferences and positioned anywhere on the screen. It is possible to output alerts about exceeding the size of the spread specified in the input pa
FREE
This indicator allows you to number bars within a trading session for CFDs. It works on GER40, UK100, US30, US100, and US500 and is fully customizable to fit your trading style and chart preferences. Key Features & Parameters: Customizable session interval: define your own session start and end times Option to hide even numbers for a cleaner chart Adjust number distance to position the bar numbers as you prefer Font size and color: choose the size and color that suit your chart Number of days di
FREE
This indicator alerts you when/before new 1 or 5 minute bar candle formed. In other words,this indicator alerts you every 1/5 minutes. This indicator is especially useful for traders who trade when new bars formed. *This indicator don't work propery in strategy tester.Use this in live trading to check functionality. There is more powerful Pro version .In Pro version,you can choose more timeframe and so on. Input Parameters Alert_Or_Sound =Sound ----- Choose alert or sound or both to notify y
FREE
This indicator help to mark the high and low of the session Asian,London,Newyork , with custom hour setting This indicator is set to count from minute candle so it will move with the current market and stop at the designated hour and create a accurate line for the day. below is the customization that you can adjust : Input Descriptions EnableAsian Enables or disables the display of Asian session high and low levels. EnableLondon Enables or disables the display of London session high and
FREE
This indicator provides a clean, visual-first approach to identifying key support and resistance levels by distinguishing between price rejection (the wicks) and established value (the bodies). By isolating these two areas into minimalist rectangle zones, it allows you to see exactly where the market is most likely to react without the clutter of price labels or unnecessary statistics. Key Features Wick vs. Body Logic : Automatically calculates the gap between the highest/lowest candle bodies an
FREE
Indicator measures strength of each currency in your list. Main idea: It simply iterates through all combinations of pairs and adds difference between open and close in percent. Parameters: List of currencies - what currencies will be calculated (maximum is 8) Calculation type - from which data will be strength calculated Calculation data input - used as input related to calculation type Symbol suffix - used in case of suffix on symbols, e.g: when your symbols look like EURUSDm, EURUSDmicro etc
FREE
MTF WPR  Screener  A compact multi-timeframe dashboard that converts Williams’ %R (WPR) into a clear, actionable signal: NOW: BUY/SELL with confidence % , plus the Best Entry TF suggestion and a simple volatility label . What you get NOW decision (every second): BUY / SELL + confidence % Best Entry TF: highlights the most suitable timeframe for entry in the current direction MTF table (optional): WPR values across timeframes in one panel (toggle “Details”) Two trade display modes: STRICT: shows
FREE
The purpose of this new version of the MT4 standard indicator provided in your platform is to display in a sub-window multiple timeframes of the same indicator. See the example shown in the picture below. But the display isn’t like a simple MTF indicator. This is the real display of the indicator on its timeframe. Here's the options available in the FFx indicator: Select the timeframes to be displayed (M1 to Monthly) Define the width (number of bars) for each timeframe box Alert pop up/sound/ema
FREE
FFx Force Index
Eric Venturi-Bloxs
5 (1)
The purpose of this new version of the MT4 standard indicator provided in your platform is to display in a sub-window multiple timeframes of the same indicator. See the example shown in the picture below. But the display isn’t like a simple MTF indicator. This is the real display of the indicator on its timeframe. Here's the options available in the FFx indicator: Select the timeframes to be displayed (M1 to Monthly) Define the width (number of bars) for each timeframe box Alert pop up/sound/ema
FREE
Check out other great products from  https://www.mql5.com/en/users/augustinekamatu/seller   This indicator is the best so far at determining the currency strength of each pair. It provides stable values and is highly adaptive to market changes. It is a great tool to add to your arsenal to make sure you are on the right side of the trend at all times. No inputs required, it is simple plug and play. A Winning Trading Strategy This article describes the components and logic needed to develop a tra
FREE
FFx MACD
Eric Venturi-Bloxs
4.2 (5)
The purpose of this new version of the MT4 standard indicator provided in your platform is to display in a sub-window multiple timeframes of the same indicator. See the example shown in the picture below. But the display isn’t like a simple MTF indicator. This is the real display of the indicator on its timeframe. Here's the options available in the FFx indicator: Select the timeframes to be displayed (M1 to Monthly) Define the width (number of bars) for each timeframe box Alert pop up/sound/ema
FREE
Sm Ichimoku Scanner
Steeve Christian Martol
5 (5)
Multi Time Frame Indicator acts as a Scanner based on the Ichimoku Trading System. The outcome is displayed on a board. This helps you to make "at a glance" a mental picture of the System without having to open the chart. Up to 10 Currencies can be watched. Scanned elements And Legend "KUMO Futur" - Green : The Kumo Futur is Bullish. "KUMO Futur" - Red : The Kumo Futur is Bearish. "PRICE Cross KJ" - Green : The Price is Above the Kijun Sen.  "PRICE Cross KJ" - Red : The Price is Below the Kijun
FREE
Delta AG Free
Yurij Kozhevnikov
5 (2)
The difference between the arithmetic and geometric means at the specified range. Since the greater is the difference between the values, the greater the resulting figure is, actually the indicator shows volatility fluctuations. The arithmetic mean of a certain number of values ​​is the sum of the values ​​divided by their number. The geometric mean is the root of the power of the number of values ​​extracted from the product of these values. If all values ​​are equal, the arithmetic mean and th
FREE
The Rayol Code Hour Interval Lines indicator was designed to assist your trading experience. It draws the range of hours chosen by the user directly on the chart, so that it enables traders to visualize price movements during their preferred trading hours, providing traders a more comprehensive view of price movements and market dynamics. This indicator allows the user to choose not only the Broker's time, but also the Local time. This way, the user no longer needs to calculate local time in re
FREE
TrendXpert Indicator v1.02 – Master the Trend, Trade with Precision Overview TrendXpert v1.02 is a precision tool built for serious traders who want to stay on the right side of the market. Designed specifically for the 4H, 1H, and 30M timeframes, it helps you identify high-probability trend conditions and delivers timely, clean trade signals—without clutter or confusion. What’s New in v1.02 Enhanced Trend Detection : Improved internal logic ensures even greater accuracy in trend labeling and
FREE
WONNFX iSTATS - Account Statistics Indicator [MT4] Indicator Description: is a informational indicator that displays detailed account statistics directly on your chart. The indicator shows profit/loss across different timeframes (day, week, month, quarter, year), in various units of measurement (pips, lots, deposit currency, percentages), as well as advanced risk metrics. Unlike the terminal's built-in tools, iSTATS provides a complete picture of your trading performance in real-time and over se
FREE
Maps
Pavel Shutovskiy
4.75 (4)
The indicator displays on the chart a map, on which markers show the current trading session, as well as shows a text. The indicator provides two types of background display: white and black. The indicator is displayed as the background and does not hinder tracking the current market situation. Parameters: GMT -  the time difference of the terminal and GMT. Background - selection of background - black or white.
FREE
Th3Eng Chart shadow indicator is a tool helps you to display another symbol on the current symbol in candles style or line. You can type the second symbol name in the setting and select the drawing mode { candles or line }. Also, the indicator displays the spread and current price of both pairs on the left top side corner of the chart. setting: 1- Symbol: Insert The second symbol name. 2- Drawing mode: Choose the draw mode from (Candles or line). 3- Show spreads:  true\false to display the pric
FREE
The indicator displays on a chart trading results. You can configure the color and font of displayed results, as well as filter trades based on the magic number. If multiple trades were closed within one bar of the current timeframe, the result is summed and output in one value. Utility parameters Plot profit in - the format of output results: wither in deposit currency taking onto account commission and swap, or in points. Start from - start processing data at the specified time. Plot last dea
FREE
このプロジェクトが好きなら、5つ星レビューを残してください。 このインジケータは、指定されたためのオープン、ハイ、ロー、クローズ価格を描画します 特定のタイムゾーンの期間と調整が可能です。 これらは、多くの機関や専門家によって見られた重要なレベルです トレーダーは、彼らがより多くのかもしれない場所を知るために有用であり、 アクティブ。 利用可能な期間は次のとおりです。 前の日。 前週。 前の月。 前の四半期。 前年。 または: 現在の日。 現在の週。 現在の月。 現在の四半期。 現年。
FREE
Candle Countdown — MT4用 正確なローソク足カウントダウン Candle Countdown は、 現在のローソク足が閉じるまでの残り時間 をチャート上に表示するシンプルで正確なツールです。 エントリーがローソク足のクローズに依存する場合、数秒の違いが重要になります。 このインジケーターは正確な時間を表示し、焦らずに判断できるようサポートします。 ローソク足のクローズ時間を正確に把握するためのインジケーターです。 表示内容: ローソク足が閉じるまでの残り時間 サーバー現在時刻 スプレッド ストップレベル(Stop Level) タイマーはティックに依存せず、プラットフォームの内部タイマーによって更新されるため、市場の動きが少ない場合でも安定した表示を維持します。 これにより、低ボラティリティの環境でも滑らかで安定したカウントダウンを実現します。 情報は背景付きのブロック内に表示されるため、どのチャートカラーでも見やすく、分析の妨げになりません。 ローソク足のクローズが近づくと、タイマーの色が変化し、視覚的に状況を把握しやすくなります。 MT5版はこちら: Cand
FREE
Check out my German Pro Signal - https://www.mql5.com/en/signals/2354346 Dragonfire Arrows is a mythical-themed arrow signal indicator that blends adaptive trend-following logic with multiple types of moving averages—reimagined as “Dragon Breaths.” It generates Buy (Ice Arrow ↑) and Sell (Fire Arrow ↓) signals directly on the chart using a multi-layered pulse system inspired by fantasy creatures, each with its own moving average logic. The system uses three magical “pulse” layers: Dragon’s Quic
FFx Bears Power
Eric Venturi-Bloxs
5 (1)
The purpose of this new version of the MT4 standard indicator provided in your platform is to display in a sub-window multiple timeframes of the same indicator. See the example shown in the picture below. But the display isn’t like a simple MTF indicator. This is the real display of the indicator on its timeframe. Here's the options available in the FFx indicator: Select the timeframes to be displayed (M1 to Monthly) Define the width (number of bars) for each timeframe box Alert pop up/sound/ema
FREE
このプロダクトを購入した人は以下も購入しています
An exclusive indicator that utilizes an innovative algorithm to swiftly and accurately determine the market trend. The indicator automatically calculates opening, closing, and profit levels, providing detailed trading statistics. With these features, you can choose the most appropriate trading instrument for the current market conditions. Additionally, you can easily integrate your own arrow indicators into Scalper Inside Pro to quickly evaluate their statistics and profitability. Scalper Inside
Gann Made Easy は、ミスター・ギャンの理論を使用した取引の最良の原則に基づいた、プロフェッショナルで使いやすい外国為替取引システムです。 W・D・ガン。このインジケーターは、ストップロスとテイクプロフィットレベルを含む正確な買いと売りのシグナルを提供します。 PUSH通知を利用して外出先でも取引可能です。 ご購入後、取引方法の説明と優れた追加インジケーターを無料で入手するには、私にご連絡ください! おそらく、ギャンの取引手法についてはすでに何度も聞いたことがあるでしょう。通常、ギャンの理論は初心者のトレーダーだけでなく、すでにある程度の取引経験がある人にとっても非常に複雑なものです。なぜなら、ギャンの取引手法は理論的にはそれほど簡単に適用できるものではないからです。私はその知識を磨き、最良の原則を私の外国為替インジケーターに組み込むために数年を費やしました。 このインジケーターは非常に簡単に適用できます。必要なのは、それをチャートに添付し、簡単な取引推奨事項に従うだけです。このインジケーターは常に市場分析の仕事を行い、取引の機会を探します。適切なエントリーポイントを検出す
M1 SNIPER は使いやすいトレーディングインジケーターシステムです。M1時間足向けに設計された矢印インジケーターです。M1時間足でのスキャルピングのためのスタンドアロンシステムとして、また既存のトレーディングシステムの一部としても使用できます。このトレーディングシステムはM1時間足での取引に特化して設計されていますが、他の時間足でも使用できます。元々、この手法はXAUUSDとBTCUSDの取引用に設計しましたが、他の市場においても役立つと考えています。 インジケーターのシグナルは、トレンドの方向と逆方向に取引できます。インジケーターのシグナルを利用して両方向に取引するのに役立つ特別な取引テクニックをご紹介します。この手法は、特別な動的なサポートとレジスタンスの価格帯を利用することに基づいています。 ご購入後、M1 SNIPER矢印インジケーターをすぐにダウンロードできます。さらに、M1 SNIPERツールのすべてのユーザーに、以下のスクリーンショットに表示されているApollo Dynamic SRインジケーターを無料で提供しています。この2つのインジケーターを組み合わせることで
まず第一に、この取引インジケーターは再描画されず、再描画されず、遅延しないことを強調する価値があります。これにより、手動取引とロボット取引の両方に理想的なものになります。 ユーザーマニュアル:設定、入力、戦略。 アトミックアナリストは、価格の強さとモメンタムを利用して市場でより良いエッジを見つけるためのPA価格アクションインジケーターです。ノイズや誤ったシグナルを除去し、取引ポテンシャルを高めるための高度なフィルターを備えています。複雑なインジケーターの複数のレイヤーを使用して、アトミックアナリストはチャートをスキャンし、複雑な数学的計算をシンプルなシグナルと色に変換します。これにより、どのような初心者トレーダーでも理解して使用し、一貫した取引の決定を行うことができます。 「アトミックアナリスト」は、新規および経験豊富なトレーダー向けにカスタマイズされた包括的な取引ソリューションです。プレミアムインジケーターとトップノッチの機能を1つの取引戦略に組み合わせ、すべてのタイプのトレーダーにとって汎用性のある選択肢にします。 デイリートレーディングとスキャルピング戦略:高速で正確な
Linear Trend Predictor ー - エントリ ポイントと方向サポート ラインを組み合わせたトレンド インジケーター。高値/安値チャネルを突破するという原理に基づいて機能します。 インジケーターのアルゴリズムは市場のノイズをフィルタリングし、ボラティリティと市場の動向を考慮します。 インジケーターの機能  平滑化手法を使用して、市場のトレンドと、買い注文または売り注文を開くためのエントリー ポイントを表示します。  任意の時間枠のチャートを分析して、短期および長期の市場の動きを判断するのに適しています。  あらゆる市場や時間枠に適応可能な入力パラメータにより、トレーダーはインジケーターを独自にカスタマイズできます。  設定されたインジケーター信号は消えず、再描画もされません。ローソク足の終値で決定されます。  いくつかの種類の通知が矢印と組み合わされています。  このインジケーターは、独立した取引システムとして使用することも、他の取引システムへの追加として使用することもできます。  あらゆるレベルの経験を持つトレーダーが使用できます。 主なパラメータ Vol
「 Dynamic Scalper System 」インジケーターは、トレンド波の中でスキャルピング取引を行う手法のために設計されています。 主要通貨ペアと金でテスト済みで、他の取引商品との互換性があります。 トレンドに沿った短期的なポジションオープンのシグナルを提供し、追加の価格変動サポートも提供します。 インジケーターの原理 大きな矢印はトレンドの方向を決定します。 トレンド波の中では、小さな矢印の形でスキャルピングシグナルを生成するアルゴリズムが機能します。 赤い矢印は強気方向、青い矢印は弱気方向です。 トレンドの方向には敏感な価格変動ラインが描かれ、小さな矢印のシグナルと連動します。 シグナルは次のように機能します。適切なタイミングでラインが現れるとエントリーシグナルが形成され、ラインが開いている間はポジションが保持され、完了すると取引が終了します。 推奨される動作時間枠はM1~H4です。 矢印は現在のローソク足に形成され、次のローソク足が開いている場合は、前のローソク足の矢印は再描画されません。 入力パラメータ Trend Wave Period - トレンド方向
Trend Screener
STE S.S.COMPANY
4.79 (95)
トレンドインジケーター、1つのツールに組み込まれたすべての重要なトレンド機能を備えたトレンドトレーディングとフィルタリングのための画期的なユニークなソリューション! これは、すべてのシンボル/商品(外国為替、商品、暗号通貨、インデックス、株式)で使用できる100%再描画されていないマルチタイムフレームおよびマルチ通貨インジケーターです。 期間限定オファー: サポートおよびレジスタンス スクリーナー インジケーターは、たった 50 ドルで永久的にご利用いただけます。(元の価格 250 ドル) (オファー延長) トレンドスクリーナーは、チャート内のドットで矢印トレンドシグナルを提供するインジケーターに続く効率的なインジケーターです。 トレンド分析インジケーターで使用できる機能: 1.トレンドスキャナー。 2.最大利益分析を備えたトレンドライン。 3.トレンド通貨強度メーター。 4.アラート付きのトレンド反転ドット。 5.アラート付きの強いトレンドドット。 6.トレンド矢印 毎日の分析例、毎日のシグナルパフォーマンス...など、トレンドスクリーナーインジケーターを使用して、ここで見つけること
トレンドラインプロ   市場の真の方向転換点を理解するのに役立ちます。この指標は、真のトレンド反転と主要プレーヤーが再び参入するポイントを示します。 分かりますか     BOSライン   複雑な設定や不要なノイズなしに、より長い時間足でのトレンドの変化と重要なレベルを把握できます。シグナルは再描画されず、バーが閉じた後もチャート上に残ります。 VERSION MT 5     -     RFI LEVELS PRO インジケーター と組み合わせることで、その潜在能力を最大限に発揮します。 インジケーターが示す内容: 本当の変化   トレンド(BOSライン) 一度シグナルが現れたら、それは有効です!これは、リペイント機能を持つインジケーターとの重要な違いです。リペイント機能を持つインジケーターは、シグナルを発した後、それを変更し、資金の損失につながる可能性があります。これにより、より高い確率と精度で市場に参入できます。また、矢印が現れた後、目標値(利益確定)に達するか、反転シグナルが現れるまで、ローソク足の色を変更する機能もあります。 繰り返しエントリ       主要プレーヤーの
NAM Order Blocks
NAM TECH GROUP, CORP.
3.67 (3)
MT4マルチタイムフレームオーダーブロック検出インジケーター。 特徴 -チャートコントロールパネルで完全にカスタマイズ可能で、完全な相互作用を提供します。 -必要な場所でコントロールパネルを表示および非表示にします。 -複数の時間枠でOBを検出します。 -表示するOBの数量を選択します。 -さまざまなOBユーザーインターフェイス。 -OBのさまざまなフィルター。 -OB近接アラート。 -ADRの高線と低線。 -通知サービス(画面アラート|プッシュ通知)。 概要 注文ブロックは、金融機関や銀行からの注文収集を示す市場行動です。著名な金融機関と中央銀行が外国為替市場を牽引しています。したがって、トレーダーは市場で何をしているのかを知る必要があります。市場が注文ブロックを構築するとき、それは投資決定のほとんどが行われる範囲のように動きます。 注文の構築が完了すると、市場は上向きと下向きの両方に向かって急激に動きます。注文ブロック取引戦略の重要な用語は、機関投資家が行っていることを含むことです。それらは主要な価格ドライバーであるため、機関投資家の取引を含むあらゆる戦
GOLD Impulse with Alert
Bernhard Schweigert
4.67 (12)
このインディケータは、当社の2つの製品 Advanced Currency IMPULSE with ALERT  +   Currency Strength Exotics . のスーパーコンビネーションです。 このインジケーターは全ての時間枠で作動し、8つの主要通貨と1つのシンボルの強弱のインパルスをグラフで表示します。 このインジケータは、金、エキゾチックペア、商品、インデックス、先物など、あらゆるシンボルの通貨強度の加速度を表示することに特化されています。金、銀、原油、DAX、US30、MXN、TRY、CNHなどの通貨強度の加速度(インパルスまたは速度)を表示するために、任意のシンボルを9行目に追加できる、この種の最初のものです。 新しいアルゴリズムに基づいて構築され、潜在的な取引の特定と確認がさらに容易になりました。これは、通貨の強さや弱さが加速しているかどうかをグラフィカルに表示し、その加速の速度を測定するためです。加速すると物事は明らかに速く進みますが、これはFX市場でも同じです。つまり、反対方向に加速している通貨をペアリングすれば、潜在的に利益を生む取引を特定
MTF Supply Demand Zones
Georgios Kalomoiropoulos
4.82 (22)
次世代の自動化された需要と供給のゾーン。どのチャートでも機能する新しい革新的なアルゴリズム。すべてのゾーンは、市場の価格行動に従って動的に作成されています。 2種類のアラート --> 1) 価格がゾーンに達したとき 2) 新しいゾーンが形成されたとき もう 1 つの役に立たない指標はありません。実績のある完全な取引戦略を手に入れることができます。     新機能:     価格が需給ゾーンに達したときにアラートを出す     新しい需給ゾーンが作成されたときにアラートを発します     プッシュ通知アラート     ピップ単位のゾーン幅ラベル     MTF のもう 1 つのタイムフレーム。したがって、現在より 2 時間足高いのではなく、現在より 3 時間足し上に見えるようになります。     アラート/ゾーン/MTF 機能を有効/無効にするボタン あなたが得る利点:     取引から感情を取り除きます。     取引エントリをオブジェクト化します。     確率の高いセットアップで利益を上げましょう。     描画ゾーンから時間を節約します。
現在20%OFF! 初心者やエキスパートトレーダーに最適なソリューションです。 このインディケータは、エキゾチックペア・コモディティ・インデックス・先物など、あらゆるシンボルの通貨の強さを表示することに特化したインディケータです。金、銀、原油、DAX、US30、MXN、TRY、CNHなどの通貨の強さを表示するために、9行目にどのシンボルでも追加することができます。独自の機能を多数搭載し、新しい計算式を採用したため、ユニークで高品質、かつ手頃な価格のトレーディングツールとなっています。新しいトレンドやスキャルピングチャンスのトリガーポイントを正確に把握することができるため、あなたのトレードがどのように改善されるか想像してみてください。 ユーザーマニュアル:ここをクリック   https://www.mql5.com/en/blogs/post/708876 すべての時間枠に対応します。あなたはすぐにトレンドを見ることができるようになります! 新しいアルゴリズムに基づいて設計されているため、潜在的な取引の特定と確認がより簡単になります。これは、8つの主要通貨と1つのシンボルの強弱
MetaForecast M4
Vahidreza Heidar Gholami
5 (2)
MetaForecastは、価格データのハーモニクスに基づいて、どんな市場の未来を予測し視覚化します。市場が常に予測可能ではありませんが、価格にパターンがある場合、MetaForecastは可能な限り正確な未来を予測できます。他の類似製品と比較して、MetaForecastは市場のトレンドを分析することでより正確な結果を生成することができます。 入力パラメータ Past size (過去のサイズ) MetaForecastが将来の予測を生成するために使用するバーの数を指定します。モデルは選択したバー上に描かれた黄色の線で表されます。 Future size (将来のサイズ) 予測すべき将来のバーの数を指定します。予測された将来は、ピンクの線で表示され、その上に青い回帰線が描かれます。 Degree (程度) この入力は、MetaForecastが市場で行う分析のレベルを決定します。 Degree 説明  0 Degree 0の場合、価格の全てのピークや谷、そして詳細をカバーするために、「Past size」の入力に大きな値を使用することが推奨されています。  1 (推奨) Degre
Introducing the Delta Volume Profile Indicator - Unleash the Power of Institutional Precision!  Technical Indicator: Are you ready to trade like the pros? The Delta Volume Profile Indicator is no ordinary tool. It’s a high-precision, cutting-edge indicator that puts the power of institutional-grade trading in your hands. This unique indicator analyses delta volume distribution in real-time, revealing the market's hidden buy/sell imbalances that the biggest financial institutions rely on to antic
Order Block Hunter
Noha Mohamed Fathy Younes Badr
5 (10)
Order block hunter indicator is the best indicator for  hunt the order blocks that area where there has been a large concentration of limit orders waiting to be executed Order blocks are identified on a chart by observing previous price action and looking for areas where the price experienced significant movement or sudden changes in direction .This indicator does that for you by using very complicated codes and helps you to take the best areas To buy and sell because it make marks at the best a
Dynamic Forex28 Navigator - 次世代の Forex 取引ツール。 現在 49% オフ。 Dynamic Forex28 Navigator は、長年人気のインジケーターを進化させたもので、3 つの機能を 1 つにまとめています。 Advanced Currency Strength28 インジケーター (レビュー 695 件)  + Advanced Currency IMPULSE with ALERT (レビュー 520 件) + CS28 コンボ シグナル (ボーナス)。 インジケーターの詳細 https://www.mql5.com/en/blogs/post/758844 次世代の Strength インジケーターが提供するもの  オリジナルで気に入っていたすべての機能が、新機能と精度の向上によって強化されました。 主な機能: 独自の通貨強度計算式。 すべての時間枠でスムーズかつ正確な強度ライン。 トレンドの特定と正確なエントリーに最適です。 ダイナミックマーケットフィボナッチレベル (マーケットフィボナッチ)。 このインジケーターに固有
Advanced Supply Demand
Bernhard Schweigert
4.91 (299)
現在40%オフ 初心者にもエキスパートトレーダーにも最適なソリューション このインジケーターは独自の機能と新しい公式を多数内蔵しており、ユニークで高品質かつ手頃な取引ツールです。このアップデートでは、2つの時間枠ゾーンを表示できるようになります。より長いTFだけでなく、チャートTFとより長いTF(ネストゾーンを表示)の両方を表示できます。すべてのSupply Demandトレーダーの皆さんのお気に召すはずです。:) 重要情報の公開 Advanced Supply Demandの可能性を最大化するには、 https://www.mql5.com/ja/blogs/post/720245 にアクセスしてください。   エントリーまたはターゲットの正確なトリガーポイントを正確に特定できれば取引がどのように改善されるか想像してみてください。新しい基盤となるアルゴリズムに基づいて構築されているため、買い手と売り手の間の潜在的な不均衡をさらに簡単に特定できます。これは、最も強い需要と供給のゾーンと、過去のパフォーマンス(古いゾーンを表示)がグラフィカルに表現されるためです。これらの機能は、最適な
このインジケーターは、反転ポイントと価格戻りゾーンを正確に表示します。     主要プレーヤー 。新たなトレンドが形成される場所を把握し、最大限の精度で意思決定を行い、すべての取引をコントロールします。 TREND LINES PRO インジケーターと組み合わせることで、その潜在能力を最大限に発揮します。 VERSION MT5 インジケーターが示す内容: 新しいトレンドの始まりに活性化する反転構造と反転レベル。 リスクと報酬の比率を最小限に抑えた利益 確定 と 損失停止の レベルの表示     RR 1:2   。 インテリジェントな削減ロジックによるストップロス。 指定されたインジケーターから 2 つのトレンド タイプの反転パターンを表示します。 指標: トレンドを追う   TREND LINES PRO   (世界的なトレンドの変化) TREND PRO   (クイックトレンド変更) シンプルで効果的   スキャナー   リアルタイムトレンド(新機能)。 マルチタイムフレームのインストゥルメント フィルタリング。 画面   利益     LOGIC AI信号の後。 当日プラス方
Adaptive Volatility Range [AVR] is a powerful tool for identifying key trend reversal points. AVR accurately reflects the Average True Range (ATR) of volatility, taking into account the Volume-Weighted Average Price (VWAP). The indicator adapts to any market volatility by calculating the average volatility over a specific period, ensuring a stable rate of profitable trades. You receive not just an indicator but a professional automated trading system , AVR-EA . Advantages: Automated Trading Sys
説明書(ロシア語)  /  説明書 (英語)  /  バージョン MT5 主な機能: 売り手と買い手のアクティブなゾーンを表示します。 このインジケーターは、買いと売りの適切な最初のインパルスレベル/ゾーンをすべて表示します。これらのレベル/ゾーンがアクティブになると、エントリーポイントの探索が始まり、レベルの色が変わり、特定の色で塗りつぶされます。状況をより直感的に把握できるように、矢印も表示されます。 LOGIC AI - テンプレートをアクティブ化するときにエントリポイントを検索するためのゾーン(円)の表示 視認性を向上させるため、人工知能を用いて進入ポイントを探索したゾーンを表示する機能が追加されました。 より高い時間枠からのレベル/ゾーンの表示(MTFモード) より長い時間間隔でレベル/ゾーンを表示する機能を追加しました。また、インジケーターに自動トレンド検出機能(   TPSproTREND PRO   )を実装しました。 取引のための個別の専門的なステップバイステップのアルゴリズム このアルゴリズムは、トレンドの方向と逆方向の両方でデイトレードを行うために設計されていま
Super Reversal Indicator with Alert 概要 Super Reversal Indicator with Alert は、マルチタイムフレーム分析を用いて高確率の相場反転ポイントを特定するためのトレーディングツールです。ストキャスティクスのモメンタム、需給ゾーン、そして価格のリジェクションシグナルを組み合わせて分析を行います。 本インジケーターは、明確な視覚シグナルとリアルタイムアラートにより、トレーダーが市場の転換点を見極めるのをサポートします。 主な機能 マルチタイムフレーム ストキャスティクス分析 上位時間足のストキャスティクスを使用(ユーザー設定可能) モメンタムの変化やクロスシグナルを検出 エントリー精度を高めるための買われ過ぎ・売られ過ぎレベルを表示 反転リジェクションシグナル 重要な価格帯での強いリジェクションローソク足を検出 以下のポイントでの反転を識別 日足高値での売り反転 日足安値での買い反転 視認性を高めるため、チャート上に矢印を表示 需給ゾーン(Supply and Demand) H4およびD1の上位時間足から重要なゾーンを自動
BTMM State Engine Pro is a MetaTrader 4 indicator for traders who use the Beat The Market Maker approach: Asian session context, kill zone timing, level progression, peak formation detection, and a multi-pair scanner from a single chart. It combines cycle state logic with a built-in scanner dashboard so you do not need the same tool on many charts at once. What it does Draws the Asian session range; session times can follow broker server offset or be set in inputs. Tracks level progression (L
TrendLine PRO MT4
Evgenii Aksenov
4.83 (167)
The Trend Line PRO indicator is an independent trading strategy. It shows the trend change, the entry point to the transaction, as well as automatically calculates three levels of Take Profit and Stop Loss protection. Trend Line PRO is perfect for all Meta Trader symbols: currencies, metals, cryptocurrencies, stocks and indices. The indicator is used in trading on real accounts, which confirms the reliability of the strategy. Robots using   Trend Line PRO   and real Signals can be found here:   
ブレーカートレーダーになり、価格が反転すると市場構造からの利益が変化します。 注文ブロックブレーカーインジケーターは、トレンドまたは価格の動きが枯渇に近づいており、逆転の準備ができていることを識別します。通常、反転または大規模なプルバックが発生しようとしているときに発生する市場構造の変化について警告します。 この指標は、ブレイクアウトと価格の勢いを識別する独自の計算を使用します。使い果たされる可能性のあるポイントの近くで新しい高値が形成されるたびに、インディケーターはその高値の作成を担当する最後の注文ブロックを描きます。次に、移動する価格とともに注文ブロックを追跡します。その後、価格が反対方向にシフトし、その注文ブロックを突破すると、新しい市場構造を作成し、トレンドまたは大きな後退の可能性のある反転の開始を警告します。 注文ブロックは、高値/安値が作成される前の最後の反対色のろうそくであり、価格がこれらの重要な領域を下抜けすると、トレンドの短期的ま​​たは長期的な反転の兆候です。 特徴 重要な枯渇点での市場構造の変化を警告します 価格が使い果たされるレベルに近づくと、自動的に
通貨強さウィザードは、取引を成功させるためのオールインワン ソリューションを提供する非常に強力な指標です。このインジケーターは、複数の時間枠のすべての通貨のデータを使用して、このまたはその外国為替ペアのパワーを計算します。このデータは、使いやすい通貨インデックスと通貨パワーラインの形式で表され、特定の通貨のパワーを確認するために使用できます。 必要なのは、取引したいチャートにインジケーターを接続することだけです。インジケーターは、取引する通貨の実際の強さを示します。このインジケーターは、トレンドに合わせて取引するときに有利に利用できる売買高の圧力の極値も示します。このインジケーターには、フィボナッチに基づく可能なターゲットも表示されます。 このインジケーターは、PUSH 通知を含むあらゆるタイプのアラートを提供します。 購入後ご連絡下さい。私の取引のヒントをあなたと共有し、素晴らしいボーナスインジケーターを無料で提供します! 幸せで有益な取引をお祈りします。
Volatility Trend System - a trading system that gives signals for entries. The volatility system gives linear and point signals in the direction of the trend, as well as signals to exit it, without redrawing and delays. The trend indicator monitors the direction of the medium-term trend, shows the direction and its change. The signal indicator is based on changes in volatility and shows market entries. The indicator is equipped with several types of alerts. Can be applied to various trading ins
FX Power: 通貨の強弱を分析して、より賢い取引を実現 概要 FX Power は主要通貨と金の実際の強弱をあらゆる市場状況で理解するための必須ツールです。強い通貨を買い、弱い通貨を売ることで、 FX Power は取引の意思決定を簡素化し、高い確率の取引機会を見出します。トレンドを追従する場合でも、極端なデルタ値を使用して反転を予測する場合でも、このツールはあなたの取引スタイルに完全に適応します。ただ取引するだけではなく、 FX Power で賢く取引をしましょう。 1. なぜ FX Power がトレーダーにとって非常に有益なのか 通貨と金のリアルタイム強弱分析 • FX Power は主要通貨と金の相対的な強弱を計算し、マーケットダイナミクスに関する明確な洞察を提供します。 • どの資産がリードしているか、または後れを取っているかを監視して、取引するペアを賢く選びましょう。 マルチタイムフレームの包括的なビュー • 短期、中期、長期のタイムフレームで通貨と金の強弱を追跡し、マーケットトレンドに基づいて取引戦略を調整できます。 • スキャルピングからスイングトレード
Trend indicator AI
Ramil Minniakhmetov
4.49 (84)
Trend Ai indicatorは、トレンドの識別と実用的なエントリポイントと反転アラートを組み合わせることで、トレーダーの市場分析を強化する優れたツールです。 この指標は、ユーザーが自信と正確さで外国為替市場の複雑さをナビゲートすることを可能にします トレンドAiインジケーターは、主要なシグナル以外にも、プルバックやリトレースメント中に発生するセカンダリエントリポイントを識別し、トレーダーが確立されたトレンド内の価格修正を活用できるようにします。 重要な利点: *MT4およびMT5の仕事 *明確な買いまたは売りシグナル *再描画しません ·すべての資産で動作します 私はeaやセットをtelegram it詐欺で販売しないように注意してください。 すべての設定はここでブログで無料です。  重要! 指示とボーナスを得るために購入後すぐに私に連絡してください! 私の他のプロダクトと同様、実質操作の監視はここに見つけることができます: https://www.mql5.com/en/users/mechanic/seller&nbsp ; 設定および入力: すべての
Auto Optimized Parabolic RSI: 高度な3Dモメンタムエンジン ほとんどのリテール向けインジケーターは、市場のボラティリティが変化した瞬間に破綻する静的な入力値に依存しているため、失敗に終わります。Auto Optimized Parabolic RSIは、自らの数学的優位性を継続的に再計算することで「インジケーターの陳腐化」問題を解決し、機関投資家レベルの定量的適応力をMT5ターミナルに直接もたらします。 最大の強み: カスタムインメモリ3D最適化   標準的な自動最適化ツールは、インジケーターの呼び出しで端末に過負荷をかけるため、頻繁にMT5プラットフォームをフリーズさせます。本ツールは、このボトルネックを完全に回避しています。RAMベースのカスタムネイティブ計算機を内蔵した内部エンジンは、チャートを読み込んだりタイムフレームを変更したりするたびに、超高速の3Dグリッド探索を実行します。RSI期間(頻度)、SARステップ(加速度)、SAR最大値(制限速度)を同時にスイープし、プラットフォームを遅延させることなく、数万通りものパラメーターの組み合わせを絶対的
Matrix Arrow Indicator MT4
Juvenille Emperor Limited
5 (3)
マトリックスアローインジケーターMT4は、すべてのシンボル/商品(外国為替、商品、暗号通貨、インデックス、株式)で使用できる100%再描画されていないマルチタイムフレームインジケーターに続くユニークな10in1トレンドです。マトリックスアローインジケーターMT4は、初期段階で現在のトレンドを判断し、最大10の標準インジケーターから情報とデータを収集します。 平均方向移動指数(ADX) 商品チャネルインデックス(CCI) クラシック平研アシキャンドル 移動平均 移動平均収束発散(MACD) 相対活力指数(RVI) 相対力指数(RSI) 放物線SAR ストキャスティクス ウィリアムズのパーセント範囲 すべてのインジケーターが有効な買いまたは売りシグナルを与えると、対応する矢印がチャートに印刷され、次のろうそく/バーの開始時に強い上昇トレンド/下降トレンドを示します。ユーザーは、使用するインジケーターを選択し、各インジケーターのパラメーターを個別に調整できます。マトリックスアローインジケーターMT4は選択されたインディケーターからのみ情報を収集し、それらのデータのみに基づいてアローを印刷
作者のその他のプロダクト
CoralPage is a simple little utility to add navigation controls to your chart.  You can now easily step through the symbols in the Market Watch without having to click-and-drag a symbol from the Market Watch onto your chart.  It's a simple but indispensable time-saver! Click move to the first, previous, next or last symbol in the Market Watch.  Shift-click to go the the previous or next symbol that has an open order. CoralPage is completely free.  If you like this, please check out my other prod
FREE
Coral Trade Planner is a 3-in-1 tool for making smart trades.   The Lot Size Calculator lets you determine the appropriate lot size based on risk, and see the impact on your risk as you change the stop loss distance and/or lot size.   The Trade Planner is an innovative tool for visualizing your planned trades on the chart, and gives you immediate feedback on the value of the trade (both the risk of hitting your stop loss and the reward of hitting your take profit).  Both Market and Pending order
Coral Multi TF Meter allows you to quickly see how price is moving on a single currency pair across multiple timeframes at once.  You can select which timeframes to display; the size, position, colors of cells; whether to display values or not; and how often the meter is updated. The calculation is based on ATR distance for each displayed timeframe.  Hover over the header cell for the row (with the currency name in it) to see the current ATR value (in pips) for that period.  When "Display Values
Coral Heatmap is a currency strength meter based on the ATR values for the selected timeframe.  There are two main view modes: All Currencies (default) - see the ranked strength of all currencies in a single view Selected Currency - see the relative strength of all other currencies compared to a selected currency You can optionally display the timeframe selection toolbar; timeframe is always synchronized to the current chart timeframe.  Use keyboard shortcuts to quickly navigate currencies (up/d
Coral Rate of Change Dashboard  displays "rate of change" calculations across multiple symbols and timeframes simultaneously.  See at a glance which pairs are moving, and how quickly.  Receive alerts when any symbol + timeframe is experiencing very strong movement.  You can display data for currency pairs, or for individual currencies (takes the average for each currency across all available pairs). See the CoralDash product description for the core functionality of the dashboard (symbol exposu
Coral Notify Dash allows you to manage all of your chart price-based notifications from a single consolidated dashboard.  It fills a gap left by MT4, which does not support popup alerts.  If you're like me and you often don't hear the alert sound for the built-in alerts, this is an indispensable tool. I use Coral Notify Dash as part of my daily chart analysis workflow.  I use a tool like Coral Dash (available for free,  here ) or one of the other dashboards to set my trading bias.  As I review t
Coral History displays information about your trading account and a summary of your history for the day, week, month and all time in a convenient, lightweight window. NEW : You can now set daily / weekly / monthly goals.   Coral History can notify you when reaching a goal.  If set the goal will be displayed in the History section row header; and if you've reached the goal the row will be highlighted in green. Account Information Balance Equity Free Margin (amount, percent or drawdown) Marin Leve
Coral Rescue will help save an account with trades in drawdown.  Do you have losing trades that are just too large to deal with?  They reduce your available margin and can be accumulating swap costs, but the loss would be too great to just accept closing the trades.  Just hoping that price will eventually come back is not an effective strategy, you need a disciplined, consistent and preferably automatic way to dig yourself out of the hole. Coral Rescue is not an EA that places trades on its own.
Chart Logic is here!  Chart automation for MT4: put your Ideas into Actions! Chart Logic is an EA for MT4 that lets you automate actions on your charts.  You define "conditions" and 'actions"; when all the conditions are true, then all the actions are triggered.  Conditions can refer to a wide range of observations, about account information, candle data, technical indicators, key levels, price, time, market data, trades and so on.  And actions can send alerts/notifications, open/close/modify tr
フィルタ:
dbDesigner
59
dbDesigner 2024.02.16 15:17 
 

ユーザーは評価に対して何もコメントを残しませんでした

レビューに返信