YouTubeにあるマーケットチュートリアルビデオをご覧ください
ロボットや指標を購入する
仮想ホスティングで
EAを実行
EAを実行
ロボットや指標を購入前にテストする
マーケットで収入を得る
販売のためにプロダクトをプレゼンテーションする方法
MetaTrader 4のためのエキスパートアドバイザーとインディケータ - 79

The indicator can help traders to assess in advance the number of Lots, Balance and Equity, if the price deviates from the current levels. The indicator will be useful for those who trade using Martingale.
Features The indicator belongs to the category of risk management. The indicator helps to assess in advance the account change that would happen in case of possible price change from the current value to a threshold. It also recalculates swap, lock, pending orders, take profit and stop loss.
FREE

Copier of transactions through Telegram channel. Will help you instantly publish your trade in Telegram channel or copy trades from Telegram channel. The utility can work in two directions by receiving signals in MT4 and transmitting signals to Telegram . Telegram chat for questions and discussion: https://t.me/forex4up_chat No more missed deals No more panic Capital Management Ease of use PAY version: https://www.mql5.com/en/market/product/
FREE

Non-proprietary study of Joe Dinapoli used for overbought/oversold evaluation. Uses of Detrended Oscillator indicator Profit taking. Filter for market entry technics. Stop placement. Part of volatility breakout pattern. Determining major trend changes. Part of Dinapoli Stretch pattern. Inputs lnpPeriod: Perid of moving average Method: Calculation method ********************************************************************************* If you want to know market Overb
FREE
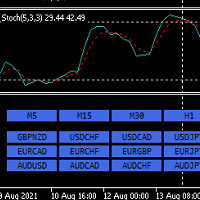
Hello,
This is an easy symbol change panel.
The free version only can change major pairs which are "AUDUSD, EURUSD, GBPUSD, USDCHF, USDCAD, USDJPY, NZDUSD"
The full version can add your symbols.
FULL version here:
https://www.mql5.com/en/market/product/71176?source=Site+Market+MT4+Indicator+New+Rating005
Also, can change the TimeFrame as well.
Symbols must be active on your Market Watch list.
Parameters:
ratio - change the size LineNumber - you can set that how many symbols are displa
FREE

Demo version of the paid product - Copy MT4 copier , limited to lot size of 0.01 Universal copier of deals from MetaTrader 4 to MetaTrader 4 ( MT5<->MT5 version is available ; with both versions, you can copy MetaTrader 5<->MetaTrader 4, MetaTrader 4<->MetaTrader 5, MetaTrader 5<->MetaTrader 5, MetaTrader 4<->MetaTrader 4). Spread filter. Select the best price (start copying positions with a profit or loss). Configure the lot size, fixed or ratio-based (provider signals can be copied with an inc
FREE

A.このピボットインジケータは日ピボット価格を示します。
B.抵抗R0.5、R1、R1.5、R2、R2.5、およびR3も表示されます。
C.サポートS0.5、S1、S1.5、S2、S2.5、およびS3も表示されます。
入力:
入力の下に、3つの変数があります。
1.ExtFomula。ここでは、チャートウィンドウ上の抵抗または支点に1または2または3以下の値で優先出口を設定できます。 1は抵抗または支持体1での出口を表し、2は抵抗または支持体2での出口を表す。3は抵抗または支持体3での出口を表す。
ExtHowmanyDays。デフォルトは30日間です。 ExtFomulaに1、2、3のいずれかを入力すると、過去30日間の出口サポートとレジスタンス価格がチャートウィンドウに表示されます。
3.ExtDraw。チャートウィンドウまたはその逆ビザにサポートとレジスタンスを描画できるようにするには、trueを選択します。
利点
1.表示器はサポート3か抵抗3まで見ることを可能にします
2.インジケーターを使用すると、選択した任意の抵抗またはサポートでチャート上の出口点を設
FREE

Trades Viewer Free supports EURUSD only. Trades Viewer is a trading helper app for a serious trader. It offers several important data like day range, 22 days average range and predefined PL. It draws trades history and current open positions on a chart. It has a detail panel for viewing a particular trade with just a click on that trade. All these make it very convenient and straightforward to view your entry/exit positions and thus improve your trading system. Features Profit/loss of the curren
FREE
Jarfac Trades Extractor Description: Le "Jarfac Trades Extractor" est un script MQL4 conçu pour les traders qui souhaitent exporter et analyser leurs trades historiques. En un seul clic, le script génère un fichier CSV contenant des informations détaillées sur chaque trade exécuté pendant une période spécifiée. Caractéristiques principales : Filtrage par Période : Définissez une période personnalisée pour l'extraction. Possibilité de désactiver le filtrage par période. Filtrage par Commentaire :
FREE

Overview The script displays information about the trade account: Account - account number and type (Real or Demo); Name - name of the account owner; Company - name of a company that provide the access to trading; Server - trade server name; Connection State - connection state; Trade Allowed - shows whether trading is allowed on the account at the moment; Balance - account balance; Equity - account equity; Credit - amount of credit; Profit - profit size; Free Margin - free margin on the account;
FREE

Power Trend Free - the indicator shows the trend strength in the selected period.
Input Parameters The indicator has three input parameters: Period - a positive number greater than one, it shows the number of candlesticks used for calculations. If you enter one or zero, there will be no error, but the indicator will not be drawn. Applied Price - the standard "Apply to:" set meaning data used for the indicator calculation: Close - Close prices; Open - Open prices; High - High prices; Low - Low p
FREE

Profitstat is a free indicator that scans your history and displays it on the chart. The free version shows the number of trades and profit made on the current and previous day. The data is updated instantly as soon as a trade closes. Simply attach it to any chart and it gives the account data irrespective of the chart currency nor timeframe.
FREE

This is a Bot which send notifications every hour at your MT4 platform. The notification consists of four part. <<Clock>> + Your Message + Symbols + profit + Total # of Orders + Total profit Here is an example : 21:00 Hodor: #US30 $+40.31 GOLD $-5.31 Total 5 Orders $+35.00 If there is no order : 21:00 Hodor: HODOR signals: https://www.mql5.com/en/signals/977796
There is a private message parameter where you can enter your own message also. Hodor_Comment_OnOff_Flag removes the "Hodor i
FREE
RSI Signalz ---------------------------------------------------------------------------------------------------------------------------------------------------------------------------------------------------------------------------------------------------------------------------------------------------------------------- NOW FREE FOR EVERYONE! TUNABLE IN THE INPUT SETTINGS - ENJOY :)
(IT DOES NOT TRADE FOR YOU. THIS IS TOO JUST HELP WITH MANUAL TRADING)
Fully Automated EA for marking good en
FREE
This utility will help you avoid losing money on your trades when your terminal loses connection to the broker or your VPS / computer goes into an update and doesn't open your MetaTrader client automatically after the update. How is this product different from the other disconnect alerts? This one will email you and/or an SMS even when your MetaTrader client gets disconnected from the Internet or doesn't respond! Your client is monitored externally and doesn't rely on its own Internet conn
FREE

This is a very silly script but perhaps you find it useful. It deletes all objects from the chart. I recommend setting a hot key to call it just by pressing a couple of keys on your keyboard. To avoid accidental deletion of object, the script will ask you to confirm the action as you won't be available to restore them with "undo" (Ctrl+Z).
FREE
This is a MetaTrader 4 script. It helps to export all trades into a CSV file as per Symbol and selected periods.
Input Select Symbol: This is 2-option input. Select current symbol or all symbols to export its orders. Select Period: This is 7-option input. It includes Last Month, This Month, Last Week, This Week, Today, All History, and Date Specified. Specify Starting Date: Enter a date if you selected Date Specified in "Select Period" input. Specify Ending Date: Enter a date if you selected Da
FREE
The Order Info Box utility is designed to conveniently control the orders placed. If there are orders, the utility builds graphical informers for each order, indicating
- the order type (position direction);
- the order volume;
- the profit (if the order is in the market);
- optionally the order magic;
- optionally the order comment.
In addition, the utility builds informers for TakeProfits and StopLosses of orders, indicating the profit or loss that will occur when this TakeProfit or StopLoss i
FREE
This indicator can display the remaining time of the current K-line closing in real time
Supports any time period Automatically and dynamically follow the current K-line position Automatically calculate days, hours, minutes, and seconds
I have added a quick control panel in the bottom left corner for it. When multiple different Bank series indicators are enabled at the same time, the control panel can quickly switch between displaying/hiding each indicator, so that the chart does not display m
FREE

Currency Pair Information
Useful indicator to have the following information on the chart: 1. Asset Name 2. Current Spread 3. Current ATR of the actual time frame 4. Time to close of the candle
It is located at the top right of the chart. If you request it, I can add the parameterization of the location of the information.
Other tools:
AMS Forex System
hockfx Price Alert Pro
hockfx
FREE

An indicator in the form of a panel for collecting statistics on spreads from a specified list of pairs. It is enough to open one chart and set an indicator to collect statistics for all specified pairs.
After completion of work, the panel writes values to a file, which allows not to interrupt statistics after completion of work.
Input parameters:
-Interval to update the spread for pairs (sec) Allows you to specify how often to collect statistics (allows you to reduce the load) -List of pair
FREE
Machine translation of the following: This indicator is used to close or open the price and time scales.Select true to display scale and false to close scale.After the price scale is closed and then opened, it may show that it is not at all. But it can be solved by switching time cycle.This indicator has two tags, D and P, which can be opened or closed in real time by clicking.The related parameters can be modified by user, such as the name, position and coordinates of the label.
FREE
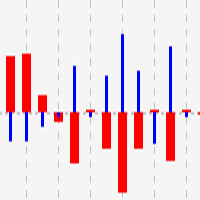
This indicator shows close to close price movements of the current symbol and an other as a histogram. It visualizes correlation between two symbols to help avoid counterproductive trading, diversify risk, etc. Attach it to the current chart as many times as many correlated symbols you want to take into consideration, and specify them in the OtherSymbol input field. The wide red histogram shows the movements of the reference (other) symbol, and the narrow blue histogram shows the movements of th
FREE

The Week7D indicator helps traders identify the day of the week on a price chart. It simply marks each period or each candle as the day of the week at the start of a new trading day. This allows traders to watch how prices move on any given day.
The Week7D indicator has several customization options that traders can use to change the visual representation of the indicator.
The variable "BarCount" changes the number of days during which the indicator will indicate the day of the week in each d
FREE

Tester BO and Tester Signal Bar is a script that allows you to test your trading strategies. The tester has two buffers with up / down signals. An example of use can be seen in the screenshots below. Using the indicator tester, you can achieve the maximum ratio of profitable trades for binary options. Improvement for forex is also planned. I wrote the idea at the very bottom in the “Planned work” group. You can filter your signals by the following data: 1- start date analyze. Interval (1 day, 7
FREE
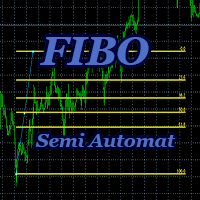
Advisor-assistant for those who like trading on Fibonacci levels. Automatically finds manually plotted Fibonacci Lines on the chart, and opens an order when the levels are broken. The Expert Advisor has 4 customizable levels and the ability to turn them off as unnecessary.
Parameters: Lot - order volume (lot); Requote - price slippage; Magic - individual number for all EA orders, works only with own orders; Name Fibo - set initial name of Fibonacci lines; Level parameters are ide
FREE
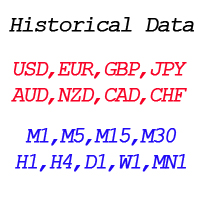
By applying this expert onto any char window, you are able to force download the historical data upon all time-frame (PERIOD_M1, PERIOD_M5, PERIOD_M15, PERIOD_M30, PERIOD_H1, PERIOD_H4, PERIOD_D1, PERIOD_W1, PERIOD_MN1) of 28 major pairs. The 28 major pairs are the combination of the 8 major currencies.
8 major currencies "USD", "EUR", "GBP", "JPY", "AUD", "NZD", "CAD", "CHF"
28 pairs "AUDCAD","AUDCHF","AUDJPY","AUDNZD","AUDUSD","CADCHF","CADJPY" "CHFJPY","EURAUD","EURCAD","EURCHF","EURGBP","E
FREE

PositiveSwap
Легкий, бесплатный скрипт на языке MQL4, который выводит на график, в виде простой таблицы, все торговые пары с положительным свопом и указывает направление (покупка или продажа).
Скрипт автоматически просматривает все доступные торговые пары из окна "Обзор рынка". Поэтому, чтобы увидеть все возможные пары с положительным свопом, рекомендуется включить показ всех символов.
FREE

Introducing "PropFirm Consistency Analyst" — your dynamic companion for achieving consistency in proprietary trading. This innovative Expert Advisor operates seamlessly, continuously calculating consistency metrics between two specified dates, providing real-time insights throughout the trading month.
Tailored specifically for prop traders, this tool serves as a dedicated ally in meeting the stringent consistency requirements set by some proprietary firms. By evaluating trading performance on
FREE
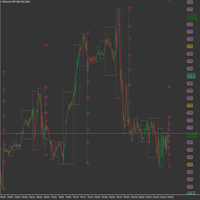
This product has been developed to complement various proven range expansion strategies, with features like the Fibonacci retracement and session/range definition along round numbers indicator. All coming together to provide a clear visual of areas which can potential present the trader with a position or even a quick scalping of price action. Download the full version, and check it out for yourself!!!
FREE

The Cossover MA Histogram indicator is a simple tool showing the trend based on crossover of moving averages. Simply specify two mobving averages and addicional parameters like MA method and Applied price. When fast MA is above slow MA the histogram is green, indicating an uptrend. When MA fast is below MA slow the histogram is red, indicating an downtrend.
FREE
Nombre del Indicador: Two Lines Color 1 Telegran:13 Crow Trading Club
Descripción: Este indicador personalizado para MetaTrader 4, "Two Lines Color 1", es una herramienta de análisis técnico diseñada para ayudarte a identificar oportunidades de trading en los mercados financieros. Este indicador utiliza dos Medias Móviles Simples (SMA) de diferentes períodos y las representa en el gráfico con dos líneas de colores distintos.
Las características clave de este indicador son las siguientes:
Rá
FREE

Информирование пользователя о величине текущего спрэда цветом, в зависимости от тренда. Простой и удобный информатор. Расположить можно в любом месте графика (настраивается во входных параметрах). При активном индикаторе наносим на график горизонтальную линию цветом, указанным во входных параметрах. Эта линия будет (по Вашему мнению) точкой разворота тренда. Если цена будет ниже линии - цвет величины спрэда будет окрашен в цвет "медвежьего" тренда, если цена буде выше линии - цвет величины спрэ
FREE
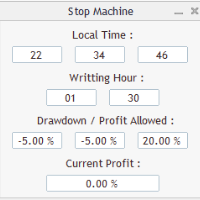
Close all orders immediately: if account balance is less/greater than allowed. PROGRAM USES ACCOUNT BALANCE, NOT EQUITY. Initial balance is calculated once a day if writting hour/minute comes ( local time is using ). It is also reset each restart program ( program does not read account balance from the past! ) Program is developed for VPS running purposes, to prevent from attempts of trading after daily DD limit is reached. I made decision to share this for free. It is not developed for commerci
FREE
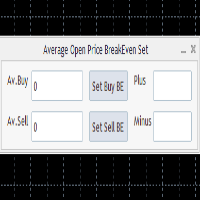
This program calculates the average opening price for sell and buy positions separately. Program allows you to modify the stop loss value to the calculated breakeven price, this value could also be modified by a user-defined integer value in points. All you have to do is press the button. You can also choose Logs_Display_Enable input value if you need to get some additional, useful informations. Enjoy using !!!
FREE

Adaptiv Ma это индикатор средняя линия значение которой выставляется в меню и применяется на тейфрейме Н4. В последствии она адаптируется к выбранному определенному таймфрейму. В меню индикатора задаются следующие параметры 1. Период индикатора 2.Метод определения Ма. 3. Стиль Ма. 4.Толщина линии Ма. 5.Цвет линии Ма.
При переключении между таймфреймами автоматически переключается значение периода Ма для адаптации к новому таймфрейму. Пишите насколько вам была полезен такой индикатор.
FREE
CoralPage is a simple little utility to add navigation controls to your chart. You can now easily step through the symbols in the Market Watch without having to click-and-drag a symbol from the Market Watch onto your chart. It's a simple but indispensable time-saver! Click move to the first, previous, next or last symbol in the Market Watch. Shift-click to go the the previous or next symbol that has an open order. CoralPage is completely free. If you like this, please check out my other prod
FREE
If you use several charts open at the same time, you know how boring it is to apply formats to each chart individually. This script can change all open charts using a single command. Parameters: 1 - Choose symbol to put on charts: apply the selected symbol to all charts. If "current", it does not change the symbol; 2 - Choose timeframe or leave empty: apply the selected timeframe to all charts. If "CURRENT", it does not change the timeframe; 3 - Apply template to the charts: If true, apply the t
FREE

You can check out comment #1 how does it work This is a very useful tool, enter the currency charts you need to open, use the symbol "/" to distinguish them, and select the periodicity /TF of the chart, press the button and they will open the charts for you in batches without you having to manually open them each! Because some EA use multiple currency pairs strategy, but do not support one chart to support all currency pairs, so I developed this tool, hope you like it, if you are satisfied with
FREE

Good EA to help to earn money easily. (Full Version)
Strategy:
MA - A moving average (MA) is a stock indicator that is commonly used in technical analysis. The reason for calculating the moving average of a stock is to help smooth out the price data over a specified period of time by creating a constantly updated average price.
BB - Bollinger Bands work as an oscillator measurer. It indicates whether the market has high or low volatility, as well as overbought or oversold conditions. The m
FREE

Utility for know all informations and settings of terminal where the utility is loaded. The informations that you can know are for example:
- The path of folder where the terminal start
- The path of folder where the terminal store the indicators, experts advisors etc
- The path of common folder
- The permission to use DLL, to automated trading etc
- The permission to send email, FTP or notifications to smartphone
and many other informations
FREE

1、能显示货币之间的强弱 0是最弱 7是最强 2、能显示28个货币以及黄金 原油的 涨跌幅度 3、能切换货币对 4、能显示持仓订单的货币对 1、能显示货币之间的强弱 0是最弱 7是最强 2、能显示28个货币以及黄金 原油的 涨跌幅度 3、能切换货币对 4、能显示持仓订单的货币对 5、能利用键盘的的上下键切换货币对,左右键切换周期 1、能显示货币之间的强弱 0是最弱 7是最强 2、能显示28个货币以及黄金 原油的 涨跌幅度 3、能切换货币对 4、能显示持仓订单的货币对 5、能利用键盘的的上下键切换货币对,左右键切换周期 5、能利用键盘的的上下键切换货币对,左右键切换周期 1、能显示货币之间的强弱 0是最弱 7是最强 2、能显示28个货币以及黄金 原油的 涨跌幅度 3、能切换货币对 4、能显示持仓订单的货币对 5、能利用键盘的的上下键切换货币对,左右键切换周期
FREE

Script utility to clean up your template from every object. Convenient and quick to use. Just drag the script onto your template and it will be cleaned of all visible and non-visible objects present. Very useful for objects that cannot be eliminated simply by writing or shapes, etc. We would appreciate your feedback, so we can better ourselves. Happy Trading.
FREE

***IMPORTANT: This free indicator works with the paid for Strong Weak Forex Expert Advisor. The EA also depends on the following custom indicators: Strong Weak Heiken Ashi Strong Weak Parabolic Strong Weak Values Strong Weak Indicator Download them for free in the Market. The EA will not work without it. These are all custom indicators which the Strong Weak Forex Expert Advisor relies on to generate trading signals. If you have any problems with installation send me a message.
FREE
Version History Date Version Changes 07/09/2022 1.10 Initial released Description The RedeeCash RSI is your typical RSI indicator with the three latest RSI calculations exposed as global variables for easier integration with scripts and expert advisors. Code Sample To invoke this indicator from an EA or script, call the iCustom metatrader function, iCustom ( Symbol (), PERIOD_CURRENT , "Market/RedeeCash RSI" , 14 , 1 , 0 ); string RSIVarName = StringConcatenate ( Symbol (), "_rsi" ); string RSIP
FREE
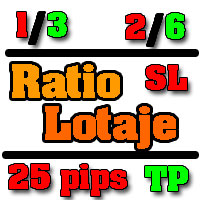
Asesor experto desarrollado para MT4 con el objetivo de ingresar ratios de utilidad y % de riesgo, adicional los Pips de SL para el cálculo del lotaje para dicho riesgo. Estos se calculan sobre el balance actual. El usuario tomaría como dato ingresar el lotaje que se calculó y arrastrar el SL manualmente a la cantidad de Pips que ingreso (15,20,25 Pips) el cual daría como perdida en $ el % de riesgo ingresado y arrastar el TP a la cantidad de pips indicado como TP. A la vez que se va inc
FREE

### Description This Expert Advisor is designed to instantly close active positions and/or pending orders based on user-defined criteria. It supports filtering by trade type, magic number, and symbol scope, and is optimized for fast execution.
### Features - Close buy trades, sell trades, or both. - Filter by symbol: close trades on current chart only or across all symbols. - Filter by magic number or close all trades regardless of magic. - Set maximum allowed slippage for execution control. -
FREE
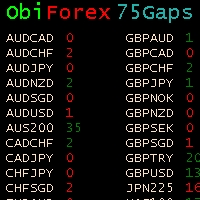
Gaps Size 75 - Market Gap Indicator The Gaps Size 75 indicator reveals the gaps between the current day and the previous day, aiding your trading decisions. It is designed for the "END OF WEEK GAPS" strategy, allowing you to identify potential opportunities. This indicator supports up to 75 currency pairs, with additional pairs available upon request. The columns are color-coded for easy interpretation. For inquiries regarding the weekend gaps strategy, kindly send a private message. Gaps Size 7
FREE

A very useful indicator for trading, which shows the current load on the deposit. The load is calculated by the formula (margin / balance) * 100%. If necessary, the indicator beeps when the load on the deposit exceeds a certain level. The load is displayed total, taking into account all open positions.
Indicator parameters:
Color - text color. Font size - font size. Font family is a font family. Right - indent to the right. Bottom - indent bottom. Max load - the maximum load at which the sound
FREE

Tetris remains one of the most fun and addictive pieces of software to ever grace the computing scene. That's right, everything that everyone loves about Tetris can now be experienced on MT4 platform. Its beautiful simplicity and surprisingly fast-paced gameplay make it an exceptionally easy thing to just pick up and play on short notice. This version comes with everything everyone loves about Tetris. It has all six of the classic tetrimino shapes, the steadily growing level of challenge tha
FREE

Never miss an opportunity with a pending order But if market structure changes or during events it can act against you
It is better to place pending orders with expire time
This tool will be helpful for you with preset expire time
Buy Limit : This order is placed below the current market price. Traders use it when they anticipate a pullback or retracement before the price continues to rise. Sell Limit : This order is placed above the current market price. It’s used when a trader expe
FREE

Harrow Band is an indicator based on support and resistance values. This indicator provides six bands that indicate the nearest of support or resistance position. With this indicator, it will be easier to see where entry and exit points of a trade are located.
Pairs and Timeframes This indicator can be used in any pairs and timeframes, but it is recommended to use it in XAUUSD H1.
Parameters NumCandle - number of candles used to calculate the support and resistance position. BandColor - color
FREE

This expert is a tool to check broker execution and spread. Attach expert in any chart and wait to finish check. Expert sends a pending order (Buy Stop) away from the current price (100 pips) and then modifies it. When expert is removed from chart, pending orders expire and are deleted after 15 minutes.
You can to get source code from here .
Parameters OrdersID - Magic number for orders. ManualLotSize - Lot size for orders. TypeOfOrderUse - Type of order to place (pending or market). TimesModi
FREE

This is a script for quick evaluation and selection of the most appropriate signals from the available database. The list can be sorted (ascending or descending) by the following criteria: Position in the Rating of Signals; The number of subscribers; Date of signal monitoring start; ROI (Return on Investment); Trading result in pips; Number of trades; Signal subscription price; Account balance; Account growth in percent; Maximum drawdown. Signals can be filtered by the following criteria: Accoun
FREE
This indicator allows to hide ATR oscillator (on all MT4 timeframes) from a date define by the user, with a vertical line (Alone) or a panel (with "Hidden Candles"). Indicator Inputs: Period Information on "Average True Range" indicator is available here: https://www.metatrader4.com/en/trading-platform/help/analytics/tech_indicators/average_true_range ************************************************************* Hey traders!! Give me your feeds! We are a community here and we have the same
FREE
WalkForwardReporter is a script creating HTML reports from walk-forward optimization results generated by WalkForwardOptimizer (WFO) library. It allows you to easily view and analyze your expert adviser (EA) performance and robustness in unknown trading conditions of future. You may find more details about walk-forward optimization in Wikipedia . Once you have performed optimization using WFO, the library generates a CSV-file and special global variables with resulting data. Copy the CSV-file fr
FREE

This indicator allows you to monitor the vitals of your account and notifies of some events, in accordance with user settings. Keep your finger on the pulse of trading.
Control elements
Main panel of the indicator shows the following values: chart symbol, bid/ask prices, spread, free margin, equity, total number of orders and total profit/loss.
There are also two buttons: "Alarm" and "Mute". "Alarm" button starts up a timer, which will notify user in a period of time, defined in the settings. I
FREE

This indicator shows the value of returns in the selected time frame .
They are calculated as logarithm of returns , rather than price or raw returns. For small returns, arithmetic and logarithmic returns will be similar. The benefit of using returns, versus prices, is normalization. It is possible measures all variables in a comparable metric despite originating from price series of unequal values.
Inputs You can display data both as a Histogram or a Line It's also possible to display th
FREE

Indicator for fast navigation through financial instruments. When you click on the button, you go to the chart of the financial instrument, the name of which was written on the button. In other words, the indicator opens or unfolds an existing chart window. For each chart, you can customize the name of the financial instrument, text color and background color; in total, you can customize symbols buttons that you trade often. The indicator can be installed on any charts for which you need to swit
FREE

This is an expanded version of my Daily Sacrifice EA that closes old losing trades at the expense of a portion of your profits. This helps to slowly work away drawdown and accelerate the closure of martingale grids
*** Pro Features *** Include/Exclude symbols. These fields are empty by default, but if populated allow you to include only specific symbols or alternatively exclude specific symbols Execute on an hourly interval. Allows the EA to be ran every so many hours rather than on a fixed
FREE

This simple EA closes old losing trades at the expense of a portion of your profits. This helps to slowly work away drawdown and accelerate the closure of martingale grids
*** New Features *** Added - Option to close oldest or furthest from current price trades Added - Calculation of profits that will be sacrificed.
Anyone who has traded with martingale knows that you can get trapped in grids and be hoping for a quicker recovery. This led me to create this EA with the goal of helping to r
FREE

Free version. Only works on EURUSD. Would you like to have statistics about your trades displayed while you operate? Have you a solid understanding of the symbol you are trading? Do you really know everything you need to about your trading account? Do you need to keep an eye on the local times around the world? Advanced Info Displayer answers to all that. It is the ultimate tool to know all sort of useful information and hidden or hard to find data. It is important if you are serious about tradi
FREE

NZD INDEX
The Currency Index Project is ONE part of a thorough Forex study. Many people do not know the theoretical basis that drives currency exchange rates to move on the market. With this set of tools you will be able to have a more complete view of the entire market by analyzing not only the single currency of an exchange, but all the exchange rates that make up that currency by looking at a single window!
The indicator faithfully represents the real index of a single currency present in a
FREE

GBP INDEX
The Currency Index Project is ONE part of a thorough Forex study. Many people do not know the theoretical basis that drives currency exchange rates to move on the market. With this set of tools you will be able to have a more complete view of the entire market by analyzing not only the single currency of an exchange, but all the exchange rates that make up that currency by looking at a single window!
The indicator faithfully represents the real index of a single currency present in a
FREE

T hinking encompasses a flow of ideas and associations that can lead to logical conclusions . Although thinking is an activity of an existential value for humans , there is still no consensus as to how it is adequately defined or understood. Thinking allows humans to make sense of, interpret, represent or model the world they experience, and to make predictions about that world. It is therefore helpful to an organism with needs, objectives, and desires as it makes plans or
FREE

This Expert Advisor give you an alert to your Metatrader Mobile and on Metatrader Screen Chart You can put your Moving average setting You can freely add custom message to it. How to Setup Notification please read this https://www.metatrader4.com/en/trading-platform/help/setup/settings_notifications Input default on this Expert Advisor. You can change to it parameters. fastMAPeriode =3; slowMAPeriode =8; MAMethodType ="0=SMA 1=EMA 2=SMMA 3=LWMA"; fastMAMethod =1; slowMAMeth
FREE

The utility opens copies of open trades. It is very convenient if you use the Signals service and want to increase the volume of transactions.
Settings: Symbols: all symbols only current symbol Orders: Buy Sell Magic Any Magic Input Magic Lot size Original - lot size from original order; Fix Lot - fix lot size (input); Lot X Mult - lot size X koef; Stop Loss From sender - Stop Loss from original; Without - without Stop Loss; Plus Fix - Stop Loss from original order + fix points; Fix Point - fix
FREE

This utility allows to switch among symbols. You have to insert in the input your favorite tickers. it is possible to customize up to 5 symbols
Shortcut Keys : Switch among Symbols : A -Forward D -Backward
Inputs You can setup your favorite keys to switch among symbols.
You can customize the color of background and the edge of the buttons .
You can customize the labels : dimension and font.
FREE

The free version of the snowyowl trend adviser, which is based on determining combinations of candle patterns. A virtual trailing stop tracks each open order and groups open orders to close them simultaneously. In the free version, you can only work on one timeframe, while in the paid version, opening orders on the selected TF is a signal to open orders on lower TF.
FREE

Dark & Light Themes for MT4.
The Dark & Light Themes indicator helps you switch the MT4 chart display between dark and light color schemes. It also includes a watermark showing the current currency pair (symbol) and the active timeframe.
This simple and clean interface makes it more comfortable for traders to analyze charts using any indicator.
FXDragunov Indonesia.
FREE
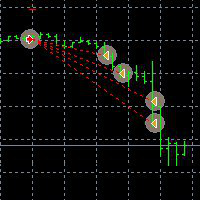
This Demo Version will only work with CHFJPY
For the full version :
For English go here: https://www.mql5.com/en/market/product/41117
For Spanish go here: https://www.mql5.com/en/market/product/41141
This EA does partial close to your positions every certain pips, and can move your Stop Loss to Break Even (Open Proce + 1 pip) when one of the partial close is made. The EA handles all trades of the chart symbol. It can be used with any pair or instrument on MT4. This EA will remember the sta
FREE
MetaTraderプラットフォームのためのアプリのストアであるMetaTraderアプリストアで自動売買ロボットを購入する方法をご覧ください。
MQL5.community支払いシステムでは、PayPalや銀行カードおよび人気の支払いシステムを通してトランザクションをすることができます。ご満足いただけるように購入前に自動売買ロボットをテストすることを強くお勧めします。
取引の機会を逃しています。
- 無料取引アプリ
- 8千を超えるシグナルをコピー
- 金融ニュースで金融マーケットを探索
新規登録
ログイン