MetaTrader 4용 Expert Advisor 및 지표 - 69

Talleyrand PitchFork EA: Your Ultimate Trading Diplomat Introducing the Talleyrand PitchFork Expert Advisor (EA), a revolutionary trading tool designed to elevate your trading strategy through a masterful blend of technical indicators and advanced trade management features. This sophisticated EA harnesses the precision of Gann Lines, Moving Averages (MA), Bollinger Bands, and the MACD to pinpoint the most advantageous moments for trade entry and exit, ensuring unparalleled accuracy and efficienc
FREE

Variable Index Dynamic Average (VIDYA) is an original method of calculating the Exponential Moving Average (EMA) with the dynamically changing period of averaging, developed by Tushar Chande. The length of period in VIDYA depends on market volatility as indicated by the Chande Momentum Oscillator (CMO).
Typical Signals VIDYA generates buy and sell signals when the price crosses over and under the bands: When the price crosses over the upper band of VIDYA, this can be interpreted as a signal to
FREE

Summary: This EA places a single trade at a time in a RANDOM direction (buy or sell) and uses a simple TP & SL. A lot multiplier is also optional. Once a trade hits TP/SL, it will place another trade in a random direction. And so on. Since it only ever has 1 trade open at a time, it can be used on any broker. Which means it can be used on US brokers with the FIFO rule. Inputs are few and everything is based in Points too. So it can be used on any chart reliably and easily. You will be amazed how
FREE

This Utility is a tool to manage level of profits or losses for each order without using stop loss or take profit. The Utility applies virtual levels to close orders in profit or loss. You can use the robot to manage manually opened orders or manage orders opened by another EA.
You can to get the source code from here .
Parameters OrdersManage - orders to manage (all orders of all symbols or orders on the current chart). Stop Loss Pips - virtual stop loss level. Take Profit Pips - virtual take
FREE

AIS MT4 INDICATOR 5 ALL INCLLUSIVE SET
!!!!!!!!!!!!!!!!!!!!!!!!!!!!!!!!!!!!!!!!!!!!!!!!!!!!!!!!!!!
!
! ATTENTION ! LIMITATION OF FREE OFFER PERIOD IS IMPLICIT !
!
! CONFIRMATION 2024-08-20 20:00 !
!
!!!!!!!!!!!!!!!!!!!!!!!!!!!!!!!!!!!!!!!!!!!!!!!!!!!!!!!!!!!
GUIDE
CHAPTER 1 IMPORTANT INFORMATION <1> THIS INDICATOR IS ONE OF THE SERIES OF NEW AIS INDICATORS AIS MT4 INDICATOR 1 =ADVANCED CLASSIC= AIS MT4 INDICATOR 2 =MULTIFRAMES= AIS MT4 INDICATOR 3 =LINES= AIS M
FREE

This is an **MT4 Indicator called “Elsna Dashboard”**, designed as a **monitoring dashboard**. Its main functions are:
**1. Dashboard Display**
* Shows key account info:
* Balance & Equity * Floating Profit/Loss * Floating Pips * Number of open trades * Spread * Total lot size * Duration of the oldest trade * Automatically positions and color-codes these values.
**2. Trade Alerts**
* Plays a sound when a trade opens or closes.
**3. History Recording**
* Records balance an
FREE

Expert Advisor trading Moving Average and Stochastic strategy combined orders management. The EA uses Grid and Martingale . Default setting for USDCAD 15m / USDCHF 15m / GBPJPY 5m. Strategy working since 2010. Preferred trading account 10000 $. Works with high spread This EA operates only once per bar opening. Fast methods of strategy testing and optimization are valid. User can test / optimize by model: (control point) / (open prices only)
developed, tested and optimized on " V
FREE

This indicator will show week and monthhigh low, very useful to understand the market sentiment. To trade within the range/ break out. Low- can act as support- can used for pull back or break out High- can act as resistance- can used for pull back or break out Breakout strategy refers to the day trading technique that provides traders with multiple opportunities to go either long or short . The main idea is to identify the trend in its most juicy state followed by a trending move.
FREE

Description VisualHistory plots positions (Buy and sell orders only) from history of account on a chart. It draws the standard arrows for entry/exit and connects them by the dashed line. Also, VisualHistory displays information on the top left corner of a chart concerning displayed positions: positions count, net profit. Download it to the <MQL4/Experts> directory of your MetaTrader.
Options
Start date for history orders - start date of displayed trade history End date for history orders - end
FREE

TIRED OF HAVING TO CALCULATE THE LOTSIZE EVERY TIME?
This indicator will do it for you, WHATEVER ASSET YOU CHOOSE in 10 seconds !!!
INSTRUCTIONS
The things to do in order to activate this indicator will take around 10 seconds once you understand how to use this indicator properly.
Here are the steps to follow:
Place the indicator on the chart of the asset you want to trade on.
Go to " Inputs ".
Enter where you want to set the stop loss .
Choose risk in $ .
You can also choose whethe
FREE

Master the Forex Market with Powerful Currency Analysis! LIVE MONITORING OF SIGNAL USING CCY POWER
Take your forex trading to the next level with a comprehensive and fully customizable tool designed to analyze currency trends, identify strong and weak currencies , and enhance your decision-making process. Key Features: Multi-Timeframe Analysis
Analyze currency strength from short-term (1-minute) scalping to long-term (1-month) trends—adaptable to any trading style. Customizable Ca
FREE

Description This is an indicator that colors market moods on a linear chart in the window of the main financial instrument. It is useful for determining support and resistance levels. Purpose The indicator can be used for manual or automated trading as part of an Expert Advisor. For automated trading, you can use values of indicator buffers of the double type: rising line - buffer 0, must not be equal to EMPTY_VALUE. falling line - buffer 1, must not be equal to EMPTY_VALUE.
FREE

Spread Data tool will display current spread and average spread. It will record spread for every hour (from 0 to 23) and can give better data about your broker spread. Run it for 2 days or more to get better spread data . Every spread smaller than MinSpread will be recorded as MinSpread Every spread larger than MaxSpread will be recorded as MaxSpread It help to decide what spread to be used when do backtest, EA spread settings, EA that trade in specific time interval, especially for scalping EA
FREE
This Expert Advisor is the free version of "Bollinger with WPR scalper", which is based on the Bollinger bands and Williams' Percent Range indicators. Limitations of the free version: lot is fixed to 0.01, only the EURUSD currency pair is supported, trading time cannot be selected, trailing stop is not available. Nevertheless, it can make quite a lot of deals, so you do not have to wait for positions to be opened (with the appropriate settings and timeframes below H1). The EA can be used on time
FREE

이 Expert Advisor(EA)는 밤새 이자를 지불(수익)하는 통화 쌍에서 거래가 발생하기 때문에 고수익 저축 계좌와 같습니다. 진입 및 퇴장 위치는 각각 매수 및 매도 주문에 대한 룩백 기간 최저/최고 및 최고/최저 가격을 기반으로 합니다.
공통 입력,
SINGLE_CURRENCY = true, 비활성화된 경우(FALSE) 단일 통화에 대한 작업을 허용하고 메타 트레이더의 시장 감시 창에서 선택한 통화를 거래합니다.
CONCURRENT_ORDERS=0, 여러 주문이 동시에 열리지 않도록 제한합니다.
PIPS=100, 이익 PIPS
MAX_PIPS=1000, Ask 및 Bid 가격에서 최고 및 최저 최저 사이의 최대 PIPS 거리.
MAX_LOTS=100, 거래 계정에서 허용되는 최대 LOTS.
DODDFRANK_COMPLIANCE=false, 미국 기반 계정에서 거래하는 경우 FIFO 위반 수신을 방지하기 위해 FIFO를 활성화해야 합니까?
LOTS=-1, L
FREE

The News Filter based EA Controller (NFC) is a very convenient utility to control the live trading status of your Expert Advisors during important news events. The NFC was programmed to prevent all Expert Advisors of live trading during significant news events. The NFC is resource-efficient and uses the Forex Factory Calendar. It is not necessary to set offset hours dependent on your broker, it will be done by the NFC. The NFC was successfully used and tested under MetaTrader 4 on a personal com
FREE
Price Alert EA for MT4 – Customizable Alert System with Intuitive Chart Interface The CFN Price Alerts EA is a powerful yet easy-to-use Expert Advisor designed for traders who want full control over price level alerts directly from their MT4 charts. No need to manually set alerts through MT4’s native system – this EA gives you an on-chart interface to quickly set, view, and remove price alerts with flexibility. Key Features: Set unlimited price alerts directly on your chart. Visual display
FREE

Exaado Capital care If you've been searching for ways to manage Drawdown control, Drawdown Control, Balance protection, or Daily Drawdown Limit related to trading with Prop Firms, FTMO, My Forex Fund, or Funded accounts, then you've come to the right place. Additionally, if you're looking to safeguard your trading account, we can help. Do you struggle with managing your drawdown while trading funded accounts? Our EA is designed specifically for those in your position. Many prop firms have a "Tra
FREE

Convenient tool for measuring the number of points between the prices directly on the chart. Displays in the measurement between points in percentage, points (financial) and time (bars ). Compatible with all graphical timeframes. When fixed on the chart is displayed in all timeframes. Press Ctrl, click the first point, move the mouse and will now display the measurement. Click again and fix. Very fast tool that does not occupy much space. Input Parameters Line Color Line Style Text Color Text S
FREE

The Scaled Awesome Oscillator (SAO) represents a refined adaptation of the Awesome Oscillator, aimed at establishing consistent benchmarks for identifying market edges. Unlike the standard Awesome Oscillator, which records the variation in pips across different commodities, the only unchanging reference point is the zero line. This limitation hampers investors and traders from pinpointing specific levels for trend reversals or continuations using the traditional Awesome Indicator, a creation of
FREE

The script closes all positions for which the profit is more than 5 pips. Works only on an open pair (on an open chart).
The terminal must have the "Algo trading" mode enabled.
Effective if there are many open positions that need to be closed quickly.
The script does not replace trailing stop or advisor. The script checks all open deals and closes those that meet the condition (profit is more than 5 pips) once at the time of launch.
For the subsequent closing of new profitable positions, y
FREE

The indicator builds alternative quotes based on the average price of a bar and shadows for a specified period of time or according to a fixed body size.
Options:
StartDrawing - the date from which the indicator will build quotes;
PerCounting - period for calculating the average body size and shadows. If AverageBody = 0, then it builds at an average price;
AverageBody - fixed candlestick body size. If greater than zero, builds on this parameter.
FREE

Sends price alerts conveniently to your Android/IOS device. Make sure push notifications are enabled in Metatrader settings and the PC/VPS is online 24/7. Price levels are updated automatically, but you can modify them in global variables, if needed. Suitable for any market instrument, but if notifications are too frequent, increase point value of the indicator parameter.
FREE

LyfUD指标专门 为黄金设计的趋势指标 ,也可以用于任何金融工具。用于及时反映多空力量,由U线和D线组成, 波动以0为中轴偏离运行, U线为快线D线为慢线。 LyfUD指标可以和 绝大多数策略结合使用 ,能够更加有效的把握风控。 U线和D线采用价格行为市场追踪算法,能及时反映市场方向, 可用在任意货币。 特性: 1. U线、D线在0轴上方,买入信号参考。 2. U线、D线 在0轴下方 ,卖出信号参考。 3. U线、D 线极限背离转向,行情可能出现反转。 4. 滞后性低,能及时反映趋势。 致力于结合其他指标,LyfUD和 均线、Pinbar 等搭配使用能迅速找到一些合理的关键位。 LyfUD只作为参考依据,其风险与作者无关。未经作者同意,禁止他售。
FREE
Parabolic Sar easy mode, remake the original p.sar indicator making it more easy to read for novicians traders and experimented traders looking to reduce the time analizing the charts, you can make your own strategy modificating the periods and fusioning it with others indicators like RSI ,stochastic or what you want,its one indicator runs better on high time charts like H4 or D1.
FREE

Trading Hours:
useTradingHours = false; - if it is true, the system opens trades only in defined time;
StartTime = "06:00"; - start time of trading;
StopTime = "18:00"; - end time of trading;
GMT_Offset = 0; - GMT offset;mnvnmkvbb
Trading Days:
Monday = true;
Tuesday = true;
Wednesday = true;
Thursday = true;
Friday = true;
Saturday = true;
Sunday = true;
View settings:
showMenu = true; - if true, EA shows on graph information about open trade
FREE
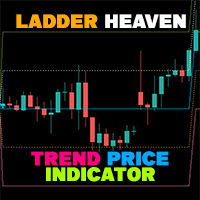
If you have difficulty determining the trend as well as entry points, stop loss points, and take profit points, "Ladder Heaven" will help you with that. The "Ladder Heaven" algorithm is operated on price depending on the parameters you input and will provide you with signals, trends, entry points, stop loss points, take profit points, support and resistance in the trend That direction.
Helps you easily identify trends, stop losses and take profits in your strategy!
MT5 Version: Click here
FREE

It's a simple but useful tool for creating a grid based on Bollinger Bands .
Only 2 parameters can be set: 1) "Period" - the period of all visible Bollinger Bands (i.e. 4) and 1 Moving Average (axis of all Bollinger Bands), 2) "Deviations Distance" - the distance between Bollinger Bands.
Naturally, the colors of all 9 lines can be changed as desired. It works with everything that is available in your Market Watch.
Good luck!
FREE

This is a simple indicator that shows the spread in points. It is useful for those like trade scalper, in addition to be customizable. Functions: Color - I don't need to explain :) Font type - I don't need to explain :) Font size - I don't need to explain :) Aditional text - aditional text after the spread number. Corner - specify the corner where the spread will be written. X position - horizontal distance from the edge. Y position - vertical distance from the edge. Check out our others indicat
FREE

The purpose of this new version of the MT4 standard indicator provided in your platform is to display in a sub-window multiple timeframes of the same indicator. See the example shown in the picture below. But the display isn’t like a simple MTF indicator. This is the real display of the indicator on its timeframe. Here's the options available in the FFx indicator: Select the timeframes to be displayed (M1 to Monthly) Define the width (number of bars) for each timeframe box Alert pop up/sound/ema
FREE
Download your broker's detailed spread data into a simple CSV file When choosing a broker, it is important to choose one that offers the right spreads for you. Ideally, we choose a broker with the lowest spreads. However, a broker will only advertise either the lowest spread they offer, or the average spread. The reality of spread is that it can vary massively and depends on the currency pair, the time of day or the volatility of the market at a given point in time. Some EAs are more sensitive
FREE

The indicator is based on two Moving Averages. Its only difference from traditional indicators is that it is presented as a histogram. The histogram has four colors; each color represents a MA with its own period. In case of a descending trend, if a price is lower than a moving average, the indicator displays a value lower than the red zero level. In case of ascending trend, the indicator value is higher than the green zero level. Parameters: Period MA 1 - Period of the first moving average. MA
FREE

Expert Advisor uses 2 ATR indicators and Bands for Enter trades. the trades will be closed after interaction with second Band indicator. tested and optimized from 2010 on IFCMarkets. default settings for GBPCAD 15m chart. best performance on ranging markets. can be optimize for trading more symbols and timeframes. EA uses grid and method.
trading deposit: 1000 and higher. This EA operates only once per bar opening. Fast methods of strategy testing and optimization are valid.
FREE

Trading Board is a Tool That Help you execute Sell and Buy Operation very smoothly.
General Description : This Tool has this functions: The function of Send Buy or Sell orders. The function to close all orders in the current chart. Choose the volume you need to trade. Calculate of Stop loss and Take Profit with the number of points. Draw the Fibonacci retracement.
FREE
The oscillator indicator " JAngleR " is one of a series of three calculators of the angular deviation of the price chart of a trading instrument.
INPUT PARAMETER: DRAWs =128 - Number of bars to display the indicator in the chart history; Period_IND =14 - calculation period of the indicator in the number of bars; ma_period =1 - Moving Average Period; ma_method =MODE_SMA - moving Method; applied_price =PRICE_CLOSE - applied Moving Average Price. The values of the indicator indicators are degrees
FREE

Investment Castle Indicator has the following features: 1. Dictates the direction of the trend in different Timeframes . 2. Shows the hit rate and winning rate on the chart. 3. This indicator does not repaint the chart. 4. This indicator is built-in the Support & Resistance based Investment Castle EA which works with Psychological Key Levels "Support & Resistance" Indicator.
FREE
StarkerFX EA is a martingale and trend following robot with trailing stop . This expert advisor is using MACD and Parabolic SAR indicators. There are no complicated settings. The only one input is the equity multiplier for automatic lot calculation. If you want to change it, please backtest it before using on real account. higher equity multiplier = higher lots = higher risk (recommended setting is: 1.0) This EA has been optimized for EUR/USD currency pair and for M5 timeframe. Feel free to ba
FREE
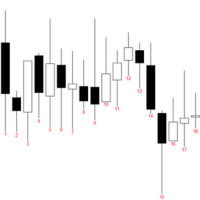
indicator that numbers the bars (candles) in a custom trading session.
The indicator allows: Defining the session start time (StartHour and StartMinute) Displaying numbers only on odd bars (if AfficherUniquementImpairs is true) Displaying numbers on the last N days (NbJours) Customizing the color and font size of the text The indicator will loop through the bars of the last N days and, for each day, start counting from the session start time.
It will display the bar number (starting at 1) belo
FREE

The indicator is designed to determine the pivot level for a group of candlesticks and the trend direction. no repainting calculation is done on an active candle if candlesticks are above the main line, the trend is upward if candlesticks are below the main line, the trend is downward breakdown of the main line signals a trend change or a price rebound two display modes, normal and with acceleration (ModeLite) an auxiliary line displays the resistance line
Configurations BarsHistory - how many
FREE

This indicator helps the trader to make the final decision. When you have already decided in which direction the price will unfold, it remains as accurate as possible to determine the reversal itself. This is the task performed by the Konkov indicator. The indicator is installed on M1 and M5 charts. Indicator parameters: for M1 chart time_frame1 5 time_frame2
FREE
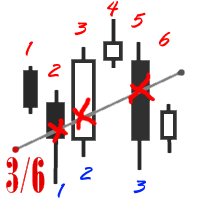
The utility simplifies the search for maximum bars accumulation levels. These levels can be used both for technical analysis and trading actions, like setting a stop loss or pending orders. Additional analytical methods are recommended for levels confirmation.
How it works Сounter mode (enabled by default). In the Сounter mode, draw a trend line on the chart and the utility will specify its length in bars as well as the number of bars the line crosses. When moving a trend line, the utility re-c
FREE

'BrokerInfo' is an indicator to show some information of account on the chart. You can to see on chart information about: GMT time. Broker time. Maximum simultaneously open orders. Leverage. Maximum lot size. Minimum lot size. Lot step. Stop level in pips. Symbol spread in pips.
You can to get source code from here .
Parameters SizeBackground – background size. PositionUpDn – position to show info on the chart.
FREE

The Stochastic RSI (StochRSI) is a technical indicator that combines the characteristics of the Relative Strength Index (RSI) with the Stochastic Oscillator, resulting in a more sensitive tool that generates a higher number of trading signals. Developed by Tushar Chande and Stanley Kroll, the indicator was designed to overcome a perceived limitation of the traditional RSI: the low frequency of overbought and oversold levels activation (commonly 80 and 20), especially in less volatile assets. How
FREE

This indicator is designed to detect the best divergences between price/MACD and price/RSI. MACD and RSI produce by far the best divergence signals therefore this indicator focus on those two divergences. This is the FREE version of the indicator: https://www.mql5.com/en/market/product/28375
Important Information How you can maximize the potential of the scanner, please read here: www.mql5.com/en/blogs/post/718074
The free version works only on EURUSD and GBPUSD! This indicator scans for you u
FREE

EA Undead is fully automated bot to generate a stable profit from the volatile FOREX market. This EA will never depend on any indicator.
How this EA works? At the very first it will open a Buy order and Sell Order at same time. And by default take profit will be 15 Pips for all orders. Once take profit reaches it will Re-Open that order. If the market goes against any order than it will add more positions, by default 50 Pips away from last open trade. To minimize the draw-down and loss and to b
FREE

Detailed post explained:
https://www.mql5.com/en/blogs/post/759269
This is a slope indicator for Bollinger Bands indicator. It provides slopes for BB top band, center band (main) and Lower Band. You can also set a threshold value for Center line to control Red/Green slope histogram lines. Settings:
You can choose which line you need the slope and Threshold Alerts for in Drop down.
Slope Thresholds: for Alerts. Please note that Alerts only happen when Threshold is crossed. e.g.: If Threshold
FREE

AC Pivot Panel – Your Ultimate Pivot Trading Tool The AC Pivot Panel is a powerful yet user-friendly pivot point indicator designed to help traders identify key support and resistance levels with ease. Whether you’re a beginner or an experienced trader, this indicator simplifies pivot trading and enhances your decision-making process. Key Features : Interactive Selection Panel : Easily adjust pivot settings directly on the chart with a compact and intuitive panel. Multiple Pivot Methods : C
FREE
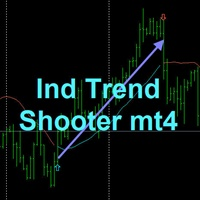
TREND SHOOTER Without alerts
It is a trend indicator based on moving averages that very efficiently calculates changes in market direction.
This has the ability to anticipate changes of direction very early.
FEATURES
This indicator particularly draws two moving averages that are used only to show color changes. they can wear these moving stockings as they wish as they do not affect the color change behavior bullish blue color
bearish red color where the line is interrupted it is not reco
FREE

고양이 추세는 정확하고 수익성있는 진입 신호를 가진 지속적으로 개선되는 지표입니다.
캣트렌드 브이지레터 라인은 트렌드 방향에 따라 색이 바뀌고,인디케이터는 가격 반전 포인트에서 화살표를 그립니다.
또한 고양이 트렌드 표시기는 화살표 모양에 대한 소리 및 텍스트 경고를 구현합니다.
중요:표시등이 다시 그려지지 않습니다.
고양이 트렌드의 주요 특징: 분석 기능
모든 통화 쌍 및 시간 프레임에서 사용할 수 있습니다; 표시기가 다시 그려지지 않습니다; 그것은 다른 지표에 큰 도움이됩니다; 입력 할 필터가 필요하지 않습니다; 그래픽 기능
차트의 최소 위치 수를 차지합니다; 유연한 팅크; 쉽게 배울 수;
고양이 트렌드의 주요 특징: 설정
길이 스무딩 깊이; 단계는 -100 내에서 변화하는 매개 변수입니다... +100,전환 프로세스의 품질에 영향을 미칩니다; 시프트-시간 축을 따라 표시기의 시프트; 입력 가격 세관-지표가 계산되는 가격 선택(0-"닫기",1-"열기",2
FREE

The e-FastCHF EA is developed for GBPCHF. The EA has no trading limitations only on GBPCHF. 16.01.2015. The Swiss National Bank decided not to support the EUR/CHF course on the level of (1.20). Now it is pegged not to EUR but to USD. Our strategy is based on this fact. Tests have been performed from 02.01.2015. Timeframe – М15 Currency pair – GBPCHF No Martingale Calculation of lot basing on the balance (risk per trade). Supporting ECN accounts. This option operates as follows: first a position
FREE

Market Dashboard FREE Indicator gives you advanced information’s about your selected Symbols in MarketWatch
Features
Daily Price Movements (M1 – D1) RSI Values with Highlight Function for your current Timeframe & H1 & H4 Profit per Symbol and traded lots (buy & sell) EMA 5 – 100 based on selected period Swap Information (which direction is positive) FIBO Info & Tracking (highlighted FIBO Levels close to current price – based on selected period) One Click ChartOpen this Version is limited to 2
FREE

The indicator draws two simple moving averages using High and Low prices. The MA_High line is displayed when the moving average is directed downwards. It can be used for setting a stop order for a sell position. The MA_Low line is displayed when the moving average is directed upwards. It can be used for setting a stop order for a buy position. The indicator is used in the TrailingStop Expert Advisor. Parameters Period - period of calculation of the moving average. Deviation - rate of convergence
FREE

TrendPeakValley Scanner v1 – Advanced Reversal Detection Tool
TrendPeakValley Scanner v1 is a powerful custom indicator designed to detect price peaks and valleys based on price action analysis. It visually highlights local tops and bottoms, making it ideal for traders who rely on market structure, support/resistance zones, and reversal patterns.
---
Key Features:
Peak & Valley Detection: Scans historical price action and identifies swing highs/lows based on customizable sensitivi
FREE

This is a Semi Automated OTE EA based on the free teachings of ICT. One of the biggest challenges in trading is related to executing and managing trades. After analyzing charts, draw an OTE Fibonacci and turn on the EA. It will automatically execute orders based on the Fibonacci level of your placement and protect any open positions when in profit. Please review the documentation that accompanies this product.
Auto Lot Calculation Based on Risk Percent
Auto SL and TP
Auto BE
Risk Per
FREE
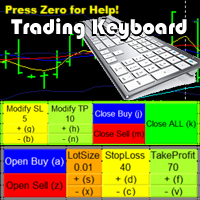
Trading Keyboard Tool will enable you to: Easily OPEN/CLOSE/MODIFY orders with Keyboard and with Buttons on Screen. Modify Order parameters with shorcuts.
Export different Prices into a file for analysing outside MT4. Save Chartscreen into an image. Show Fibonacci on screen with shorcut.
You can export these Prices into files:
COHL : history of Close,Open,High,Low in one file.
Close - history of Close in one file. Open - history of Open in one file. High - history of High in one file.
FREE

Support/Resistance Percent Rank
SR Percent Rank helps to see how many times the current close price has been in the past price range. SR Percent makes a loop over x bars into the past and calculates the percentage of times the current closing price has been between the high and the low price in the x bars before that. So we can determine if the current price is moving at supports or resistance that was formed in the past. I use the indicator when creating strategies with the StrategyQuant X pr
FREE

This is a reduced version, demo if you like, of the published Elliott Wave Tool 7Pasos . The limitations for this tool vs Elliott Wave Tool 7pasos are the following: Only one account possible, the original tool has 1 principal and 4 alternative accounts. Only one degree (Primary) is available, in the original tool 12 different degrees (6 in micro) are at your disposition. As only one degree is available, the functions to upgrade and downgrade the degree of the selected wave are disabled. Fixed c
FREE
The ' Session Spreads ' indicator was created to show spreads, their instances and averages, over the seven main sessions. This shows the most average & useful spreads occurring the most on the seven main sessions on chart, and via/CSV files. Key Features 7 Sessions automatically adjusted to the broker GMT & DST for logging spreads. Spreads logged per session with overlays equally processed on all applicable. Instances of spreads logged per spread amount that shows the most average. Average spr
FREE

Automatic advisor designed for the forex market.
This trading robot is based on breakdown of trading levels.
All types of accounts are suitable, but it is better to use accounts of the Standard and ECN types.
The timeframe can be used any, but not higher than 1H. The system is waiting for breakdown of the level and closing of the bar. In simple language, you can set the time interval more simply you can skip a signal or it's too late to go into a deal.
The Expert Advisor always displays Stop
FREE

RangeMasterFX combines trend analysis and technical indicators based on multiple timeframes. Multi-Timeframe Analysis: Analyze trends on three timeframes: daily (D1), 4-hour (H4), and 1-hour (H1). RSI Filter: Uses the RSI (Relative Strength Index) to identify overbought and oversold market conditions and filter entries. Trailing Stop: Apply trailing stops when positions move in your favor to maximize profits. Dynamic Stop Loss and Take Profit: Dynamic stop loss and take profit depending on marke
FREE

Stocks Trade — 머신러닝 기반의 섹터 특화형 트레이딩 로봇 저희는 엄격히 제한된 트레이딩 상품 섹터와 결합된 가장 효율적인 포트폴리오 접근 방식을 선보입니다. 주요 목표는 사전 준비 없이도 누구나 미국 주식 거래를 시작할 수 있도록 하는 것입니다. 가능한 한 많은 안정적인 미국 주식을 동시에 거래하여 단기간 내에 유의미한 수익을 달성하면서도 예치금의 최대한의 안전성을 보장합니다. 제품에 대한 자세한 정보를 얻고 기능을 확장할 수 있도록 도와주는 링크 다음과 같은 경우: 해당 로봇의 MetaTrader 5 버전 동일한 로봇이지만 28 개 통화쌍 거래용 동일한 로봇이지만 암호화폐 거래용 저희 Telegram 커뮤니티 — 소통, 지원, 업데이트 동일한 기술 기반의 보다 진보된 무료 버전 동일한 기술 기반의 초고급 유료 버전 이 로봇은 누구를 위한 것인가요? 차트에 로봇을 설치하기만 하면 미국 주식을 주요 자산으로 단기간에 수익을 얻고자 하는 분. (로봇은 사전 설정 없이 바로
FREE
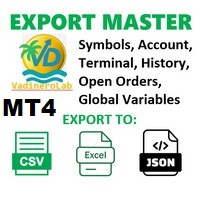
VadineroLab MT4 Export Master to CSV EXEL JSON - Expert Advisor for exporting and analyzing symbols, account, terminal parameters, active trades, current account state, trading history, global variables. Generates the following report types: * Symbols Parameters — spread, tick size, min/max lot, swap, … * Account Parameters — balance, equity, leverage, currency, margin info, … * Terminal Parameters — server, version, language, date, environment, … * Trade History — orders, deals, positions, se
FREE

Infometer индикатор для вывода информации в одном из углов - сколько пунктов (пипсов) или в валюте депозита профита во всех отрытых ордеров данного торгового инструмента. В меню индикатора внесены такие данные 1. Угол вывода информации. 2. Цвет вывода информации. 3. вывод валюты депозита и пипсов. 4. Выбор вывода информации - профит и пункты - профит -пункты. На белом фоне автоматически информация выводится черным цветом на других фонах цвет вывода информации определяется в меню.
FREE

Pipsurfer Tide Meter is a Momentum Indicator that is designed to help trades know which way the "Tide" is turning. This indicator is a great supporting indicator to the pipsurfer main indicator that is listed in MQL5 under "Pipsurfer Indicator"
The Strategy Behind the Tide Meter is that youll see the blue bars and the red bars. Blue bars are for bullish momentum Red bars are for bearish momentum Use price action to find a trading zone then wait for the tide meter to change color then you ent
FREE

Dear Friends,
Please rate this application for the better
Optimal Lot Size Calculator is a Utility tool to calculate the optimal lot size based on your risk percentage on your capital amount. Also you can set your reward Percentage and place your order from the tool itself. You can place all types of orders(Market orders,Limit orders and Stop orders) with stop loss in pips or price level. So will save your time and also easy to place orders with your risk management.
For Limit and Stop ord
FREE

HJZHI88888888888888888888888888888888888888888888888888888888888888888888888888888888888888888888888888888888888888888888888888888888888888888888888888888888888888888888888888888888888888888888888888888888888888888888888888888888888888888888888888888888888888888888888888888888888888888888888888888888888888888888888888888888888888888888888888888888888888888888888888888888888
FREE

The London Stock Exchange Session's Hours
This indicator facilitates observing the currency pair's quotations during subsequent parts of the stock exchange session live. Before the session starts, a rectangle is drawn on the chart but not filled in with color. It means the extent of the session duration. Before the first bar enters the rectangle of the session, a sound signal or pop-up window will notify us that the session will just start. When the price graph crosses the edge of the session
FREE

A script that allows you to deselect all selected items on the current chart.
Very simple, but at the same time can be a very useful script, especially when a keyboard shortcut is assigned to it.
MT4 has the same functionality under the right mouse button, but using the keyboard shortcut running this script is much faster and more convenient.
The script does not have any input parameters.
Have fun using this free tool.
FREE

n3oNpLoX Trade Manager Market Order. Stop Order. Limit Order.
To help you Place trades based on the amount of Money in Dollars you want to risk. As it will show in the screenshots you can calculate the right Lot size for the money you want to risk. Calculates Lot Size based on the distance between Stop Loss and Entry Point. 5 Options for TP - (1RR,2RR,3RR,4RR,5RR)
It will help you manage your risk and Place trades with the correct Lot Size. So you will not over expose yourself and your money
FREE

StarBody è un indicatore istogramma che rappresenta la dimensione delle candele in relazione al loro volume ed evidenzia quelle più grandi delle precedenti. La formula per il calcolo dell'altezza dell'istogramma è semplice quanto efficace: Ampiezza * Volume La grafica indicherà tutte le candele più estese delle precedenti in base alle impostazioni scelte.
L'indicatore può essere utile, a volte indispensabile, nelle strategie che prevedono lo sfruttamento della continuazione del trend. Le strate
FREE
MetaTrader 마켓은 거래 로봇과 기술 지표들의 독특한 스토어입니다.
MQL5.community 사용자 메모를 읽어보셔서 트레이더들에게 제공하는 고유한 서비스(거래 시그널 복사, 프리랜서가 개발한 맞춤형 애플리케이션, 결제 시스템 및 MQL5 클라우드 네트워크를 통한 자동 결제)에 대해 자세히 알아보십시오.
트레이딩 기회를 놓치고 있어요:
- 무료 트레이딩 앱
- 복사용 8,000 이상의 시그널
- 금융 시장 개척을 위한 경제 뉴스
등록
로그인
계정이 없으시면, 가입하십시오
MQL5.com 웹사이트에 로그인을 하기 위해 쿠키를 허용하십시오.
브라우저에서 필요한 설정을 활성화하시지 않으면, 로그인할 수 없습니다.