TwoLinesMACD
- インディケータ
-
Liu Chun Xiao
 一手财富sygdpx.com成立于2012年12月,总部坐落于国际金融中心香港尖沙咀丽斯中心。-手财富是福汇集团(代码:FXCM)亚太地区顶级的业务合作伙伴。我们协助福汇在亚太地区进行业务拓展和渠道推广,并为广大零售交易者和代理商提供多元化交易衍生品(外汇,黄金,原油,美股,股指等)市场专业、可靠、稳定的超高品质服务:包括精准的每日市场焦点和基本面分析报告,丰厚的高返佣比例及代理培训计划,专业的EA软件编程等。迄今为止我们已经服务客户数量超过上万名,并得到亚太地区广大交易者的认可。
 - バージョン: 1.0
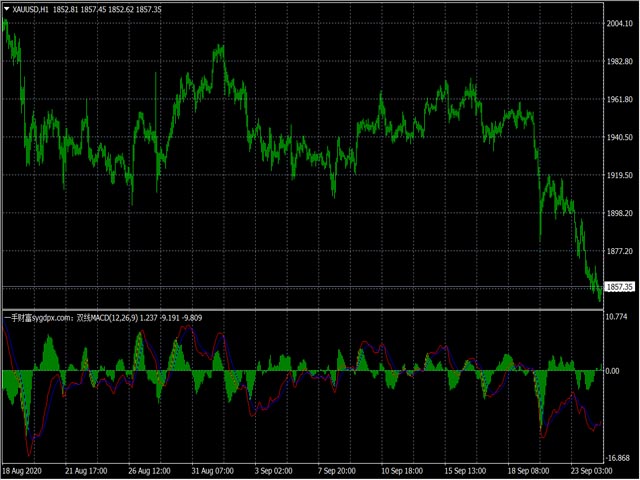
Two Lines MACD
Many people who conduct technical transactions on MT4 like to use MACD to judge the turning or continuation of the market. When everyone uses the MACD indicator that comes with MT4, they find that the indicator is a single-line MACD, and the histogram seems to be similar to the past. The MACD that I understand does not match. In order to provide traders with a perfect trading experience, we especially provides free two-line MACD indicators for all traders!
The single line in the single-line MACD in MT4 is actually equivalent to the fast line in the two-line MACD, and the histogram of the single-line MACD is equivalent to the slow line in the two-line MACD (but the calculation method is slightly different, the former is SMA, the latter is EMA), and the former is displayed in the form of a histogram, and the latter is displayed as a curve in the two-line MACD. At the same time, the difference between the two indicators of the two-line MACD is not reflected in the single-line MACD.
For specific details, please see: http://www.sygdpx.com/jywt/6696.html
Perfect traditional looking MACD