Regardez les tutoriels vidéo de Market sur YouTube
Comment acheter un robot de trading ou un indicateur
Exécutez votre EA sur
hébergement virtuel
hébergement virtuel
Test un indicateur/robot de trading avant d'acheter
Vous voulez gagner de l'argent sur Market ?
Comment présenter un produit pour qu'il se vende bien
Expert Advisors et indicateurs pour MetaTrader 4 - 37
The MACD 2 Line Indicator is a powerful, upgraded version of the classic Moving Average Convergence Divergence (MACD) indicator.
This tool is the embodiment of versatility and functionality, capable of delivering comprehensive market insights to both beginner and advanced traders. The MACD 2 Line Indicator for MQL4 offers a dynamic perspective of market momentum and direction, through clear, visually compelling charts and real-time analysis.
Metatrader5 Version | All Products | Contact
FREE

Galdhopiggen Pro — Portfolio Intraday Trend EA Galdhopiggen Pro is a fully automated intraday trend-following EA designed for multi-pair portfolio trading.
The system focuses on stable equity growth, strict risk control, and intelligent trend-based entries. Trading Logic Trend Filter (SMA):
Only BUY trades above SMA, only SELL trades below SMA. Entry Filter (M30/H1): Stochastic < 20 + bullish candle → BUY Stochastic > 80 + bearish candle → SELL Maximum 1 position per symbol . Risk Managem
FREE

L'indicateur Candle GAP est un outil essentiel pour les traders utilisant les stratégies de Gap Trading car il identifie automatiquement les écarts de bougie pour chaque jour de la semaine. Un écart fait référence à une différence de niveau de prix entre la clôture et l'ouverture de deux jours consécutifs. Cet indicateur reconnaît quatre types de schémas d'écart : commun, de rupture, de continuation et d'épuisement. En incorporant cet indicateur dans n'importe quel graphique, les traders
FREE

Symmetrical Triangle Pattern Indicator - Mastering Trend Recognition in MetaTrader Unlock the power of trend recognition with the "Symmetrical Triangle Pattern" indicator for MetaTrader. This innovative tool simplifies the identification of symmetrical triangle patterns, providing traders with clear signals for potential trend continuation or reversal. Elevate your trading strategies with this MQL offering. Key Features : Accurate Pattern Recognition : The Symmetrical Triangle Pattern Indicator
FREE

Indicator Overview The Final Gold Cup is a complete trading system designed to simplify technical analysis. It combines the most powerful trading tools into one user-friendly package, giving you a crystal-clear view of price action and helping you make informed trading decisions. The indicator works efficiently across all assets and timeframes. [ Illustrative Image of the Indicator on the Chart ] Key Features Dynamic Support & Resistance Zones: Automatically plots the most significant support a

MT5 version Overview
The Lowess Channel indicator is a smoothed trend-following tool designed to help traders identify the direction of the trend , detect flat or ranging markets , and spot breakouts from consolidation zones. It creates a central smoothed line with upper and lower channel boundaries, adapting to market noise while maintaining clarity. How It Works The indicator builds a channel around a smoothed price line. The central line reflects the current trend. The upper and lower bound
FREE

Cleopatra AI Empress: Precision Trading Crafted for Serious Traders Hello, traders! Meet Cleopatra AI Empress , an expertly designed Expert Advisor (EA) for the MetaTrader 4 (MT4) platform. This EA is crafted with precision to help traders like you leverage key market movements with refined strategies. Join the Cleopatra AI Empress Community on Telegram! Why Cleopatra AI Empress Chooses "Buy Stop" Orders Cleopatra AI Empress uses "Buy Stop" orders as a strategic part of its breakout approach, s
FREE

This is a RISK MANAGER utility for MetaTrader. To activate it, after downloading it, you must enable all autotrading controls on MetaTrader, as with EXPERT ADVISORS. The user must enter control settings as indicated in the indicator properties, which initially have default data. RISK MANAGER will perform checks and display pop-up alerts when certain behaviors exceed the user-entered settings. It's free; use it, try it, develop it, or contribute ideas. It's just a utility; the programmer assumes
FREE

Session Killzone Indicator
Indicator that helps you to identify the killzone times of both London and NewYork sessions which usually is the most times for high volatility and taking liquidity from the market. Killzone times are configurable through indicator parameters. The indicator adjusts the range of the killzones based on the daily trading range.
FREE

The free version of the Hi Low Last Day MT4 indicator . The Hi Low Levels Last Day MT4 indicator shows the high and low of the last trading day . The ability to change the color of the lines is available . Try the full version of the Hi Low Last Day MT4 indicator , in which additional indicator features are available : Displaying the minimum and maximum of the second last day Displaying the minimum and maximum of the previous week Sound alert when crossing max . and min . levels Selecting an arb
FREE

Tarantula is a trend Expert Advisor that looks for entry points based on the standard Moving Average indicator. It works with two timeframes selected in the settings. The EA looks for the points of trend change and opens an order when the signal matches on different timeframes. All orders are protected by stop loss. However almost all orders are closed by the EA on a signal change.
Parameters SL - stop loss. TP - take profit. OnWork_1 - enable/disable searching for signals on the first timefram
FREE

Volume Footprint Analysis is a precision-engineered, volume-based indicator that transforms raw market volume into an intuitive, color-coded signal system. Built on concepts from Volume Spread Analysis (VSA) and Smart Money principles, this tool removes the guesswork from volume interpretation and gives traders clear, actionable insights on when to buy or sell — on any timeframe and across any trading instrument. MT5 Version - https://www.mql5.com/en/market/product/138565/ Join To Learn Mark

Drawdown Alerts Free ! Meta Trader 4 Indicator. Please leave a review about this product to help other users benefit from it. This Drawdown Alerts indicator shows the drawdown percentage in real time and alerts you when the limit you specify is reached. Calculation of drawdown depends on the amount of the trade balance. You can customize Drawdown Alerts for Corner - Left , Right , Up , Down X Y Color Number of decimal digits Popup messages and sound - Turn on / off notifications Notification
FREE
Restez en avance sur l’élan du marché avec le Pip Movement Alert MT4, un indicateur polyvalent multi-devises conçu pour suivre et alerter les traders sur des mouvements précis en pips à travers plusieurs symboles, idéal pour le trading de forex, actions, cryptomonnaies et matières premières. Loué dans les communautés de trading telles que Forex Factory et Reddit’s r/Forex, et mis en avant dans les discussions sur Investopedia et TradingView pour sa capacité à détecter les changements soudains du
FREE

This indicator is the basis for an Expert Advisor that can be categorized as "almost Grail". See details below. This indicator displays the projection of the Renko chart on the price chart. This projection is displayed as a stepped line, not as "bricks" (rectangles). See slides 1 and 2. Abbreviated name of the indicator: LRC – L ine of R enko on the price C hart. The principle of its construction is very simple. First, a grid of horizontal lines (levels) is bu
FREE
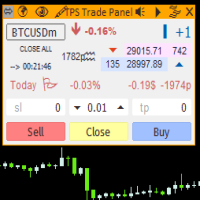
"TPS Trade Panel: Your Gateway to Effortless Trading
Introducing the TPS Trade Panel – the ultimate tool to streamline and enhance your trading experience across financial markets. Whether you're a novice or a seasoned trader, this feature-rich panel empowers you to execute trades swiftly and make informed decisions with ease.
Efficient Order Execution: Execute trades across multiple financial instruments without the need to navigate through complex menus. With a few clicks, you can open, clo
FREE

Djuba Breakout System
Djuba Breakout System is a fully automated breakout trading system.
Features
1. 100% Free
2. 100% automated trading system
3. No Martingale, No Grid
4. Trade with SL & TP
Recommendations
1. Pairs: EURUSD, GBPUSD
2. Timeframe: H1
Parameters
1. Lots: default lots. ignored if LotsFor1K > 0
2. LotsFor1K: lots per 1000 USD
3. MaxOrders: please set to 10
4. TestGmtOffset: the GMT offset for the backtest
FREE

Multi timeframe fractal indicator which shows the higher timeframe's fractal point on lower timeframes.
Parameters Fractal_Timeframe : You can set the higher timeframes for fractals. Maxbar : You can set the maximum number of candles for the calculations. Up_Fractal_Color, Up_Fractal_Symbol, Down_Fractal_Color, Down_Fractal_Symbol : Color and style settings of the fractal points. Extend_Line : Draws a horizontal line from the previous fractal point until a candle closes it over or a user-specif
FREE

Donar EA is a sophisticated automated trading Expert Advisor (EA) designed for MetaTrader 4 platforms. This algorithmic trading system provides intelligent trade management with customizable parameters to suit various trading strategies and risk profiles. Key Features: Adaptive trading time windows Configurable trade direction (Buy, Sell, or Both) Robust risk management Dynamic lot sizing Comprehensive performance tracking Trading Methodology: The EA employs a strategic approach to market entry
FREE
This indicator draw a watermark on the chart, with the timeframe and symbol name. You can change everything, including add a aditional watermark. Functions: Symbol watermark: Size - text size. Font - text font. Color - text color. Background text - watermark at foreground or background mode. Horizontal correction - x correction in pixels. Vertical correction - y correction in pixels. Separator period X symbol - what will separate the period from symbol. Aditional watermark: Enable custom
FREE

Sirr Smart AI Express 3 for MT4 EA is an automated and easy to use expert advisor that has the Stochastic indicator working in combination with RSI and MACD filters built in. We have spent a lot of time testing many expert advisors . After years of testing and development, the result is an dynamic EA that is very active with trades and capital management. Our product is also fully compatible with PipFinite Trend Indicator PRO as well. The EA has been designed for trading with the popular symb
FREE
Unlock Smarter Trades with Candle Sync Pro! Are you tired of conflicting signals across different timeframes? Do you wish you had a clearer view of the market's true direction? "Candle Sync Pro" is your essential tool for making more confident and informed trading decisions! This powerful indicator cuts through the noise, allowing you to see the bigger picture by visualizing higher timeframe candles directly on your current chart. No more switching back and forth, no more guesswork – just pure,
FREE
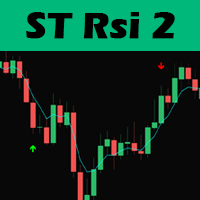
Hello traders, this trading strategy is based on the the Larry Connors RSI-2 strategy, We begin with a 200 periods EMA to find the direction of the market. This is important because we only trade in the main trend direction.
We then look for pull backs using the RSI with a period of 2 to get entry signals. Trades are then exited using the 5 EMA.
Lot size should be calculated using 1% of 1 the ATR value and positions can be added as long as the entry criterion is met.
TRADING IS RISKY AND I D
FREE

This indicators automatically draws the support and resistances levels (key levels) for you once you've dropped it on a chart. It reduces the hustle of drawing and redrawing these levels every time you analyse prices on a chart. With it, all you have to do is drop it on a chart, adjust the settings to your liking and let the indicator do the rest.
But wait, it gets better; the indicator is absolutely free! For more information: https://youtu.be/rTxbPOBu3nY For more free stuff visit: https:
FREE

Scalping arrows not redraw - an indicator that shows price reversal points on the chart and does not redraw its signals. Also, the indicator sends signals to the trader via Email and Push. The accuracy of the signals of this indicator is approximately 92-94% on the M5 timeframe and more than 95% on the H1 timeframe. Thus, this indicator allows the trader to accurately open trades and predict further price movement. Price reversal points on the chart are indicated using simple and understandable

Gold Trading Bot Description: MSTrade Xauusd Scalping Overview:
MSTrade Xauusd Scalping is a non-Martingale Expert Advisor (EA) designed for XAU/USD (Gold) trading. It focuses on capital preservation, strict risk management, and low drawdowns by executing one trade at a time. The bot uses technical analysis, volatility filters, and adaptive risk controls for consistent performance in all market conditions. Key Features: Non-Martingale Strategy Single-Trade Focus: Opens one position per direc
FREE
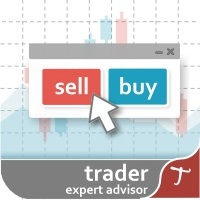
Tipu Trader is a part of Tipu Panel ecosystem that was developed out of need for quick and simple trading. Tipu Trader is an easy to use trade panel for commonly used trade functions. Create you own signals with Tipu Panel and trade along with Tipu Trader, a simple and easy to use trade panel.
Features An easy to use trade panel for most commonly used trade functions. Create your own personal trade signals with Tipu Panel , and trade with Tipu Trader. Customizable Panel. The panel can be moved
FREE

Spline Searcher MT5 — Indicateur multi-devises pour la détection précoce de splines de prix et de points d’intérêt Outil auxiliaire pour la détection et la visualisation automatiques des stades initiaux de formations complexes de prix. L’indicateur est destiné exclusivement au trading manuel et convient aux traders qui expérimentent la détection précoce de formations ou tendances de marché plus complexes, dont des formations plus simples peuvent faire partie. Il identifie jusqu’à six types de f
FREE
Automatic trend-following Expert Advisor. Completely based on technical analysis. It opens a position at matching entry points from the indicators Top Bottom, Keltner and trend line. Martingale is not used, but it can be enabled in the settings, if necessary. Uses fixed stop loss and take profit, closes positions only by stop loss and take profit, and also by opposite signals. Automatically stops trading at the specified minimum deposit value (disabled by default). Works on the specified timefra
FREE

After your purchase, feel free to contact me for more details on how to receive a bonus indicator called VFI, which pairs perfectly with Easy Breakout for enhanced confluence!
Easy Breakout is a powerful price action trading system built on one of the most popular and widely trusted strategies among traders: the Breakout strategy ! This indicator delivers crystal-clear Buy and Sell signals based on breakouts from key support and resistance zones. Unlike typical breakout indicators, it levera
ChartFix – Fixed Scale and Pan Chart Controls for MT4 ChartFix is a lightweight indicator that adds convenient on-chart navigation tools to MetaTrader 4. The controls are designed to offer a chart interaction style that creates an optional switch between MT4 default auto scale feature and a fixed scale chart that can be moved up and down and easily scaled vertically. Main Functions Zoom In / Zoom Out – Adjust the chart scale directly from on-screen buttons. Scale Mode Switch – Toggle between MT4

This is my first advisor . To get straight to the point : the Alligator Indicator Advisor is trading better on 1H And 4H . The system is as follows: opening orders at the intersection of indie lines , if the price goes against the trend , a grid opens along the distance ( without martingale ) , Profit is fixed according to the profit specified in the parameters . ( averagin system ) . The grid lot is in % of the balance . The Risk variable . Variable ( Buy or Sell ) MaxOrders is the number of
FREE

Donchian channels are a tool in technical analysis used to determine the relative volatility of a market and the potential for price breakouts.
Can help identify potential breakouts and reversals in price, which are the moments when traders are called on to make strategic decisions. These strategies can help you capitalize on price trends while having pre-defined entry and exit points to secure gains or limit losses. Using the Donchian channel can thus be part of a disciplined approach to managi
FREE

This indicator calculates Correlation among currency pairs (Selected by user) to find the least and/or most correlated symbols in real time. Correlation ranges from -100% to +100%, where -100% represents currencies moving in opposite directions (negative correlation) and +100% represents currencies moving in the same direction.
Note The Correlation more than 80 (Adjustable) between two currency pairs, Shows that they are quite similar in the kind of movement and side. The Correlation less than

If you trade or wish to trade the popular HLHB Trend-Catcher System, then this indicator is for you! It detects when the HLHB system entry rules are met and sends out an alert in the form of notifications to your mobile phone and to your pc. By automatically sending you notifications, this indicator lessens your trading work load as you don't have to sit in from of your pc all day checking all the chats for when the entry rules are met. This indicator does all the dirty work for you. When the si
FREE
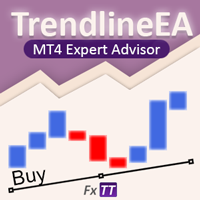
Trendline EA pour MetaTrader 4 MetaTrader 4 ne propose pas de fonctionnalité native permettant de placer ou de gérer des ordres directement à partir de lignes de tendance. Cet Expert Advisor étend le comportement standard de la plateforme en permettant l’exécution de trades et d’alertes basés sur des lignes de tendance tracées manuellement sur le graphique. Le Trendline EA pour MT4 est conçu pour aider les traders à appliquer des actions prédéfinies lorsque le prix interagit avec des lignes de t

L'EA UZFX Daily Trade Guard est un outil simple et puissant de gestion de compte et de gestion des risques pour MetaTrader 4 (MT4), conçu pour protéger votre compte de trading en surveillant les limites quotidiennes de profits et de pertes. Créé par (UZFX LABS), un expert forex de confiance, cet Expert Advisor (EA) n'ouvre pas de transactions, mais se concentre sur l'application de vos règles de gestion des risques afin d'arrêter le trading lorsque les limites sont atteintes. Il aide les traders
FREE

Fibonacci SR Indicator
This indicator creates support and resistance lines. This indicator is based on Fibonacci Retracement and Extension levels. It will consider many combinations of the Fibonacci levels and draw support/resistance lines based on these. This indicator uses tops and bottoms drawn by the ZigZag indicator in its calculations. The ZigZag can also be drawn on the chart, if necessary. The indicator considers many combinations of past reversal points and Fibonacci ratio levels, and w
FREE

This indicator show candle time remaining. The remaining time of the candle is calculated every 200 milliseconds. 1. You can set x (horizontal), y (vertical) of text. 2. You can set font, color, size of text. 3. You can remove the text without having to remove the indicator from the chart. The remaining time of the candle depends on the timeframe of the chart with the indicator.
FREE

SniperGrid Shield EA — fully automated grid + hedge trading robot
Brief description SniperGrid Shield EA is a fully automated Expert Advisor using its own SGS_Signal to open high-quality trades and manage them via controlled grid and optional hedge logic.
Trading strategy The EA works in three layers:
Main trade — opens a single position per cycle based on SGS_Signal (optional ADX filter for trend confirmation).
Controlled grid — if price moves against the main trade by a user-defined ATR d

This indicator uses the Zigzag indicator to identify swing highs and swing lows in the price chart. Once it has identified the swing highs and swing lows, it can use them to determine potential support and resistance levels. A support level is formed when the price drops and bounces back up from a swing low, indicating that there is buying pressure at that level. A resistance level is formed when the price rises and reverses downward from a swing high, suggesting selling pressure at that leve
FREE

This indicator will show yesterday and today high low, very useful to understand the market sentiment. To trade within the range/ break out. Previous day low- can act as support- can used for pull back or break out Previous day high- can act as resistance- can used for pull back or break out The previous day high low breakout strategy refers to the day trading technique that provides traders with multiple opportunities to go either long or short . The main idea is to identify the trend in its m
FREE

Guide d'Utilisation du Turbo ATR Scalper Paramètres Principaux Paramètre Valeur par Défaut Description Période du Canal 30 Période pour le calcul du canal de trading Lot Automatique true Calcul automatique de la taille de position Lot Fixe 0.2 Taille de trade fixe Risque 10% Pourcentage de risque du compte Ordres Max 10 Nombre maximum de trades ouverts Période ATR 3 Période de l'indicateur de volatilité Multiplicateur SL 45.0 Coefficient de Stop Loss Multiplicateur TS 0.5 Coefficient de Trail
FREE
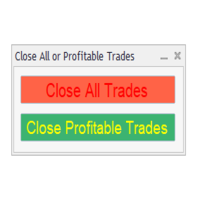
This EA creates two buttons in a panel that you can drag to any part of the chart (simply click on the panel and drag with the mouse to the part of the chart you want) with which you can close all the open operations in the account with a simple click, or close only the trades that are currently in profit. Check out my new trade dashboard assistant : Simple and Easy MT4 Trade Panel Tell me if you like the product and how it could be improved, Thanks :)
FREE

RRS Scalping is based on the Grid strategy, which involves increasing the lot size opposite to the price movement and waiting for recovery. Grid is usually a very medium risk technique, but this EA is built on well-calculated mathematics to minimize drawdown, reduce risk, and maximize profits. Refer for information about EA settings : https://docs.google.com/document/d/1cvg-qVqGrU5OaNUfd9AErpLSqYQ9gVcGd0tujWrKxFI/edit?usp=sharing Please share your experience, feedback, and trading reports. Good
FREE
This indicator was developed to support multiple timeframe analysis. In the indicator settings, the user can set the color, width, and style of the horizontal lines for each timeframe. This way, when the horizontal lines are inserted into the chart, they will be plotted with the timeframe settings.
MTF Lines also allows visibility control of another objets like rectangles, trend lines and texts.
This is a product developed by Renato Fiche Junior and available to all MetaTrader 4 and 5 users!
FREE

The Wave Rider Indicator: Your Key to Confident Trading Tired of trying to guess market movements? The Wave Rider indicator is your solution. It's an intelligent tool designed to help you spot profitable trends with ease and confidence. What makes it so powerful? See Trends Clearly : Wave Rider simplifies complex market data, so you can easily identify the direction of the trend and make smarter decisions. Get Timely Signals : It gives you clear buy and sell signals, helping you pinpoint the be
FREE

The indicator My Big Bars can show bars (candles) of a higher timeframe. If you open an H1 (1 hour) chart, the indicator puts underneath a chart of H4, D1 and so on. The following higher timeframes can be applied: M3, M5, M10, M15, M30, H1, H3, H4, H6, H8, H12, D1, W1 and MN. The indicator chooses only those higher timeframes which are higher than the current timeframe and are multiple of it. If you open an M30 chart (30 minutes), the higher timeframes exclude M5, M15 and M30. There are 2 handy
FREE
Avantgarde: Grid This Expert advisor uses simple and robust grid method to place trades. simple and easy to use. https://www.mql5.com/en/signals/534678 How It Works: The EA does not use indicators but uses a math based solution to price-action. The EA will perform the same trades in any timeframe. Avantgarde Grid is equipped with money management, Autolot and DD close trade. Take care when setting the <step> as it will alter the aggressiveness. The Greater the step the less risk. Parameters Buy
FREE

This powerful tool helps you to easily access Fibonacci tools at different times and in different markets. This tool has the ability to send signals based on Fibonacci as well as setting alarms to be aware of broken Fibonacci levels. Among the capabilities of this tool are the following:
Identifies market trends Fibonacci auto design If Fibonacci levels are broken, it sends a message Send Fibonacci signal
Manuals: After selecting the target market, run the tool In the input settings according
FREE
Advanced Elder's Force Index (EFI) Indicator with multi timeframe support, customizable visual signals, and highly configurable alert system.
Features: Visual signal markers (arrows and/or vertical lines) with customizable colors and codes Three independent signal buffers with configurable triggers (direction change, level cross, peak/valley) Highly customizable alert functions for each signal (via email, push, sound, popup) Configurable alert timing (after close, before close, or both) Multi
FREE

Becktester Telegram Signals — Turn Telegram Signals into Real Backtests Automatically read signals from real Telegram channels , parse them (Buy/Sell/Entry/SL/TP), and backtest in MetaTrader 4 Strategy Tester . Verify parsing first with Live Parsing Test Mode . Important Information After purchasing the product, please leave a comment on the product page, and I will send you the Telegram Signal History Parser file. This file is not publicly available at the moment and is provided only to verifi

This expert advisor trades using the famous Parabolic Sar indicator and implements many other useful features for the exigent trader, like customizable indicator and trading settings, trading sessions and a martingale feature. [ Installation Guide | Update Guide | Troubleshooting | FAQ | All Products ] Easy to use and supervise Fully customizable parabolic sar settings Customizable break-even, SL, TP and trailing-stop Works for ECN/Non-ECN brokers Works for 2-3-4-5 digit symbols Trading can be
FREE

Features:
- Current TF GMMA Cross and Trend (Mandatory Check.. G-Up/G-Down) - HTF GMMA Trend Check (Optional.. slanting arrow) - TDI or NRTR Trend Check (Optional.. diamond)
Read post for detailed description and downloading extra indicators: https://www.mql5.com/en/blogs/post/758264
Scanner:
This is a Dashboard Scanner for finding good trades using the GMMA method as base and TDI method for trend verification. All buttons for all Pairs and Timeframes are clickable and will change the chart f

** All Symbols x All Timeframes scan just by pressing scanner button ** *** Contact me to send you instruction and add you in "ABCD scanner group" for sharing or seeing experiences with other users. Introduction This indicator scans AB=CD retracement patterns in all charts. The ABCD is the basic foundation for all harmonic patterns and highly repetitive with a high success rate . The ABCD Scanner indicator is a scanner reversal ABCD pattern that helps you identify when the price is about to ch

This EA trades using the CCI Indicator. It offers many trading scenarios and flexible position management settings, plus many useful features like customizable trading sessions, a martingale and inverse martingale mode. [ Installation Guide | Update Guide | Troubleshooting | FAQ | All Products ] Easy to use and supervise It implements three different entry strategies Customizable break-even, SL, TP and trailing-stop Works for ECN/Non-ECN brokers Works for 2-3-4-5 digit symbols Trading can be NF
FREE

Voici NAS100 Auto SL and TP Maker pour MT4 : Ne manquez plus jamais le réglage du StopLoss et du TakeProfit avec notre NAS100 Auto SL and TP Maker, un assistant indispensable pour les traders naviguant sur le marché du Nasdaq 100 sur MetaTrader 4. Cet outil est conçu pour ceux qui recherchent une solution transparente pour automatiser la gestion des niveaux de StopLoss et TakeProfit. Caractéristiques principales : Automatisation sans effort : Surveille automatiquement les transactions sur le Na
FREE

CPR Pivot Lines It Will Draw Pivot Point R1,R2,R3 S1,S2,S3 Tc Bc Best Part Is That You Can Even Add Values Of High,Low,Close Manually Also To Get Your All Levels On Chart. So If Your Broker Data Of High ,Low ,Close Is Incorrect Then You Don’t Have To Depend On Them Anymore. You Can Even Modify All Lines Style. It Will Show Line In Floating Style And Not Continues Mess.
FREE

The XR Gartley Pattern MT4 is an indicator which displays and alerts Gartley pattern detected on the candlestick chart. It also displays potential trade with calculated Take Profit and Stop Loss, Timeframe H1. After purchasing XR Gartley Pattern, you can immediately download this indicator from the MT4-MT5 Market and start using it because all features are set to default, is not necessary to change any parameter. In addition, we have created a private group for customers who have purchased one
FREE
This expert is a pure volatility scalper working with two pending orders (buy stop and sell stop). Expert not use any indicator, only use prices action and volatility of price to generate signals. There are three conditions for it to work: Tight spread Fast execution Stop level = 0 Please during the tests of this EA do not simultaneously use another EA in the same terminal because it affects the modification speed. Try expert on demo account first before use it on real one.
FREE

The indicator uses the Chester W. Keltner's channel calculation method, modified by the well-known trader Linda Raschke. Due to the modification, the calculated channel contains a much more complete overview of the price movements, which allows increasing the probability of an accurate prediction of the upcoming price movement. Unlike the classic Keltner method, the base line of the channel is plotted based on the Exponential Moving Average, and the Average True Range is used to calculate the up
FREE

What is a Point of Interest? Traders who follow Smart Money Concepts may call this a Liquidity Point, or where areas of liquidity have been built up by retail traders for for Big Banks to target to create large price movements in the market. As we all know, retail traders that use outdated and unreliable methods of trading like using trendlines, support and resistance, RSI, MACD, and many others to place trades and put their stop losses at keys points in the market. The "Big Banks" know these me

EA Mastermind – The Smart, All-in-One Trading Solution It’s time to stop relying on luck for your trading success.
Meet EA Mastermind — a premium, next-generation trading suite engineered by the BATIK Team , a collective of professionals in market analytics, algorithmic engineering, and intelligent trading design. EA Mastermind isn’t just another Expert Advisor — it’s a revolutionary ecosystem that fuses three intelligent systems into one seamless framework: AI Mastermind Signal Analyzer – deliv
FREE

This EA is designed to extract super profits. So he needs to be allowed big risks. It is better to start with a small account.
It is installed on the D1 chart and can wait a long time for the right moment. After that, it opens many orders in one direction.
The EA is designed for THE highly volatile USDZAR pair and is unlikely to be useful on other pairs.
Change the top three parameters to be like this:
Pair USDZAR
Currency USD,ZAR (between currencies comma without space)
sPair USDZAR
FREE

The program is use to copy trading from MT4 to MT4 and MT5 on same Windows PC or VPS . Now you can easy copy trades to any MT4 account or MT5 account. Instants copy, speed smaller 0.1 seconds, easy to setup. Need run EA as Signal provider on one MT4 account, other MT4 / MT5 will run EA as Trade copier. You can download and try demo version on demo account Copi Trade MT4 demo version here Copi Trade MT5 demo version here

Parce que le style compte
Je sais combien il est ennuyeux de cliquer à chaque fois sur les propriétés pour changer la couleur de la bougie, l'arrière-plan en clair ou foncé, et mettre ou enlever la grille. Voici la solution en un seul clic : Trois boutons personnalisables pour choisir le style de bougie que les commerçants souhaitent. Un bouton pour passer du mode jour au mode nuit. Un bouton pour afficher ou masquer la grille sur les graphiques. ***** Dans les paramètres, vous pouvez choisir
FREE

Clock GMT Live a tout ce dont vous avez besoin pour en savoir plus sur notre courtier, plusieurs fois vous vous serez demandé sur quel gmt je suis ou sur quel gmt mon courtier travaille, eh bien avec cet outil vous pourrez savoir en temps réel à la fois le GMT décalage horaire du broker et de votre heure locale, vous connaîtrez également en permanence le ping du broker Juste en le plaçant à un moment de la journée, vous pouvez obtenir les informations
Le prix augmente pour chaque acquisition,
FREE

Renko Charts with Heiken Ashi Filter now have the alerts and the Win-rate . Now you can know which signal will give you that edge your trading needs. Risk to Reward Settings Wins versus Losses Count There are four alert types to choose from for notification on screen, email or phone notification. The alert types also have buffers for use with automation. This indicator can be incorporated with any system that requires renko charts. The four (4) alert types are: Three-bar Formation ; Pinbar

This tool adds alerts to your Fibo Retracement and Fibo Expansion objects on the chart. It also features a handy menu to change Fibo settings easily and quickly!
Features Alert for Fibo Retracement and Fibo Expansion levels. Sound, Mobile and Email alert. Up to 20 Fibo Levels. Continuous sound alert every few seconds till a user clicks on the chart to turn it OFF. Single sound alert with pop-up window. Keeping all user settings even after changing timeframes. New handy menu to change Fibo setti

Description The BBMA + EMA50 Structure is a basic BBMA trading framework indicator combined with EMA 50 and First Momentum detection .
It helps traders to quickly identify market structure, momentum shifts, and potential entry points with clear visual signals. Key Features: BBMA Structure : Displays the essential Bollinger Bands + Moving Average framework. EMA 50 Filter : Helps confirm trend direction and structure bias. First Momentum Detector : Automatically detects the first momentum breako
FREE
Le MetaTrader Market offre un lieu pratique et sécurisé pour acheter des applications pour la plateforme MetaTrader. Téléchargez des versions démo gratuites de Expert Advisors et des indicateurs directement depuis votre terminal pour les tester dans le testeur de stratégie.
Testez les applications dans différents modes pour surveiller les performances et effectuez un paiement pour le produit que vous souhaitez en utilisant le système de paiement MQL5.community.
Vous manquez des opportunités de trading :
- Applications de trading gratuites
- Plus de 8 000 signaux à copier
- Actualités économiques pour explorer les marchés financiers
Inscription
Se connecter
Si vous n'avez pas de compte, veuillez vous inscrire
Autorisez l'utilisation de cookies pour vous connecter au site Web MQL5.com.
Veuillez activer les paramètres nécessaires dans votre navigateur, sinon vous ne pourrez pas vous connecter.