YouTubeにあるマーケットチュートリアルビデオをご覧ください
ロボットや指標を購入する
仮想ホスティングで
EAを実行
EAを実行
ロボットや指標を購入前にテストする
マーケットで収入を得る
販売のためにプロダクトをプレゼンテーションする方法
MetaTrader 4のためのエキスパートアドバイザーとインディケータ - 283
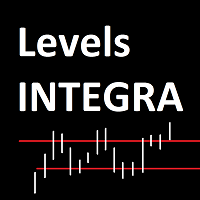
Levels_INTEGRA - это алгоритм глубокого сканирования рынка и вычленения наиболее важных ценовых уровней.
Параметры HISTORY_D1 - Глубина сканирования на Дневном графике. Color_Levels - Цвет уровней. Width_Levels - Толщина уровней. Selection_PRIORITY - Возможность выделения цветом приоритетных уровней (true - уровень выделен, false - выделение отсутствует). Color_PRIORITY - Цвет выделен

Это продвинутая версия продукта, бесплатная версия находится здесь .
Индикатор предназначен для торговли внутри дня. Строит канал по пробою крайних уровней которого вы можете открывать ордер на покупку или продажу. Во флетовом рынке работа ведётся на отбой от этих уровней. Для фильтрации входов используется цветная гибридная скользящая средняя. Настройки по умолчанию предназначены для терминального времени GMT +3 (подходит для большинства брокеров). Индикация канала и уровней ADR появляется начи
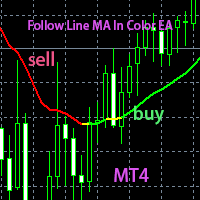
これは、カラー認識のカスタマイズ指標に基づいて作成されたEAである。 色は緑の時に少しずつです。 色が赤のときは空書を作る。 色が黄色になると、相場が逆転するという意味で、平倉や空倉があります。
パラメータの詳細 EA下の手の数 sl :止めるポイント 小型のポイント magIC :現在EAの注文マークは、他のEAまたはハンドメイドの識別番号と区別して、変更しないことをお勧めします。 移動止めポイント EA下の仕事の周期、修正しないことをお勧めします
これは、本人が長い時間を経て手作業をして単にして、正確な率が高くて、それから編纂した線の色によって、下の方向の指標を表示します。そして、指標信号によってEAを作成して、時間がなく、通貨は制限します。 現在のEAは、15分、30分、1時間、4時間周期で働き、効果が高いと思います。 現在のEAは1分または5分または1 day以上の時間周期を提案しないが、その指標は無制限であるが、効果はあまりよくない。 このEAの作業プラットフォームは、比較的に小さいトレーダーを選択したほうがよい。 このEAは1つの通貨に対して1枚だけ開かれます。 テス

Autobot Retracement Code (ARC) A robot trading that works based on retracement strategy while following the market trend.It has made average profits up to 25% /month that is relatively a High Return of Investment.Real Account proof. Fully automation. Auto Lot sizing, Auto TakeProfit Calculation, Auto StopLoss Calculation. Currently Running on Real account , it has more than 100% growth / 5 months. NEW UPDATE RELEASED, VERSION 3.0 FEATURES on Version 3:
FIFO rules
Auto LotSize Auto StopLoss

Everse is an Expert Advisor (EA) that build based on martingale, anti-martingale and hedging method. The main idea is place buy and sell in parallel, save the unprofitable positions with martingale, and take profitable positions as a bonus. The RSI, iClose, iHighest and iLowest indicators are used for entries. The highest and lowest prices are to indicate the range of new orders, where the next order, with same type must be higher than 75% of difference between this lowest and highest prices. An

the indicator showed excellent results in the scalping trade, and the same excellent results in the trading of exact instruments led to the fact that of these indicators showed themselves perfectly during the exit from the news with an during low volatility, This instrument has been tested for more than 1 month. What can we say about the number? It is reliable, accurate, at any time of trading. Atom Pro Maximum, this indicator showed excellent results in scalping trading. The accuracy of this

SpeedChan Leading indicator. Marks in the future two price channels - if the price comes into the channel, then the quote changes with the speed specified in the parameters. In these areas, price reversals are most likely. Two price channels are displayed - one on top, showing the growth rate; the second one - below, shows the speed of the fall. Channels are displayed as a solid center line and two borders drawn with a dotted line. In many cases, the area between the channels is not important fo

Karman is a fully automated trading advisor working on a М30 timeframe. The settings of the advisor are based on the safe trading, the essence of which is to close the transaction, while achieving a positive profitability dynamism of several points, which allows the user to reduce the costs of opening losing trades. The Expert Advisor is multi-functional and does not require a specific type of account for the normal operation of all functions embedded in it. The advisor’s manual involves encapsu

ZhiBiScalpingはあらゆるチャートサイクルに適しており、すべての市場の品種に適している真の手動スキャルピング取引システムです。
市場価格がAquaラインを下回った後、買い注文をすることができます; Aquaラインを内訳し続けて買い金額を増やすことができます。
市場価格が赤い点線を突破した場合は、売りシングルを行うことができます;赤い実線を突破して売りシングルを増やすことができます。
パラメータ設定:
[SPPeriod]:ZhiBiScalpingのメインサイクル。 [ATRMultiplier1]:点線で使用されているATR倍数。 [ATRMultiplier2]:実線で使用されているATR倍数。 [ATRPeriod]:ATRサイクル。 [alertsMessage]:これはアラームスイッチで、trueに設定されています。矢印が表示されている場合はプロンプトに自動的に警告され、falseに設定されている場合は警告されません。 [alertsEmail]:これはメールを送信するためのスイッチで、trueに設定します。矢印が表示されている場合はMT4で設定したメールボ

STFX MARTINGALIC FX Technologies EA STFX MartingalicFX The Expert Advisor can be used for Full Automatic and Semi Automated trading. EA STFX Martingalic has various strategies such as: Scalping, Averagging , Martingale, Anti Martingale and or combine the two Trading positions can be closed easily using panels such as close profit only, close buy, close sell, close all transactions The choice of indicators for position entries used is Smooth Moving Average , Multy Moving Average , MACD Divergence

You can choose any timeframe because all calculations are carried out according to special algorithms. The advisor trades only the symbols listed in the property Symbols, regardless of the symbol in which it is working. The market is subject to pattern-based fluctuations, which means it is fluctuations that often repeat themselves. A neural network has an undisputable advantage which is to memorize market fluctuations which generated both positive and negative trades. The neural network of this
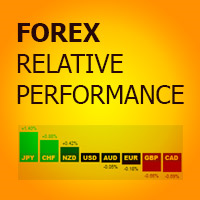
Forex Relative Performance indicator This indicator calculates the relative strength of major currencies against the US dollar. The basic idea behind this indicator is "to buy strong currency and to sell weak currency". This indicator allows you to quickly identify the best forex pair to trade according to your trading style (Intraday, Scalping, Swing, or Long Term) For demo testing please use MT5 version, because MT4 does not support Multicurrency Testing https://www.mql5.com/en/market/product/
This adviser finds the trend of the currency pair on a given number of bars, after that, determines the time of the correction. If the trend is strong enough, and the correction becomes equal to the one set in the parameters, the adviser can open a trade in the direction of the trend, if additional indications of indicators confirm the opening of the trade. This is good because it will not buy at the high or sell at the low of the trend, but only after the correction. Nevertheless, it is possibl
NightVision EA - is an automated Expert Advisor that uses night scalping trading during the closing of the American trading session. The EA uses a number of unique author's developments that have been successfully tested on real trading accounts. The EA can be used on most of the available trading instruments and is characterized by a small number of settings and easy installation. Live signal for NightVision EA: https://www.mql5.com/en/signals/author/dvrk78 Ask me for the recommended FX

The principle of the indicator. A simple moving average (SMA) with an averaging period (2n + 1) of bars is always obtained lagging by n bars. If SMA or other types of moving averages are the basis for making trading decisions, then their strong delay does not allow to open positions in time and close positions, which leads to losses. The Estimation moving average without lag ( EMAWL ) indicator calculates the non-lagging moving average, which is calcula

Эксперт для работы на основных валютных парах. Открытие сделок на основе анализа ценового движения. Вход в рынок отложенными динамическими ордерами, всегда выставляет StopLoss и TakeProfit, не использует мартингейл и усреднение. Робот не выходит за границы заложенной в него стратегии, соблюдает заданный уровень риска и контролирует расширения спреда, выбирая наиболее благоприятные моменты входа в сделку. Для эффективной работы желательно провести оптимизацию для каждой валютной пары. Для ускор

You can choose any timeframe because all calculations are carried out according to special algorithms. The advisor trades only the symbols listed in the property Symbols, regardless of the symbol in which it is working. The market is subject to pattern-based fluctuations, which means it is fluctuations that often repeat themselves. A neural network has an undisputable advantage which is to memorize market fluctuations which generated both positive and negative trades. The neural network of this

Идеология советника построена на постановке прямых и обратных ордеров. Прямые ставятся с постоянной начальной ставкой, ставка обратных постоянно возрастает. В момент достижения достаточного профита, все ордера закрываются одновременно, после чего начинается новая итерация. Пример работы советника в режиме реального времени можно посмотреть здесь. Входные параметры Program Language – выбор языка, на котором советник будет выводить сообщения (может быть русский или английский). Delay – время задер

The most effective signals generated by Ichimoku strategies. Ichimoku Trade Alarm is a supplement for Ichimoku Trade Panel and it shows the signals that Expert Advisor reacts to.
Visualization of signals: Price / Kijun sen cross - the candle body must be between Min_Candlestick_Body and Max_Candlestick_Body. The candle must close above / below Kijun sen, minimum in 1/3 of its body. Open candle must be located above / below Kijun sen. Chinkou span must be under the price of 26 periods in advanc

オープン設定でフルKUKA社。
EAは時間パターンを使用します。 金融市場での取引は、日中の循環的な活動をしています。 EAの最適化では、日中の最も活発なフェーズを特定して取引することができます。
のEA取引の双方向パターン、逆転パターンです。 EAのセットアップは複雑ではありませんが、長い時間がかかります。 したがって、"議論"セクションでは、多くの通貨ペアの設定ファイルが添付されます
あなた自身を設定するための掲示された指示。 EAは20個のブロックで構成されており、それぞれが独自の設定で別々のEAを表しています。
すべての以前に購入した専門家のアドバイザーからの卒シリーズに更新することとなりこのバージョンセットファイルに適用します。
設定。
ロットサイズ-ロットサイズ(リスク%"0"が使用されている場合")
リスク%-入金によりロットサイズ
スリッページ-許可された滑り
Spread-有効なスプレッド拡張
Magik_Number-ユニークナンバーアドバイザー
ブロック番号-ブロック番号
Block-true/falseを使用するこのブロックを使用

Venom indicator is a new type of indicator for scalping with high accuracy of correct predictions in the indicator you can select the indicator signal does not redraw, does not disappear, you can trust it 100% When a red blue arrow appears under the candlestick, an UP option is purchased. When red arrows appear, the DOWN option is purchased. the indicator is based on our new development, if there is an order with a large amount that opens in the direction we need, according to the analysis of th

Каждый трейдер должен периодически проводить анализ результатов своей работы на валютном рынке, чтобы выявить сильные и слабые стороны своей системы. Для этого было бы не плохо видеть всю статистику в понятных глазу цифрах, желательно объединенных в табличную форму, чтобы оценка стала более детальной, была возможность узнать текущую доходность, просадку, профит фактор и многие другие характеристики. Существует множество серверов в интернете, которые могут создать мониторинг вашей торговли, обр
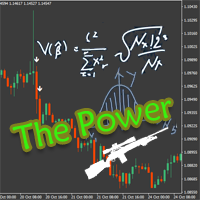
The Power calculates the strength of the long and short forces by the ratio of the price breakthrough to the average amplitude of the previous market. When the intensity is strong, the signal appears on the chart to estimate the direction of the next wave. There is no future function for the indicator. All signals will not move or disappear after they appear, and have a good real-world reference value. The indicator parameters allow the user to make individual adjustments. More EA and Indicators

This is a four strategy in one EA , but two of them have the same closing conditions if the Profit Target or Stop Loss is not reached , Strategy 2 and 3. The first strategy places Buystop/Sellstop orders at key price levels with small stops and closes by implemented indicator,after a certain number of bars or Take Profit function.The user may choose what option for closing may preffer . Close by Macd Offset parameter closes the order by Macd only after the number of bars for the open order h

Y-tax Telegram Bot sends text messages only to a group of telegrams or a channel of your choice. Messages are configured to display information about any trading activity on the account. A daily, weekly and monthly report is also displayed.
Below are the features of sending messages by a Y-tax Telegram Bot expert to a group / channel in a telegram:
Trading activities: opening, changing, closing deals and pending orders. This adviser does not need an active Auto Trading button. This Expert Advi

Hello investor! The author of ATS gave me the name Boom Boom Smer4 because I can break one currency pair into small pieces in four variations at the same time! This is far from my limit. What does an investor need from me!?
A large number of transactions?
Minimum deposit load?
Quality entry into the market?
Multicurrency?
Stable daily profit? The Trading Strategy, which the author laid in me, can do all this on his own!
PBX features: "Boom Boom Smer4" Analysis of several timeframes at t

Ultimate Price Predictor (Trade like a pro) Message Me Immediately After Purchase For Installation Help and Strategy
This is an arrow indicator that shows precise price reversals. A great arsenal to add to any chart.
Ultimate Price Predictor points price reversals with high degree of accuracy and it is great for scalping on the 5min time frame, Or swing trading on the 1hr time frame. Buy and sell arrows are shown on the chart as for entry signals. They do not repaint. *Great For Scalping *Grea
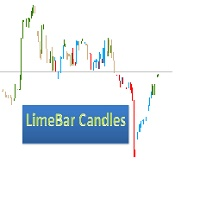
Colored candlesticks showing the trend. Based on the price action, it shows the trend and the possible moment of reversal.
No settings required. You can change the colors according to your preference.
Red and green show a trend beginning. The other two colors indicate a withdrawal or a contratrend. The indicator is used with resistance or support analysis. Make sure you use SL and TP, according to the price action.

BeST_Chande TrendScore Indicator points the start of a trend with high degree of accuracy and it is amazing for scalping on the 1min timeframe. It is also a simple way to rate trend strength. It indicates both the direction and strength of a trend and can be easily combined with various trend-following, swing and scalping strategies. As of a trend’s direction and strength a value of +10 signals a strong uptrend while a value of -10 signals a strong downtrend. Generally a positive score show

Boomerang Порядок работы
Советник не открывает следующий ордер, пока не закроется предыдущий. Советник не имеет блок модификации и не позволяет выставлять уровни TakeProfit и StopLoss, вместо этого выставляются уровни прибыли и убытка в денежном выражении. Это позволяет обойти минимальные уровни, установленные брокером. Номинальные значения, предустановленные в советнике соответствуют наибольшей эффективности на пятизнаке EURUSD и GBPUSD. Если в вашем терминале (у брокера) валютные пары имеют н

JRFX Trade Manager This product is a must have tool for every trader even if you trade manually or follow any signal providers via Telegram. You can set maximum 10 Take Profit levels and also you can choose the lot size what you wish to close as partial close at any Take Profit levels. At Take Profit 1 the EA will move SL to BE + X pips which is specified by you. At the next Take Profit levels you can set where you want the EA to move your Stoploss.
Settings Stoploss (Pips)
TakeProfit1 - Tak
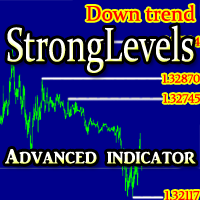
The indicator determines and reflects the significant support / resistance levels based on the algorithm for determining the volatility and the pattern in which the body of the candle is more than 2 times smaller than the size of the candle.
In addition, based on the received data, the indicator determines the prevailing current market movement. Settings: TimeFrame - timeframe to calculate; Candles in history - How many candles to take for analysis; Line color - the color of the support / resis
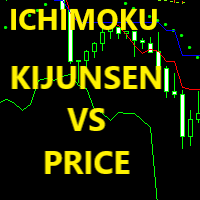
KijunSen vs Price Ichimoku Strategy MM Description in English and Italian =
This Indicator is based on one of the Strategies with Ichimoku Indicator, in particular is the cross of the KijunSen with the Current Price; it will give you of Buy and Sell when they Cross, with Arrows and Alerts.
When you attach the indicator on the chart , a window will open where , in the INPUT section, you can also choose to change the main Ichimoku values.
SIGNAL INPUT =
· BUY = when Price cross above the K

EAは急激な価格変動に対応しており、オープンポジションのロックとピラミッドを使用できます。仮想ストップが使用され(利益を得る、トレーリングストップ)、注文ロックと残高の%でのストップロスが損失を制限するために使用されます。同時に数十の注文を開くことができ、アドバイザーはロックから抜け出し、総利益に基づいてすべてのポジションを閉じるために無料の資金を必要とします。これは取引する商品の数を選択するときに考慮に入れる必要があります。
Expert Advisorは、設定された時間枠に依存しません。計算には価格と時間のみが使用されます(ただし、テストと最適化にはM1を使用することをお勧めします)。実際の口座で作業するには、スプレッドが最小でボラティリティが高い通貨ペアが推奨されます:EURUSD、GBPUSD、AUDUSD、USDCAD、USDCHF、USDJPY、NZDUSD。 Expert Advisorは通貨ペアでの取引用に開発されており、金属、契約、株式などではテストされていません。実際の口座にインストールする前に、少なくとも過去3か月間は実際のティックでExpertAdvis

If you use Resistance and Support Trendlines in your trading, this tool will be very useful for you! The Trendline Trading EA is a smart and easy tool to helps you in your trading using trendlines on your chart. Just create a trendline for the Resistance and Support, and the EA will create pending orders when the price touch the trendline. The following orders will be created when the price touch the trendline: Pending order in case the price breaks the trendline Pending order in case the price
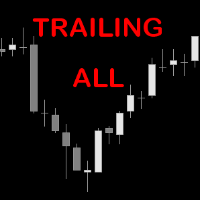
TrailingAll_8 The utility determines an average value of the same-direction orders and a starting profit profit provided that the directions of orders are different (SELL or BUY outweighs). It can set a general TP estimating it based on the profit pips. It is also capable of tralling the profit. The utility marks the points where the orders are opened, too.
Input paremeters
Find by comment - a space where you can specify the parameter of order choice within the "comment" column of t

Arrow indicator, for timely entry on price reversals The arrow appears on the closed bar and does not disappear. Allows you to enter the transaction at the very beginning of the movement Can be used on any currency pairs, metals and cryptocurrency Suitable for working with binary options
Distinctive features Does not redraw; Determines the price correction; Advanced settings for fine tuning; Works on all timeframes and on all symbols; Suitable for trading currencies, metals, options and cryptoc

AutoTrader GBPUSD is a fully automated Expert Advisor. Stop Loss on every trade Trailing Stops Good Risk/Reward Ratio The EA can trade 24/7 without the need of News Filter VPS is optional Timeframe: M1 Recommended deposit: 1,000 USD Recommended Leverage: 1:500 For better results you must use a broker with Low Spreads Recommended Setting: StopLoss: 65.0 TakeProfit: 00.0 TrailingStop: 90 The EA open buy/sell trades only in trends so by not having a fix TP and instead using trailing stops we

ALPC forex Matrix produces signals based on five different strategies . ALPC forex Matrix copies itself to all charts. Quick and easy management is your responsibility. Forex trading is fast control. ALPC MATRIX FOREX SYSTEM DOCUMENTATION !Please open the scalp process according to the hourly trend direction. (does not work with strategy test)
ALPC MATRIX 2015-2019 Supportive EA Tool for all Forex Pairs Producer: Mehmet Ozhan Hastaoglu ALPC MATRIX Forex System is actually a supportive tool wher

Expert Advisor was designed for traders who use Ichimoku strategy in their own trade. The control panel and its excellent functionality allow you to quickly set parameters for transactions and positioning. Ichimoku Trade Panel is a fully complet system that I created for my own trading needs. The strategy conveniently combines manual trading with automatic trading. Some unusual functions are the result of my individual experience and several years of my presence on the market. Having a ready sce
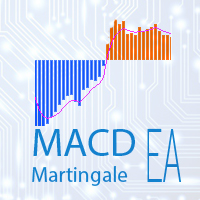
Macd Martingale is an automatic expert advisor that uses a fully adjustable martingale. The MACD indicator with adjustable parameters is used as inputs. The specified takeprofit and stoploss levels are used to exit the position. General recommendation
The minimum recommended deposit is 1000 cents or other currency depending on the parameters of your account. Spread is recommended not more than 3 points. It is better to use those currency pairs where there are a lot of trend movements in any dir

SCISSORS — is an automated trading scalping system. The strategy is based on enter signals given by a modified indicator Zig Zag; the EA opens two pending orders - sell stop и buy stop - on peaks of the indicator, at break (false break) the order activates and runs profit trail. Simply the EA is cutting all that higher/lower to Zig Zag peaks. Trading strategy —trend scalping without use of grid, martingale, averaging, using stop loss, take profit and trailing stop. The number of trades per mo

[ZhiBiCCI]インディケータは全てのサイクル使用に適しており、そして全ての市場品種にも適しています。
[ZhiBiCCI]緑色の実線は強気の発散の逆転です。緑色の点線は古典的な強気の発散です。
[ZhiBiCCI]赤への実線は逆弱気の発散である。赤い点線は古典的な弱気の発散です。
[ZhiBiCCI]はパラメータ(アラート、メール送信、通知送信)で設定でき、(true)に設定するとインスタント信号をアラームウィンドウに送信し、Eメール、インスタントメッセージを送信できます。
パラメータ設定の説明
[displayAlert]:これはアラームスイッチで、trueに設定され、矢印が表示されればプロンプトに自動的に警告され、falseに設定されれば警告されません。
[sendmail_NO_OFF]:これはメールを送信するためのスイッチで、trueに設定します。矢印が表示されていればMT4で設定したメールボックスにメールを送信し、falseに設定されていればメールを送信しません。
[sendnotification_NO_OFF]:これはインスタントメッセージを送信するた

This robot works in 60-minute periods. Opens a limited number of transactions when it reaches a specific transaction volume. You can run the following system if you want to open operations.
Set the amount of the lot from the set You can start the strategy test by typing the broker name of the Us30 or Dow symbol type and selecting the lot amount.
Symbol EA = US.30+ ( Sample Symbol Name Your Brokers )
Period : H1
( Cancellation and Money Back Guarantee within 7 Days )

No fabricated fake forward tests or meaningless optimized backtests. No artificial intelligence and similar things. In fact, there are frequently sharp differences between backtest results and actual results. One of the limitations of backtest is that they are generally prepared with the benefit of hindsight. Spider Bot Pro uses a developed innovative technology involving virtual grid. Simply put, Spider will build virtual grid in the background, using them to constantly monitor the market to he

This robot works in 15-minute periods. Opens a limited number of transactions when it reaches a specific transaction volume. You can run the following system if you want to open operations. Set the amount of the lot from the set You can start the strategy test by typing the broker name of the Brent or WTI symbol type and selecting the lot amount. Symbol EA = Oils+ ( Sample Symbol Name Your Brokers ) Period : M15 ( Cancellation and Money Back Guarantee within 7 Days )
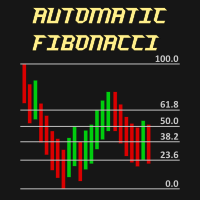
Automatic Fibonacci is an indicator for automatic Fibonacci Levels drawing. It is fully customizable by user. User can also select different Fibobonacci Levels by user settings or can use multiple Automatic Fibonacci indicator in one chart.
All details can be found >>HERE<<
Instructions Move Indicator to the chart (simply drag and drop) When pop up window appears select desired settings. Confirm settings and enjoy the Automatic Fibonacci indicator.
Features Any chart Any time-frame Custom

Eagle scalping is a fully automated Expert Advisor based on 3 EMAs and supporting 4 and 5-digit quotes. This EA provides the best results in an uptrend or a downtrend market. Main features: Scalping M5, M15 (best results M5) -Main Pair EUR/USD and any other pair -Money management (Risk reward and ratio % based on the account free margin) -Break Even and Trailing Stop -Days and Time Trading Management Recommendations EA Settings: Use default settings or the set file provided. Symbol: EURUSD Ti

Entry and Exit indicator simplifies the trading process by automatically providing the entry price and the take profit price with the appropriate stop loss. The indicator constantly monitors the market for the right entry conditions and send outs signals via push notifications to the trader's mobile phone or pc as desired. Hence a trader do not need to watch the chart all day but only act when signals are sent. This indicator is built around the 'H4 Engulfing System' and the 'Triple Stochastic S

A technical indicator that displays information about the trading volume in the form of a histogram of distribution by price levels. It is used as an independent indicator that helps to evaluate the current objective situation of the instrument, as well as in the format of integration with other methods of analysis, to confirm or filter when making trading decisions. Key Features:
Interactive profile update, real-time work Five modes of histogram calculation The possibility of separating the vol

ShangXia指標はすべてのサイクル用途に適しており、すべての市場セグメントにも適しています。 [ShangXia]上向きの矢印は(買)シグナルです。 [ShangXia]下向きの矢印は(売り)シグナルです。 [ShangXia]はパラメータ(アラート、メール送信、通知送信)で設定できます。アラームウィンドウにインスタントシグナルを送信するには(true)、電子メール、インスタントメッセージングに設定します。
パラメータ設定の説明
[alert_NO_OFF]:これはアラームスイッチで、trueに設定すると、矢印が表示されていれば自動的にプロンプトに警告し、falseに設定していれば警告しません。 [sendmail_NO_OFF]:これはメールを送信するためのスイッチで、trueに設定します。矢印が表示されていればMT4で設定したメールボックスにメールを送信し、falseに設定されていればメールを送信しません。 [sendnotification_NO_OFF]:これはインスタントメッセージを送信するためのスイッチです。trueに設定すると、矢印が表示された場合にモバイルデバイ

The Gold30 Expert Adviser, uses simple moving average crossover system on the XAU/USD pair.Best optimized perform in H1 chart.
Don't use any kind of martingale, grid or hedge. Is very lightweight in CPU / RAM resources. Only launches once at the beginning of the bar.
Is very easy to setup and don't require any extra supervision, can be connected 24x7. It can be used by newbies. Try Back Test and Try on Demo Account and execute on Real Account.

This expert has been designed with manual traders in mind. It allows you to: Place and manage orders faster with keyboard shortcuts and in a visual manner Setup entry and exit points directly in chart Easily control risk and money involved in each operation DEMO warning: If you want to try the demo version do not download it directly as keyboard events do not work in the strategy tester. Please go to the following link instead for a limited trial version : https://www.mql5.com/en/market/pro

This indicator show you the begin of the Trend by drawing (Up/Down) arrow. It works using compatibility of current fame and the next 3 frames to make it more professional and more profitable. Features:- Simply it gives you entry point as arrow (Buy / Sell) after candle closed. You can use it on time frames ( M1 , M5 , M15 , M30 ) are more profitable. You can use it on any currencies pair. It is historical indicator. No Repaint. No additional indicator needed. Easy to use.
Indicator parameters:-

Leprechaun Scalperは、"回復"(ロック)とバランス回復の統合システムを使用するマルチ通貨expert Advisorです。 EAは、それ自体が取引戦略であるカスタム指標"Elf"に基づいています。 アドバイザーの仕事の原則-内訳/ロールバックサポートレベル。 このバージョンでは、任意の通貨ペアと時間間隔で成功した取引のためのパラメータを設定する潜在的な能力が拡張されました。 ニュースがリリースされたときにexpert Advisorを無効にするための2タイ トレンドの方向を決定するための追加の指標を追加しました。 Expert Advisorは、積極的な(高リスクの高収入)または穏やかな(最小限のリスク)など、あらゆる取引スタイルに対して設定できます) あなたのバランスを保護するために、ヘッジ位置(ロック)と"ロック"からの出口のシステムが統合されています。 "ロック"終了システムは、買い/売り残高を乱すことなく、ロットの均一な数でポジションを閉じます。
https://youtu.be/Bo7H6P3PQEc これは、 専門家 顧問できると同時に12通貨と異なる時

この指標は、2つの修正されたLanczosフィルタの組み合わせです。 最初のフィルターは、価格を推定するのに役立ちます。過去の値に基づいて、彼は現在のバー内で起こりうる価格変動を予測します。つまり、過去の傾向が変わらない場合の価格はどうなるかを示しています。 ウィンドウ内の価格を平滑化および平均化するための2番目のフィルタ。フィルタのレベルによって決まります。ウェイトの選択のおかげで、このフィルタは価格変動の中にある周期成分に最も積極的に反応します。 指標は EF および IF パラメータを使用して調整できます。 EF と IF の値を選択することで、トレンド価格変動の始まりに関するシグナルを得ることができます。 EF - 指数フィルタのウィンドウサイズ。有効な値は EF = 0 ... 255 です。計算中に処理された小節の数は 2 * EF + 1 です。このパラメータが大きいほど、価格系列の過去の値の影響が強くなります。結果は実線でプロットされています。 IF - 平均化ウィンドウのサイズを調整します。 IF = 0 ... 255 の値計算されるバーの数は 2 * I
Demark Sequential - is an indicator that shows a structure of the trend, its start point and main turning points. And it check it's conditions on the beginning of the candle, so it will be never repainted.
This indicator hasn't any complex formulas, only some bars countdown, but it can be very helpful, especially with some levels indicator such as Fibo or Gann levels (like this ). Algorithm is so simple, but powerful: Setup - starting when current bar closed higher (or lower for short) then clos
このZiYouShuaDanWangEAはEURGBPの30分周期でしか使用できず. EURGBP M30
以下は、パラメータの説明です。
[Daily_Profit_Value_Switch]:trueに設定されている場合、つまり[Profit_as_of_today]に到達した後は開かれません。 [Profit_as_of_today]当日の利益が100より大きいかどうか、100より大きい場合は、同じ日にポジションをオープンすることはありません。 [Single_switch_on_Friday]:falseに設定した場合、つまり毎週金曜日にポジションをオープンしないでください。
[Initial_Lots]は最初の注文のロット数でもあります;後者はこの倍数の倍数に基づいています。
[Maximum_odd_number_of_holdings]は未処理の注文がいくつ許可されるかです。
[Add_single_switch]:trueに設定されている場合、ウェアハウススイッチを追加します(つまり、開いた状態になります)。
[Odd_multiple]は各注文の単一の金額

EURUSD M15で使用される、15分足チャート - [EUR / USD] トップとボトム、次にトップとボトムの注文を完全に分析し、直ちにストップロスを設定します。注文が確定した後、市場が後退した場合、EAは再度注文を追加しますパラメータに表示される回数と距離は5回、実際の最大注文は4回追加され、追加された注文は直ちに設定されます。ストップロス、セットストップロスは最初の注文のストップロスと同じです。彼らが収益性があるとき注文は自動的に利益を保護します。 このEAはストップロスを伴う従来の取引方法を使用しており、ストップロスは小さいので、テストファンドマップは良くありません。
注:使用する場合は、[Interval_or_continuous]パラメータをfalseに設定してください。 falseに設定すると、利益を保護してリアルタイムで市場をフォローできます。 [Initial_lot]は最初に配置されたロットの数です[Auto_Lots]がtrueに設定されている場合、このパラメータは無効です。 [Auto_Lots]は、正味額に基づいて自動的にロットを調整します。平均は1

Introducing AMAN Signals.
An MT4 Indicator that predicts the trend where the prices are heading!
Indicator parameters Period 1 : the number of bars used for the indicator calculations. Proper values - Above 21. Multiplier 1 : Proper values - from: 5. Period 2 : the number of bars used for the indicator calculations. Proper values - Above 21. Multiplier 1 : Proper values - from: 5. Using the AMAN Signals FAST Indicator: Green: Buy or Bullish Candle Red: Sell or Bearish Candle Strength Percentag

I recommend you to read the product's blog (manual) from start to end so that it is clear from the beginning what the indicactor offers. This multi time frame and multi symbol divergence dashboard indicator sends an alert when one or two different divergences have been identified. It can be used with all time frames from M1 to MN. It is possible to enable moving average or RSI trend filter to filter out only the strongest setups. It should be combined with your own confirmation rules, techni

Trade with Gann on your side!! MASTER CIRCLE 360 CIRCLE CHART, originally created by Gann admitted that this is “The Mother of all charts”. It is one of the last studies that this great trader left for us. The numeric tab le is apparently quite simple like all the tables and is based on square numbers, the SQUARE OF 12 and is by evolution, one of the most important square numbers. Here we can find CYCLE, PRICE AND TIME thanks to angles and grades, to show past and future support and resistance.
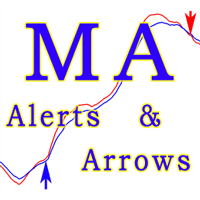
This indicator MA Alerts with Arrows gives you the opportunity to receive signals about the intersection of two moving averages (Moving Average), as well as signals about the price rollback to MA - to enter the transaction. Alert options: Sound and text alerts (alert). Push notification to the mobile terminal. Email notification (message to your e-mail). Visual alert (arrows on the chart). The indicator has the following features: To display or hide the moving averages and arrows themselves. T

T-Explorer is a Real Time Optimized MetaTrader 4 tool that provides tradable information based on the 10 of the most popular and reliable technical indicators in many timeframes. Our machine learning models calculate the optimum rules and configuration for each indicator in order to provide high probability signals of success. Users are able to customize T-Explorer by selecting suitable timeframes and mode ( FAST, MEDIUM, SLOW ) for the indicators to be used. T-Explorer aggregates an

Currency Explorer is the absolute tool for traders that want to know with quantified certainty the currency strength & weakness of each currency and to trade these by using applicable strategies. Our machine learning models run and provide the strength/weakness of each currency based on multiple factors besides price action. It provides the trader with a QUANTIFIED result for the strength of the 8 most popular and major currencies (EUR, USD, JPY, GBP, AUD, NZD, CAD and CHF) with a scale

Χ15 indicator is a MetaTrader 4 tool that allows you to BUILD & BACKTEST ON REAL TIME your own strategies quickly, easily and efficiently. It contains 15 of the most popular technical analysis indicators that you can use, each one in a different way. Choose the indicators that you want to use, select how you will use them and you will see on the chart BUY (green) and SELL (red) arrows implementing your strategy. Choose Take Profit and Stop Loss and you will see the results of your strategy w

Pattern Explorer is a reliable tool for applying all the power of the most popular Japanese Candlestick Patterns . It uses Machine Learning algorithms to confirm all the patterns. What is the most impressive thing about it? Select Take Profit and Stop Loss and click on “Backtest your strategy” button to backtest your strategy in real time and to see according to your selection: Total signals Testable signals (signals that are reliable to be tested) Profitable signals (%) Loss signals (%) T

With this software you can test your Forex strategies live. Compatible with Meta Trader 4. Extra features are available. You can trade through the panel. You can put signs with Fish Hook. In addition, your strategy test is saved to the file folder in csv format. You can review these reports with CSV Quick Viewer. One Lot can do with Scalp. Your account also determines the lot based on the amount of money found. It gives you information about the transaction before you open the transaction. You c

This is our Expert Advisor base on research over the Internet. This Expert Advisor use RSI check TF 1 Hour and for execution, Install it at TF 5 Minutes (double Check 24 last bar), It's code contains CCI Filter as consideration for Long or Short Trade. When the market turned to wrong direction, expert advisor will double it lot in the same direction, until all the losses on the OP before it will be covered. This EA include News Management, so it doesn't trade when there is high impact news. It's

ATTENTION : The Tiger Locker EA can not be tested in the MT4 strategy tester !!!
Tiger Locker EA robot is a very Powerful tools and a fully automated robot for Forex trade. Tiger Locker EA is a combination numerous special trend strategy ,that It provides the possibility the best entries of the trade . Tiger Locker EA robot is designed for medium and long term trading ,the robot will help you deal with and manage emotions ,and you don't need worry about news release any more !! The tren
MetaTraderマーケットが取引戦略とテクニカル指標を販売するための最適な場所である理由をご存じですか?宣伝もソフトウェア保護も必要なく、支払いのトラブルもないことです。これらはすべて、MetaTraderマーケットで提供されます。
取引の機会を逃しています。
- 無料取引アプリ
- 8千を超えるシグナルをコピー
- 金融ニュースで金融マーケットを探索
新規登録
ログイン